Visitor Economy
(Tourism & Culture)
Data Pack
Final Version 23.04.2018
CONFIDENTIAL
Contents
Page
-
Introduction to the Sector Data Pack
3
-
Introduction to and Definition of the Visitor Economy
3
-
The Visitor Economy in New Anglia
4
o Overview
5
o Employment
9
o Enterprises
23
-
Visitor Economy Skills Supply and Demand
30
o Qualifications
31
o UKCES Employer Skills Survey sector analysis
33
▪ Vacancies
34
▪ Skills Gaps
35
▪ Training
36
▪ Staff
38
o Further Education Learning Aims analysis
39
o Apprenticeships
46
o Labour Insight Jobs tool sector analysis
49
o
‘Where the Work is’ tool sector analysis
56
-
A Future View of the Visitor Economy
61
-
Appendix - Visitor Economy sector definition
78
2
Introduction to the Sector Data Pack
The role of the Sector Data Pack is to bring together the latest socio-economic and labour market data and present both an up-to-date, and
future view, of the sector and any underlying issues within the area that could impact upon it. Data is presented in a navigable format without
comment with interpretation at this stage left to the reader
The Data Pack informs the Sector Evidence Report, the key findings from which help to inform the priorities developed in the Sector Skills Plan.
The Sector Evidence Report is also summarised within the Sector Skills Plan and appears in full in the its appendices.
In most instances data has been analysed and presented down to local authority level. In some instances, and even where local authority data
is available, it has not been presented in the data pack due to issues of unreliability and small sample sizes. This is particularly the case with
data from the Annual Population Survey and the Annual Survey of Hours and Earnings.
Introduction to and Definition of the Visitor Economy
In terms of local skills planning for New Anglia, it was decided that the needs of the ‘tourism’ and ‘culture’ sectors are quite different and a
sector plan for each has been developed - led by Visit East Anglia and the New Anglia Cultural Board respectively. However, in terms of the
data pack then in the main, data has been provided for the overall ‘Visitor Economy’ except for some key variables.
The definition of the tourism sector used by New Anglia LEP covers Accommodation for visitors; Food and beverage serving activities; rail,
road, water and air passenger transport; transport equipment rental; travel agencies and other reservation service activities, cultural activities;
sporting and recreational activities; country-specific tourism activities plus culture and the arts. The sector can often be referred to as ‘Tourism’
with significant overlaps between ‘Tourism’ and ‘Cultural’ Sector activities such as heritage, sport, conferences and events. It is also worth
noting that there is some overlap between what is considered ‘tourism’ and that deemed ‘arts’ in respect of cultural tourism.
The definition of the culture sector used by New Anglia LEP broadly follows that used by the Department for Culture, Media and Sport to define
the Creative Industries. However, that definition used by New Anglia differs in some key areas in that it does not include activities related to
‘advertising and marketing’, ‘architecture’, and ‘specialised design activities’. In addition, the New Anglia definition of the sector captures activity
around sports, amusements and recreation, and some specialised retail. The sector can also be referred to as ‘Culture and the Arts’ and
overlaps significantly with Digital Tech sector activities such as publishing, production, and certain manufacturing elements. It is also worth
noting that there is some overlap between what is considered ‘tourism’ and that deemed ‘arts’ in respect of cultural tourism.
For full definitions of each element of the sector then please refer to the appendix.
3
The Visitor Economy in
New Anglia
4
Overview
Visitor Economy (Tourism & Culture) contribution to
the local economy
7,140
89,100
78,200
5,895
£2.3bn
£2.0bn
2,535
26,300
£676m
Source: New Anglia LEP Economic Strategy evidence base work
Please note that figures do not sum due to the overlapping nature of
Tourism and Culture definitions in producing the Visitor Economy
5
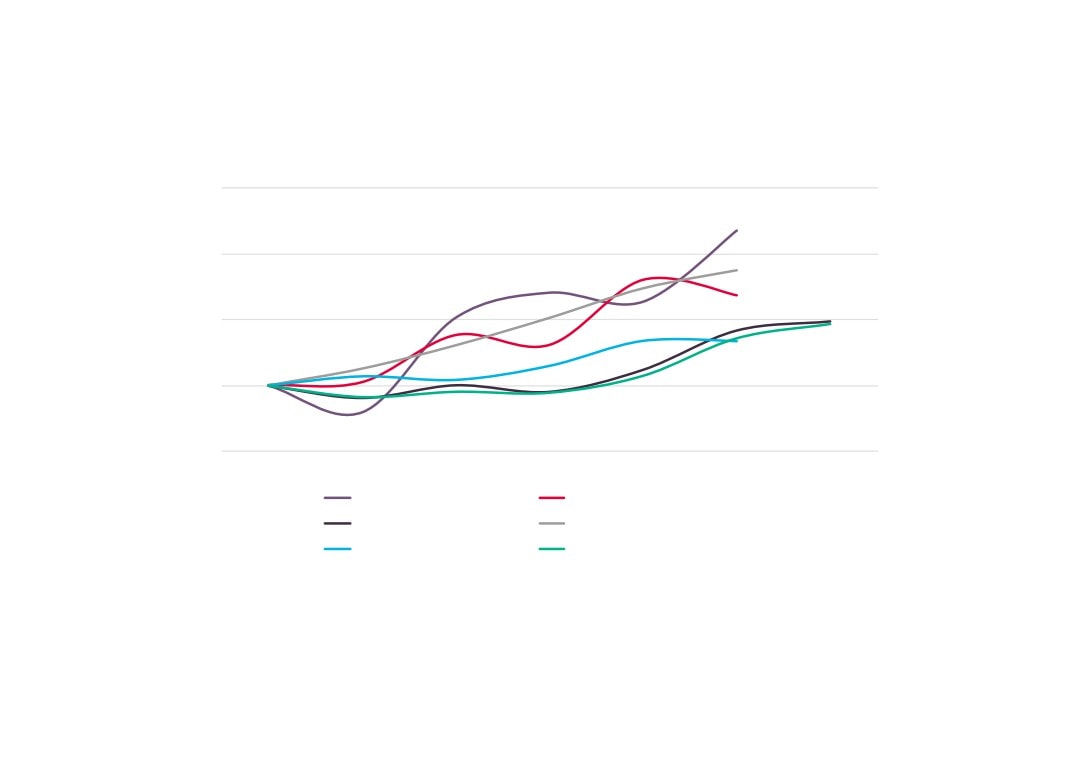
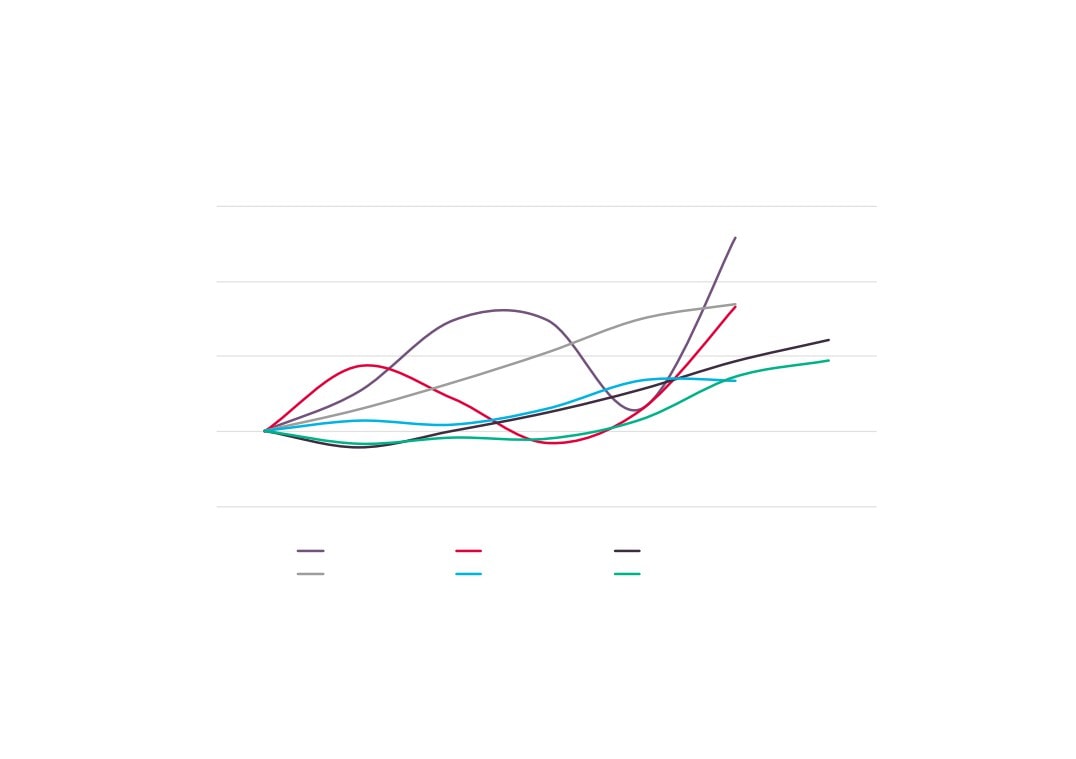
Visitor Economy contribution to growth in the local economy (2010=100)
130
120
110
100
90
2010
2011
2012
2013
2014
2015
2016
Visitor Economy GVA
Visitor Economy Employment
Visitor Economy Enterprises
Total GVA
Total Employment
Total Enterprises
Source: New Anglia LEP Economic Strategy evidence base work
6
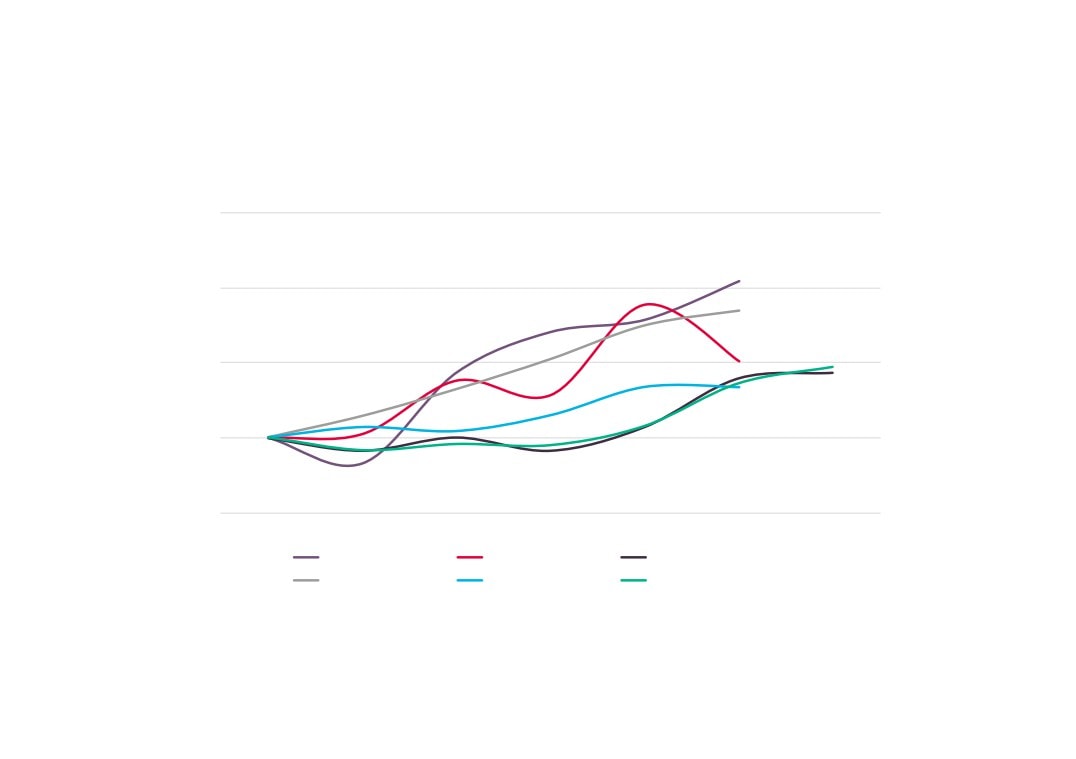
Tourism Sector contribution to growth in the local economy (2010=100)
130
120
110
100
90
2010
2011
2012
2013
2014
2015
2016
Tourism GVA
Tourism Employment
Tourism Enterprises
Total GVA
Total Employment
Total Enterprises
Source: New Anglia LEP Economic Strategy evidence base work
7
Cultural Sector contribution to growth in the local economy (2010=100)
130
120
110
100
90
2010
2011
2012
2013
2014
2015
2016
Culture GVA
Culture Employment
Culture Enterprises
Total GVA
Total Employment
Total Enterprises
Source: New Anglia LEP Economic Strategy evidence base work
8
81,400
New Anglia
72,865
Employment
21,600
45,400
Norfolk
40,650
11,725
36,000
Employment provided by the
Suf folk
32,360
Visitor Economy (Tourism and
9,645
37,600
Culture) across comparator
Cornwall and Isles of Scilly LEP
35,045
6,415
areas, 2015
42,600
Source: Business Register and Employment
Dorset LEP
40,010
Survey, Office for National Statistics
8,130
GCGP LEP
Visitor Economy
21,900
42,400
Tourism
Greater Lincolnshire LEP
39,435
8,620
87,700
Cultural
Heart of the South West LEP
81,545
16,710
London LEP
266,325
5
186,700
South East LEP
162,640
49,190
288,700
88,700
East of England
246,360
82,480
9
12.0%
New Anglia
10.8%
3.2%
12.6%
Norfolk
11.3%
3.3%
11.4%
Suffolk
10.3%
3.1%
17.7%
Cornwall and Isles of Scilly LEP
16.5%
3.0%
13.1%
Visitor Economy
Dorset LEP
12.3%
2.5%
Tourism
GCGP LEP
Cultural
2.9%
10.0%
Greater Lincolnshire LEP
9.3%
2.0%
12.3%
Heart of the South West LEP
11.5%
2.4%
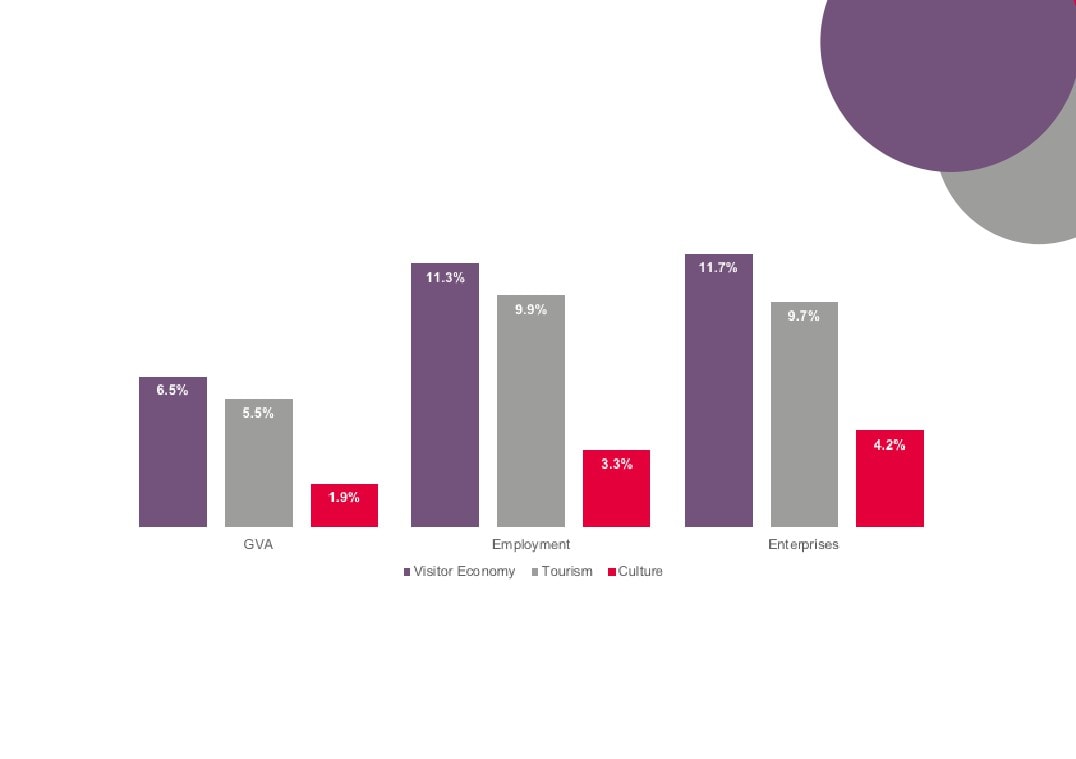
Proportion of employment
provided by the Visitor
London LEP
5.3%
Economy (Tourism and
11.7%
South East LEP
10.2%
Culture) across comparator
3.1%
areas, 2015
10.7%
East of England
9.1%
Source: Business Register and Employment
3.1%
Survey, Office for National Statistics
11.6%
England
10.1%
3.2%
10
6,415
42,600
Dorset LEP
40,010
8,130
GCGP LEP
Visitor Economy
21,900
42,400
Tourism
Greater Lincolnshire LEP
39,435
8,620
87,700
Cultural
Kings Lynn a
Heart of the South West LEP
81,545
16,710
London LEP
266,325
186,700
South East LEP
162,640
49,190
288,700
East of England
Employment provided by
246,360
the
82,480
Visitor Economy (Tourism
4,700
Forest Heath
4,415
and Culture) across New
1,155
6,800
Anglia, 2015
Ipswich
5,800
2,270
3,200
Source: Business Register and Employment
Mid Suffolk
2,830
Survey, Office for National Statistics
940
5,100
St Edmundsbury
4,490
1,455
6,500
Suffolk Coastal
5,760
1,575
5,900
Waveney
5,450
1,325
11
8.7%
Breckland
7.9%
2.6%
10.1%
Broadland
9.1%
2.3%
20.2%
Great Yarmouth
19.6%
3.8%
10.8%
Kings Lynn and West Norfolk
10.3%
2.1%
81,400
North
New Anglia
72,865
21,600
Proportion of employment
N
45,400
Norfolk
40,650
provided by the Visitor
South
11,725
Economy (Tourism and Culture)
36,000
Suf folk
32,360
across New Anglia, 2015
9,645
Source: Business Register and Employment
37,600
B
Survey, Office for National Statistics
Cornwall and Isles of Scilly LEP
35,045
6,415
Fores
42,600
Dorset LEP
40,010
I
8,130
Mid
GCGP LEP
Visitor Economy
21,900
42,400
St Edmun
Tourism
Greater Lincolnshire LEP
39,435
8,620
Suffolk
87,700
Cultural
Heart of the South West LEP
81,545
W
16,710
London LEP
266,325
186,700
South East LEP
162,640
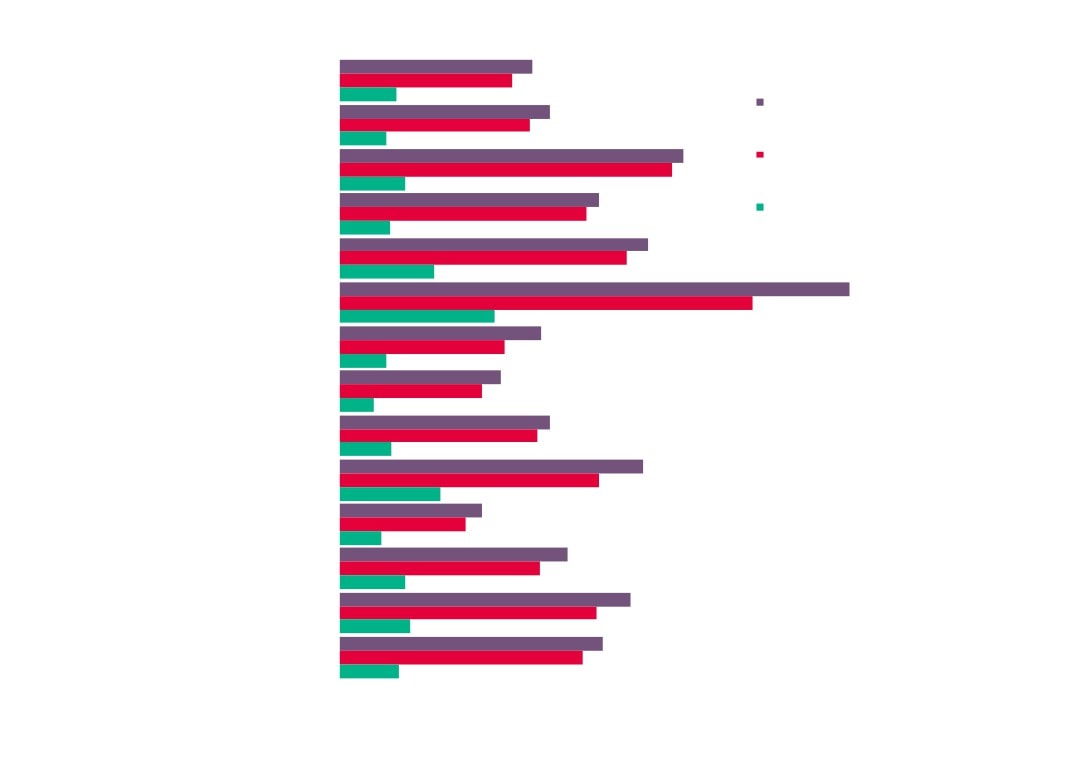
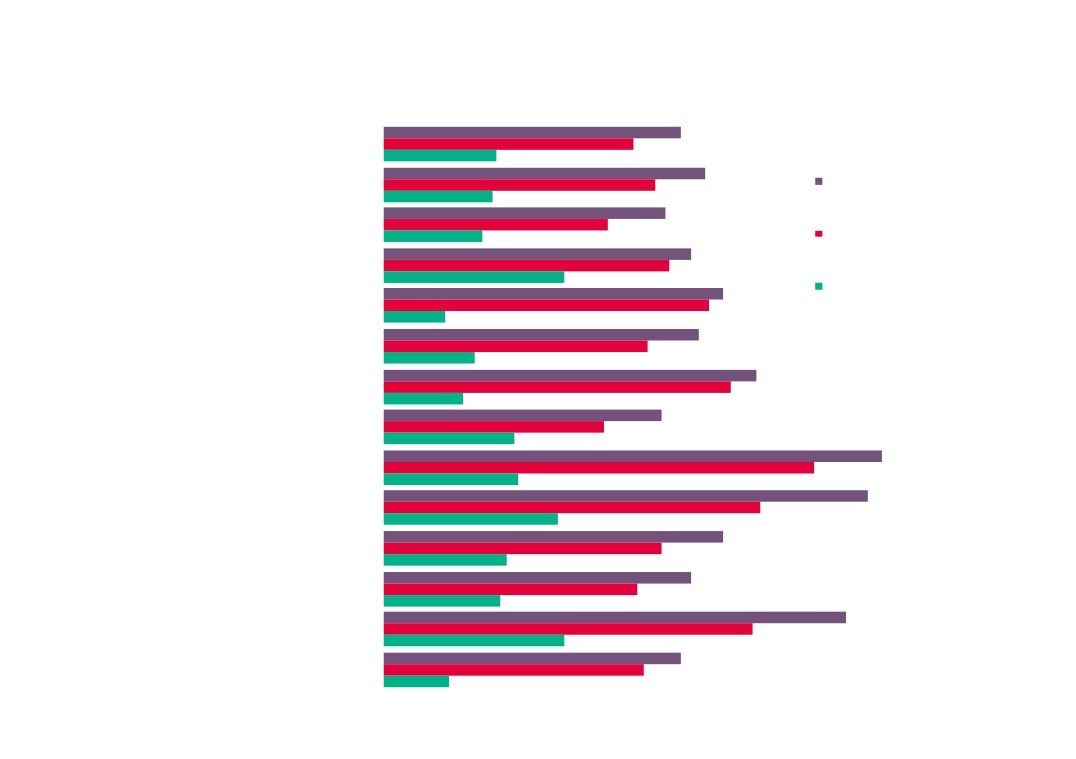
Change in Visitor Economy (Tourism and Culture) employment across
comparator areas, 2010 - 2015
11%
New Anglia
9%
15%
15%
Norfolk
12%
17%
6%
Suffolk
5%
4%
-6%
Source: Business Register
Cornwall and Isles of Scilly LEP
-6%
and Employment Survey,
-28%
Office for National Statistics
2%
Dorset LEP
3%
-9%
GCGP
11%
6%
Greater Lincolnshire LEP
6%
-12%
-10%
Heart of the South West LEP
-10%
-19%
London LEP
15%
17%
South East LEP
Visitor Economy
17%
16%
15%
Tourism
East
11%
16%
Culture
12%
England
13%
8%
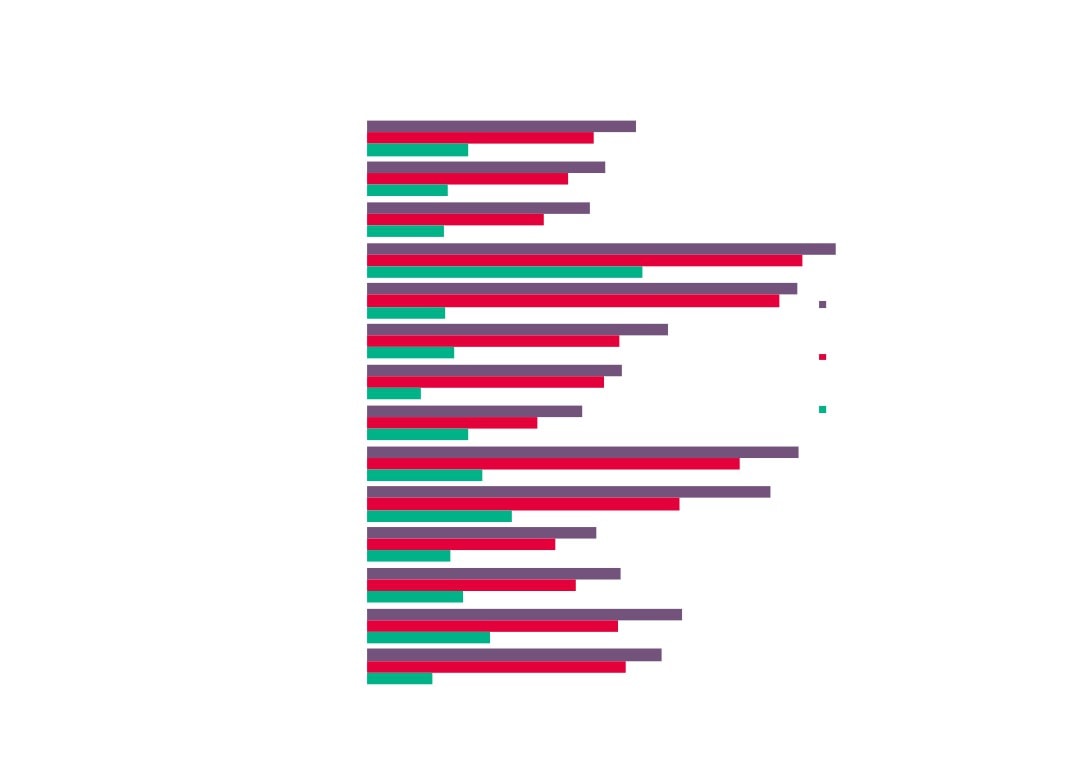
13
11%
Babergh
9%
13%
Breckland
-7%
32%
31%
Broadland
27%
48%
-5%
Forest Heath
-7%
81,400
New Anglia
72,865
Change in Visitor Economy
Great Yarm
21,600
(Tourism and Culture)
45,400
Norfolk
40,650
employment across New
Ips
11,725
Anglia, 2010 - 2015
36,000
King`s Lynn and West N
Suf folk
32,360
Source: Business Register
9,645
and Employment Survey,
Mid S
37,600
Office for National Statistics
Cornwall and Isles of Scilly LEP
35,045
6,415
North N
42,600
Dorset LEP
40,010
Nor
8,130
GCGP LEP
Visitor Economy
South N
21,900
42,400
St Edmunds
Tourism
Greater Lincolnshire LEP
39,435
8,620
87,700
Suf folk Co
Cultural
Heart of the South West LEP
81,545
16,710
Wav
London LEP
266,325
186,700
South East LEP
162,640
49,190
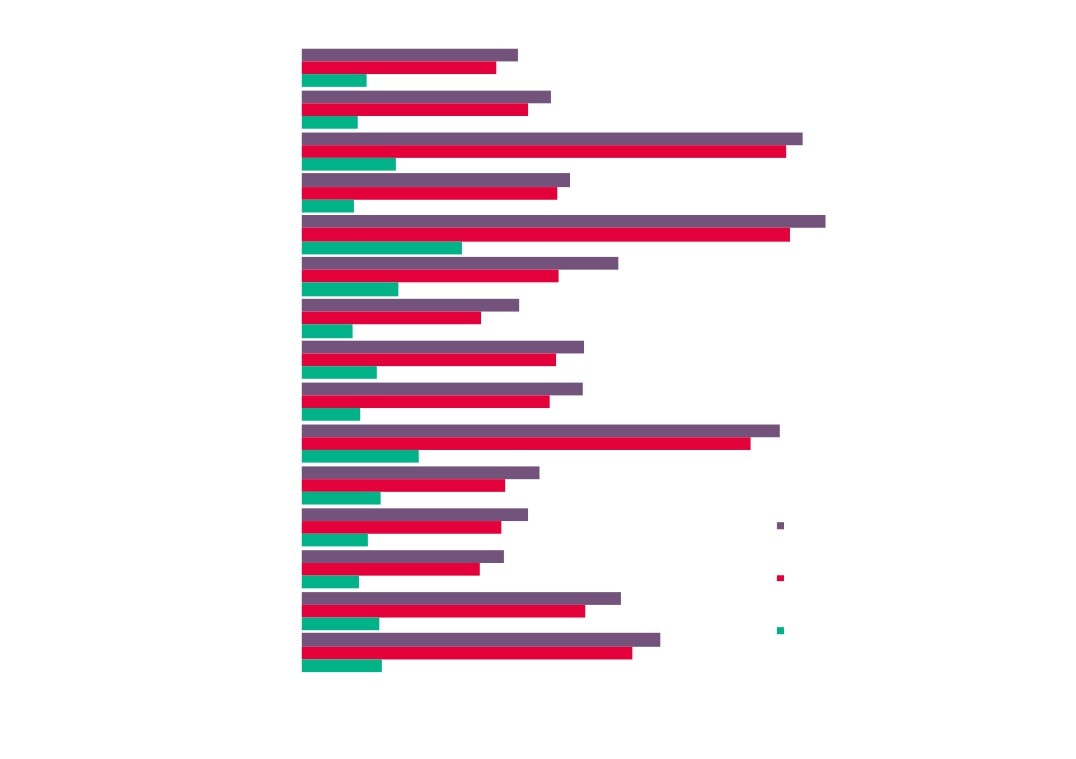
Top Visitor Economy sub sectors by employment, 2015
% of total Visitor
Change in
Industry Sector Code
Industry Sector Name
Employment
Economy
employment 2010 -
employment
2015
56302
Public houses and bars
13,300
15%
15%
55100
Hotels and similar accommodation
8,900
10%
-5%
56101
Licensed restaurants
8,500
9%
26%
56102
Unlicensed restaurants and cafes
6,000
7%
87%
93110
Operation of sports facilities
4,000
4%
-6%
56103
Take away food shops and mobile food stands
3,900
4%
22%
55201
Holiday centres and villages
3,400
4%
1%
55300
Camping grounds, recreational vehicle parks and trailer parks
3,100
3%
46%
93290
Other amusement and recreation activities
3,000
3%
60%
56210
Event catering activities
2,700
3%
-29%
Source: New Anglia LEP Economic Strategy evidence base work
15
Top Visitor Economy sub sectors with 100 employees or more by growth in
employment
% of total Visitor
Change in
Industry Sector Code
Industry Sector Name
Employment
Economy
employment
employment
2010 - 2015
59112
Video production activities
200
0.2%
1893%
58210
Publishing of computer games
100
0.1%
1673%
77210
Renting and leasing of recreational and sports goods
900
1.0%
1340%
56290
Other food service activities
1,700
1.9%
778%
82301
Activities of exhibition and fair organizers
100
0.2%
386%
58142
Publishing of consumer, business and professional journals and periodicals
1,700
1.9%
325%
59131
Motion picture distribution activities
100
0.1%
231%
59200
Sound recording and music publishing activities
300
0.3%
192%
49100
Passenger rail transport, interurban
1,000
1.1%
191%
Source: New Anglia LEP Economic Strategy evidence base work
16
Visitor Economy location quotients
across comparator areas, 2015
1.0
New Anglia
1.0
1.1
Norfolk
2015
1.0
1.0
2010
Suffolk
1.0
1.5
Cornwall and Isles of Scilly
1.7
1.1
Dorset
Location quotients (LQs) are a
1.2
useful way of showing a sectors
0.9
importance to the local economy
Greater Lincolnshire
relative to the national picture. The
0.9
analysis presented here uses
1.1
employment with an LQ above 1
Heart of the South West
1.3
showing a higher concentration than
nationally, and an LQ of below than
1.0
1 a lower concentration.
South East
1.0
Source: Business Register and Employment Survey, Office
for National Statistics
17
Visitor Economy location quotients
across New Anglia, 2015
1.0
Babergh
1.0
0.8
Breckland
1.0
0.9
Broadland
0.7
1.7
Forest Heath
1.8
1.7
Great Yarmouth
1.6
0.8
Ipswich
0.9
2015
King`s Lynn and West
0.9
Norfolk
0.9
2010
0.8
Mid Suffolk
0.8
1.8
North Norfolk
1.6
1.1
Norwich
1.1
0.7
South Norfolk
0.8
0.7
St Edmundsbury
0.8
1.1
Suffolk Coastal
1.1
1.2
Waveney
1.4
Source: Business Register and Employment Survey, Office for National Statistics
18
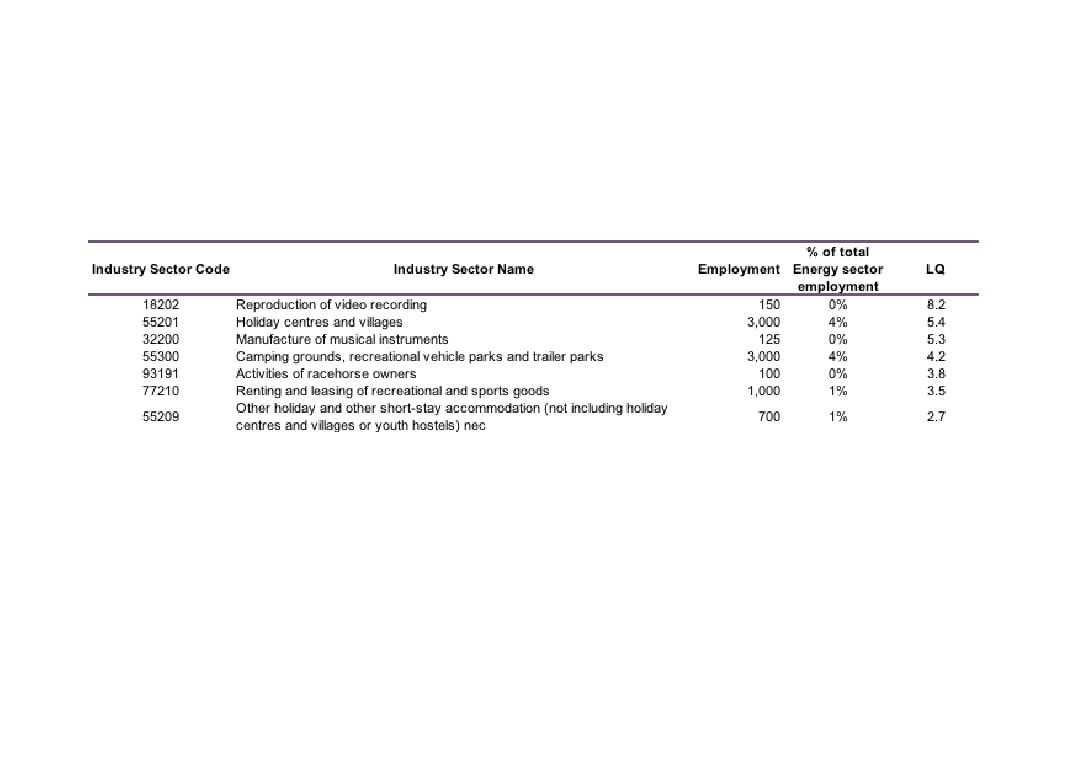
Visitor Economy sub sectors with location quotients (LQs) above 2
Source: Business Register and Employment Survey 2015, Office for National Statistics
19
Full time, part time, and self-employment in the
Visitor Economy (Tourism and Culture), 2015
New Anglia
57%
29%
14%
Culture
40%
39%
21%
Tourism
39%
51%
11%
Visitor Economy
40%
48%
12%
0%
Full time
Part time
Self Employed
100%
Source: New Anglia LEP Economic Strategy evidence base work
20
0%
100%
New Anglia LEP
22%
5%
15%
6%
7%
34%
9%
Norfolk
23%
5%
15%
6%
6%
34%
9%
Suffolk
21%
4%
15%
7%
9%
33%
10%
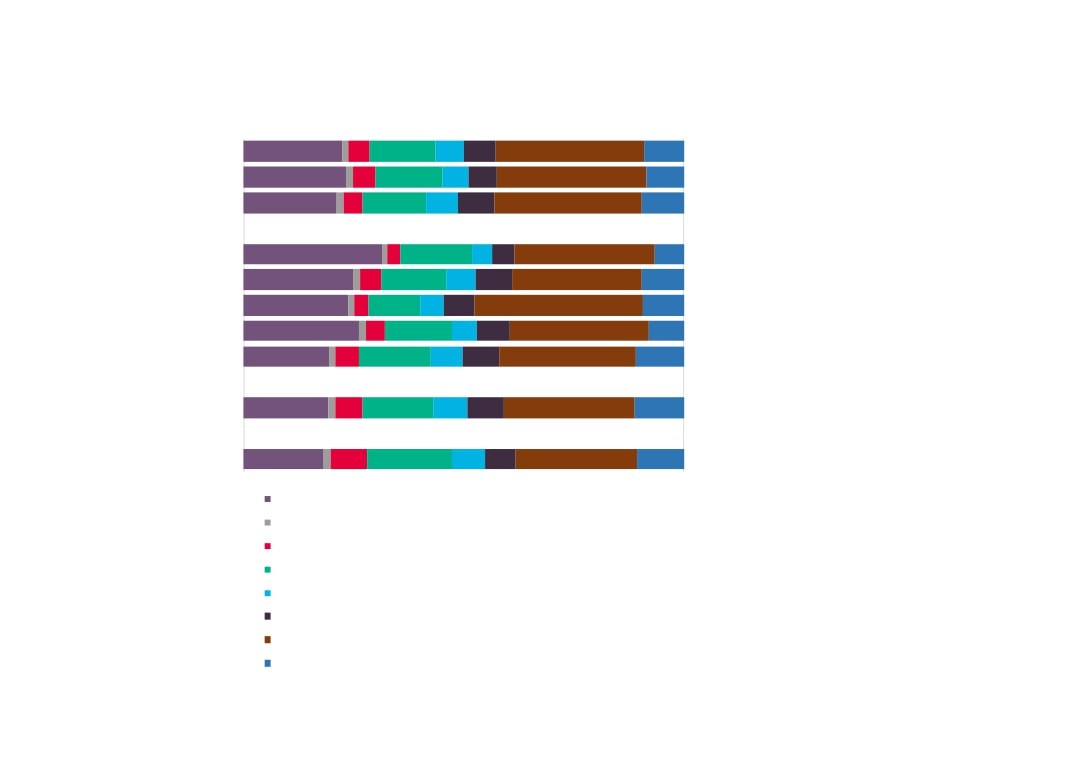
Workplace Visitor Economy
Cornwall and Isles of Scilly
31%
3%
16%
5%
5%
32%
7%
employment 2011 by broad
Dorset
25%
5%
15%
7%
8%
29%
9%
Standard Occupational
Greater Lincolnshire
24%
3%
12%
5%
7%
38%
9%
Classification (SOC) across
Heart of the South West
26%
4%
15%
6%
7%
32%
8%
comparator areas
South East
19%
5%
16%
7%
8%
31%
11%
Source: 2011 Census, Office for National Statistics
East
19%
6%
16%
8%
8%
30%
11%
England
18%
8%
19%
8%
7%
27%
11%
122 Managers and Proprietors in Hospitality and Leisure Services
245 Librarians and Related Professionals
247 Media Professionals
341 Artistic, Literary and Media Occupations
342 Design Occupations
344 Sports and Fitness Occupations
543 Food Preparation and Hospitality Trades
621 Leisure and Travel Services
21
0%
100%
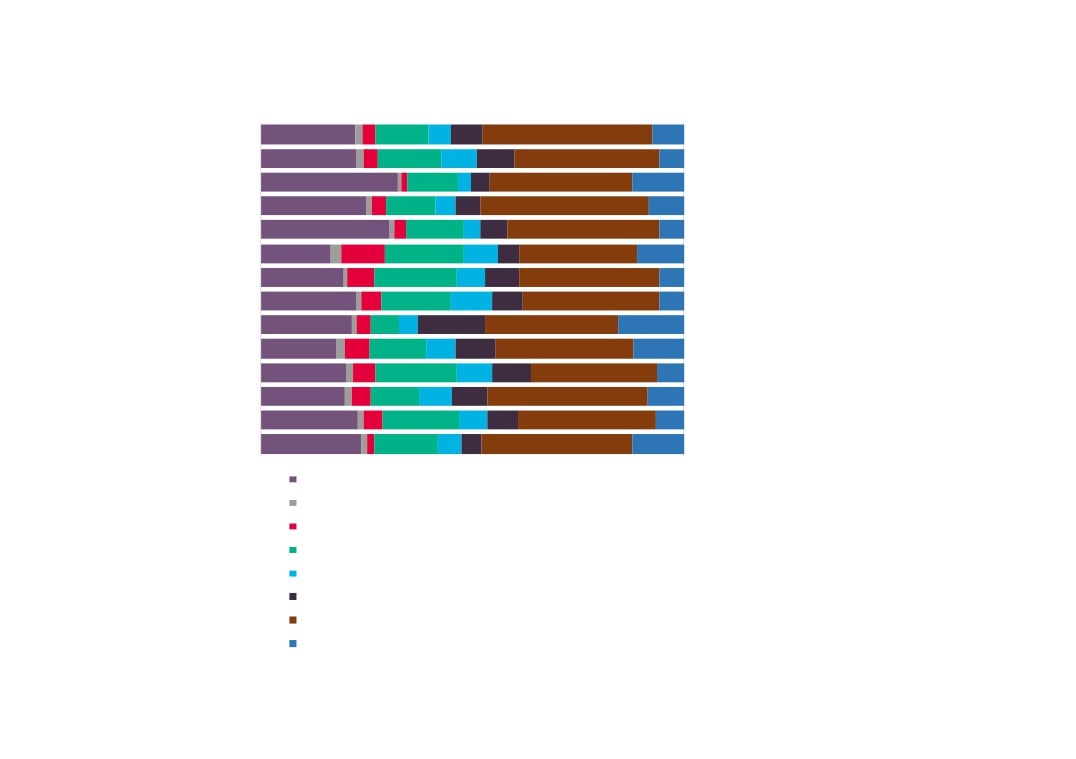
Breckland
22%
13%
5%
8%
40%
8%
Broadland
22%
15%
8%
9%
34%
6%
Great Yarmouth
32%
12%
3%5%
34%
12%
King`s Lynn and West Norfolk
25%
12%
5%
6%
40%
8%
Workplace Visitor Economy
North Norfolk
30%
14%
4%
6%
36%
6%
employment 2011 by broad
Norwich
16%
10%
19%
8%
5%
28%
11%
Standard Occupational
South Norfolk
19%
6%
19%
7%
8%
33%
6%
Classification (SOC) across
Babergh
23%
5%
16%
10%
7%
32%
6%
Forest Heath
21%
7%
4%
16%
31%
16%
New Anglia
Ipswich
18%
6%
13%
7%
9%
33%
12%
Source: 2011 Census, Office for National Statistics
Mid Suffolk
20%
5%
19%
8%
9%
30%
6%
St Edmundsbury
20%
4%
12%
8%
8%
38%
9%
Suffolk Coastal
23%
4%
18%
7%
7%
33%
7%
Waveney
24%
15%
6% 5%
35%
12%
122 Managers and Proprietors in Hospitality and Leisure Services
245 Librarians and Related Professionals
247 Media Professionals
341 Artistic, Literary and Media Occupations
342 Design Occupations
344 Sports and Fitness Occupations
543 Food Preparation and Hospitality Trades
621 Leisure and Travel Services
22
81,400
Enterprises
New Anglia
72,865
21,600
45,400
Norfolk
40,650
11,725
36,000
Suf folk
32,360
Visitor Economy (Tourism and
9,645
37,600
Culture) enterprises across
Cornwall and Isles of Scilly LEP
35,045
comparator areas, 2016
6,415
42,600
Source: UK Business Counts, Office for
National Statistics
Dorset LEP
40,010
8,130
GCGP LEP
Visitor Economy
21,900
42,400
Tourism
Greater Lincolnshire LEP
39,435
8,620
87,700
Cultural
Heart of the South West LEP
81,545
16,710
London LEP
266,325
186,700
South East LEP
162,640
49,190
288,700
East of England
246,360
82,480
23
81,400
Visitor Economya(Tourism and Culture)
21,600
enterprises as a proportion
of total enterprises
45,400
across comparator areas, 2016
11,725
New
36,000
Suf folk
32,360
9,645
37,600
Cornwall and Isles of Scilly LEP
35,045
6,415
42,600
Dorset LEP
40,010
Cornwall and Isles of Scil
8,130
Dors
GCGP LEP
Visitor Economy
21,900
GCG
42,400
Tourism
Greater Lincolnshire LEP
39,435
8,620
Great er Lincolnshi
87,700
Cultural
Heart of the South West LEP
81,545
Heart of the South We
16,710
Source: UK Business Counts,
London LEP
Office for National Statistics
Londo
266,325
186,700
South Ea
South East LEP
162,640
49,190
East of E
288,700
East of England
246,360
82,480
England
8.7%
4.8%
24
Suf folk
32,360
9,645
37,600
CornVisitor Econom
y (Tourism
and Culture)
6,415
enterprises across New Anglia, 2016
Dorset LEP
40,010
8,130
GCGP LEP
Visitor Economy
21,900
42,400
Tourism
Greater Lincolnshire LEP
39,435
8,620
87,700
Cultural
Heart of the South West LEP
81,545
G
16,710
Source: UK Business Counts,
Office for National Statistics
London LEP
266,325
King`s Lynn and
186,700
South East LEP
162,640
49,190
288,700
East of England
246,360
82,480
670
Norwich
520
240
470
South Norfolk
385
170
425
St Edmundsbury
350
160
640
Suffolk Coastal
510
250
410
Waveney
360
90
25
81,400
New Anglia
72,865
21,600
45,400
Visitor Economy (Tourism and
Culture) enterprises as a
Norfolk
40,650
proportion of total enterprises
across New Anglia, 2016
36,000
Suf folk
32,360
9,645
37,600
Cornwall and Isles of Scilly LEP
35,045
6,415
42,600
Dorset LEP
40,010
Fo
8,130
Grea
GCGP LEP
Visitor Economy
21,900
42,400
Tourism
Greater Lincolnshire LEP
39,435
8,620
King`s Lynn and W
87,700
Cultural
Heart of the South West LEP
81,545
16,710
No
London LEP
266,325
186,700
South East LEP
162,640
So
49,190
Source: UK Business Counts,
Office for National Statistics
288,700
St Ed
East of England
246,360
82,480
Suffolk Coastal
9.4%
4.6%
11.0%
Waveney
9.7%
2.4%
26
New Anglia
82%
16%
2%
Cornwall and Isles of Scilly LEP
76%
23%
1%
Dorset LEP
81%
17%
2%
Visitor Economy enterprise
Greater Lincolnshire LEP
82%
17%
1%
numbers by size across
Heart of the South West LEP
80%
19%
1%
comparator areas, 2016
South East LEP
85%
13%
1%
East
85%
14%
1%
Please note that at Local Authority level that
England
84%
14%
2%
businesses employing more than 250 people are
not reported due to their very small numbers and
No. of employees
resulting disclosive nature.
Micro (0 to 9)
Small (10 to 49)
Medium-sized (50 to 249)
Large (250+)
Source: UK Business Counts, Office for
Babergh
86%
13%
1%
National Statistics
Breckland
88%
Broadland
82%
Forest Heath
90%
1%
Great Yarmouth
82%
17%
1%
Ipswich
89%
Visitor Economy enterprise
King`s Lynn and West Norfolk
81%
1%
numbers by size across
Mid Suffolk
90%
North Norfolk
80%
20%
New Anglia, 2016
Norwich
83%
17%
South Norfolk
84%
St Edmundsbury
84%
1%
Suffolk Coastal
82%
Waveney
85%
15%
27
81,400
New Anglia
72,865
21,600
45,400
Change in Visitor Economy
Norfolk
40,650
(Tourism and Culture)
11,725
36,000
enterprises across comparator
Suf folk
32,360
9,645
areas, 2010 - 2016
37,600
Source: UK Business Counts,
Cornwall and I
Cornwall and Isles of Scilly LEP
35,045
Office for National Statistics
6,415
42,600
Dorset LEP
40,010
8,130
GCGP LEP
Visitor Economy
21,900
Greater
42,400
Tourism
Greater Lincolnshire LEP
39,435
8,620
Heart of the
87,700
Cultural
Heart of the South West LEP
81,545
16,710
London LEP
266,325
186,700
South East LEP
162,640
49,190
288,700
East of England
246,360
82,480
22%
28
81,400
New Anglia
72,865
21,600
45,400
Change in Visitor
Norfolk
40,650
Economy (Tourism and
11,725
36,000
Culture) enterprises
Suf folk
32,360
across New Anglia,
9,645
Fo
37,600
2010 - 2016
Cornwall and Isles of Scilly LEP
35,045
Grea
6,415
Sources: UK Business Counts,
Office for National Statistics
42,600
Dorset LEP
40,010
8,130
King`s Lynn and W
GCGP LEP
Visitor Economy
21,900
42,400
Tourism
Greater Lincolnshire LEP
39,435
8,620
No
87,700
Cultural
Heart of the South West LEP
81,545
16,710
London LEP
So
266,325
186,700
St Ed
South East LEP
162,640
49,190
Suff
288,700
East of England
246,360
82,480
13%
29
Visitor Economy Skills
Supply and Demand
30
Qualifications
Visitor Economy (Accommodation & food service activities; Other
services) Workplace Qualifications across Comparator Areas, 2011
New Anglia
14%
17%
22%
16%
18%
13%
Cornwall and Isles of Scilly LEP
11%
16%
24%
18%
22%
8%
Dorset LEP
11%
16%
22%
19%
21%
12%
Greater Lincolnshire LEP
15%
18%
24%
17%
16%
10%
Heart of the South West LEP
12%
16%
23%
18%
21%
10%
South East LEP
13%
18%
23%
17%
18%
11%
Source: 2011 Census, Office for National Statistics
East of England
13%
17%
22%
16%
20%
12%
England
12%
15%
20%
17%
24%
12%
No qualifications
Level 1 qualifications
Level 2 qualifications
Level 3 qualifications
Level 4 qualifications and above
Apprenticeships and other qualifications
31
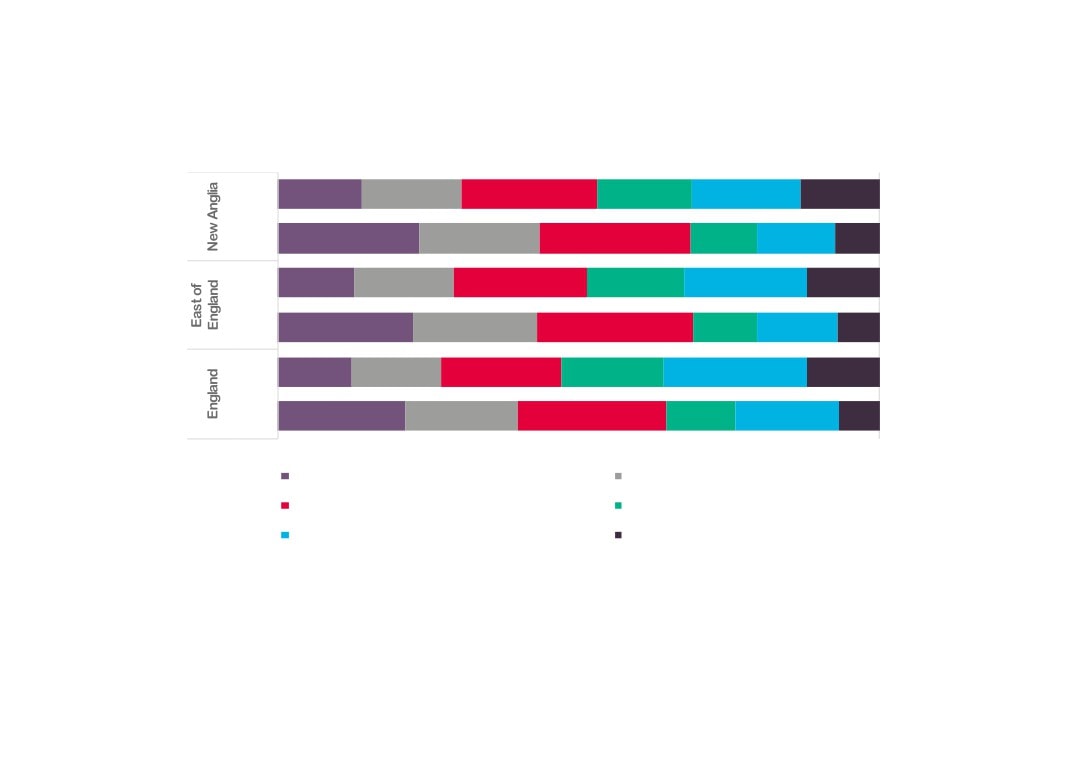
Change in Visitor Economy workplace qualifications, 2001 - 2011
2011
14%
17%
22%
16%
18%
13%
2001
24%
20%
25%
11%
13%
7%
2011
13%
17%
22%
16%
20%
12%
2001
22%
21%
26%
11%
13%
7%
2011
12%
15%
20%
17%
24%
12%
2001
21%
19%
24%
11%
17%
7%
0%
100%
No qualifications
Level 1 qualifications
Level 2 qualifications
Level 3 qualifications
Level 4 qualifications and above
Apprenticeships and other qualifications
Source: 2001 and 2011 Census, Office for National Statistics
32
UKCES ESS
2015
The following analysis uses the LEP level data released as part of the UK Commission for Employment and Skills (UKCES) Employer
Skills Survey (ESS) 2015. The data covers the areas of vacancies, skills gaps, training, and staff retention and underutilisation.
Data is published for a limited number of broad sectors at LEP level and we have chosen the sectors of ‘Hotels and Restaurants’ and ‘Arts and
Other Services’ as those closest to encapsulating Tourism, Culture and The Arts activity. In all instances, national, regional, and New Anglia
LEP averages are presented as comparators.
In total, 2,364 employers in New Anglia were surveyed, 199 of which were ‘Hotels and Restaurants’ employers, and 176 were classed as ‘Arts
and Other Services’.
33
Vacancies
17%
23%
Establishments with any vacancies
19%
19%
20%
6%
7%
Have at least one vacancy that is hard to fill
9%
7%
8%
4%
4%
Have a skills shortage vacancy (prompted or
3%
unprompted)
5%
Source: UKCES Employer
Skills Survey 2015
6%
3%
5%
Number of vacancies as a % of all employment
4%
3%
3%
19%
12%
% of all vacancies which are SSVs
13%
22%
23%
New Anglia (Average)
Hotels and restaurants (New Anglia)
Arts and Other Services (New Anglia) East of England (Average)
England (Average)
34
Skills Gaps
14%
23%
% of establishments with any staff not fully
11%
proficient
13%
14%
3%
7%
Number of staff not fully proficient as a % of
3%
employment
Source: UKCES Employer
5%
Skills Survey 2015
5%
New Anglia (Average)
Hotels and restaurants (New Anglia)
Arts and Other Services (New Anglia) East of England (Average)
England (Average)
35
Training
7.5
10.8
Training days per trainee
7.0
6.3
6.8
4.7
6.1
Training days per staff
4.9
4.0
4.3
New Anglia (Average)
Hotels and restaurants (New Anglia)
Arts and Other Services (New Anglia) East of England (Average)
England (Average)
Source: UKCES Employer Skills Survey 2015
36
65%
60%
% of establishments training staff over the
63%
last 12 months
64%
66%
48%
39%
% of establishments providing off-the-job
47%
training in the last 12 months
47%
48%
51%
51%
% of establishments providing on-the-job
52%
training in the last 12 months
51%
52%
42%
% of training establishments providing
49%
online training or e-learning in the last 12
43%
months
44%
45%
63%
57%
Number trained as % of total staff
70%
64%
63%
New Anglia (Average)
Hotels and restaurants (New Anglia)
Arts and Other Services (New Anglia)
East of England (Average)
England (Average)
Source: UKCES Employer Skills Survey 2015
37
Staff
25%
29%
Establishments with underutilised staff
31%
25%
30%
7%
11%
Whether any jobs in which have difficulties
9%
retaining staff
7%
8%
New Anglia (Average)
Hotels and restaurants (New Anglia)
Arts and Other Services (New Anglia)
East of England (Average)
England (Average)
Source: UKCES Employer Skills Survey 2015
38
FE Learning
Aims
All data (unless stated otherwise) is sourced from the Department for Education’s Further Education data library
In order to present information that is relevant to New Anglia LEPs high performing and underpinning sectors then we have
identified FE and skills provision data split by Sector Lead Body and aligned a best-fit with each sector.
The Sector Lead Bodies identified as being the most relevant to the Visitor Economy are: Hospitality, Leisure, Travel and Tourism; Creative and
Cultural; Creative Media; and Passenger Transport.
However, not all FE and Skills learning aims align with a sector lead body. In fact, on average around two thirds are classed as unknown. This
means that we are basing results here on roughly a third of the data.
Please note that all data is rounded to the nearest 10 and that therefore some figures presented may not add to the sum totals presented.
39
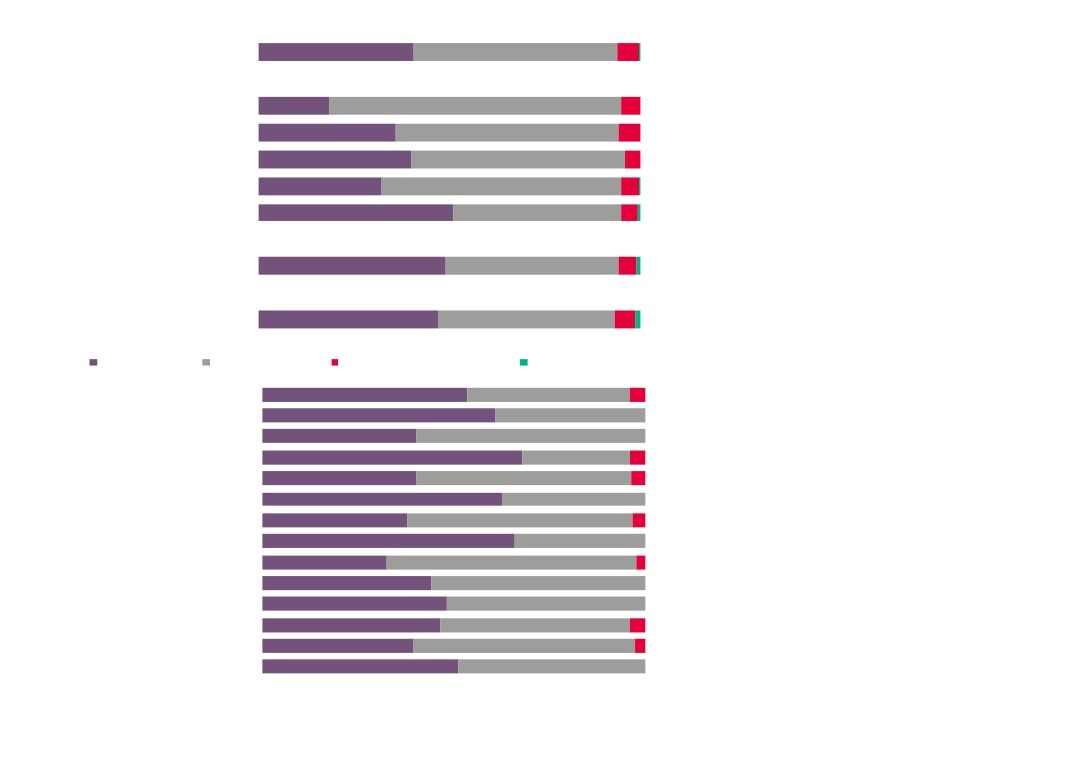
Visitor Economy learning aims delivered to New Anglia
learners by Sector Lead Body, 2012/13
0%
10%
20%
30%
40%
50%
60%
70%
80%
90%
100%
New Anglia
4,900
4,020
1,080
410
National
182,300
142,800
48,800
42,700
Hospitality, Leisure, Travel & Tourism Creative & Cultural Creative Media Passenger Transport
Source: FE Data Library, Department for Education
40
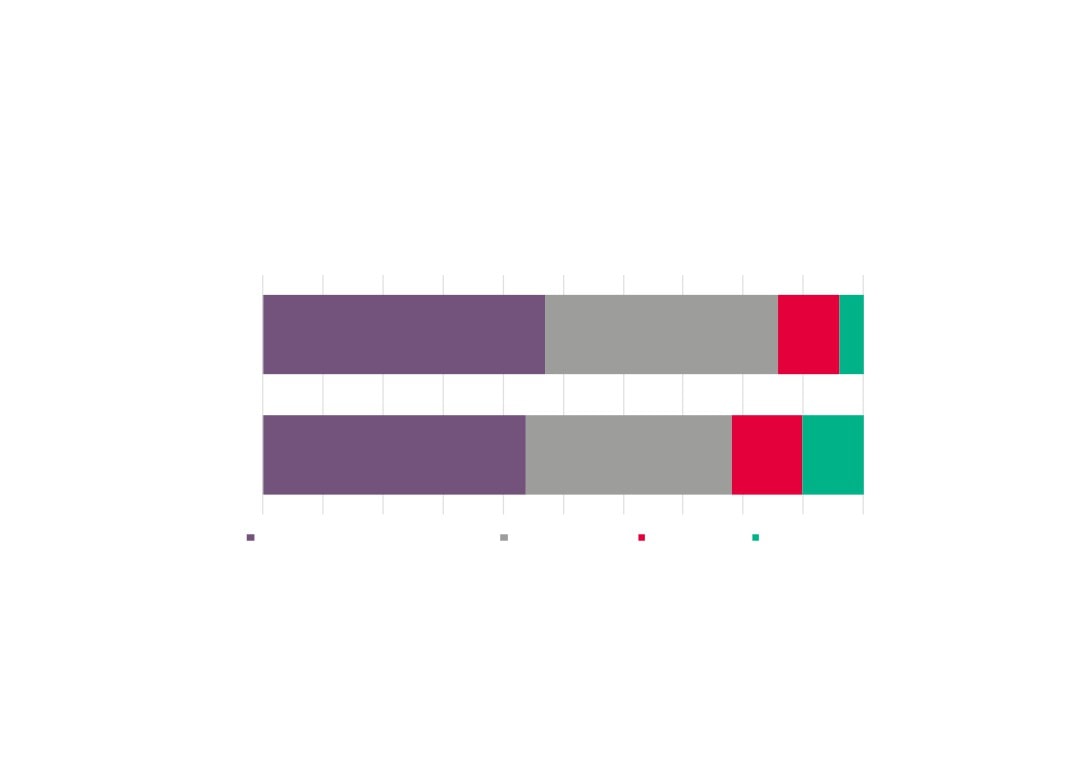
Visitor Economy learning aims delivered to New Anglia
learners by Sector Lead Body, 2010/11 and 2012/13
5,140
4,900
4,290
4,020
2010/11
2012/13
1,080
920
480
410
Hospitality, Leisure, Travel
Creative & Cultural
Creative Media
Passenger Transport
& Tourism
Source: FE Data Library, Department for Education
41
Change in Visitor Economy learning aims delivered to
resident learners by Sector Lead Body, 2010/11 - 2012/13
11%
Total inc. Unknown
9%
4%
Total not inc. Unknown
7%
-4%
Tourism, Culture and The Arts
7%
-5%
Hospitality, Leisure, Travel & Tourism
15%
-6%
Creative & Cultural
5%
17%
Creative Media
23%
-15%
Passenger Transport
-21%
New Anglia National
Source: FE Data Library, Department for Education
42
Visitor Economy learning aims delivered to New Anglia
residents by New Anglia based and external providers by
Sector Lead Body, 2012/13
0%
10%
20%
30%
40%
50%
60%
70%
80%
90%
100%
Tourism, Culture and The Arts
8,260
2,150
Hospitality, Leisure, Travel & Tourism
3,570
1,330
Creative & Cultural
3,600
420
Creative Media
1,000
80
Passenger Transport
90
320
Total inc. unknown
158,480
52,170
Total with unknown removed
55,340
24,770
New Anglia Provider
External Provider
Source: FE Data Library, Department for Education
43
Visitor Economy learning aims delivered to New Anglia learners
by providers by Sector Lead Body, 2010/11 and 2012/13
3,570
3,600
2010/11
2012/13
2,440
2,110
1,100
1,000
870
90
Hospitality, Leisure, Travel
Creative & Cultural
Creative Media
Passenger Transport
& Tourism
Source: FE Data Library, Department for Education
44
Change in Visitor Economy learning aims delivered to resident learners
by domiciled providers by Sector Lead Body, 2010/11 - 2012/13
5%
Total inc. Unknown
9%
-38%
Total not inc. Unknown
7%
27%
Tourism, Culture and The Arts
7%
46%
Hospitality, Leisure, Travel & Tourism
15%
71%
Creative & Cultural
5%
15%
Creative Media
23%
-92%
Passenger Transport
-21%
New Anglia
National
Source: FE Data Library, Department for Education
45
Apprenticeships
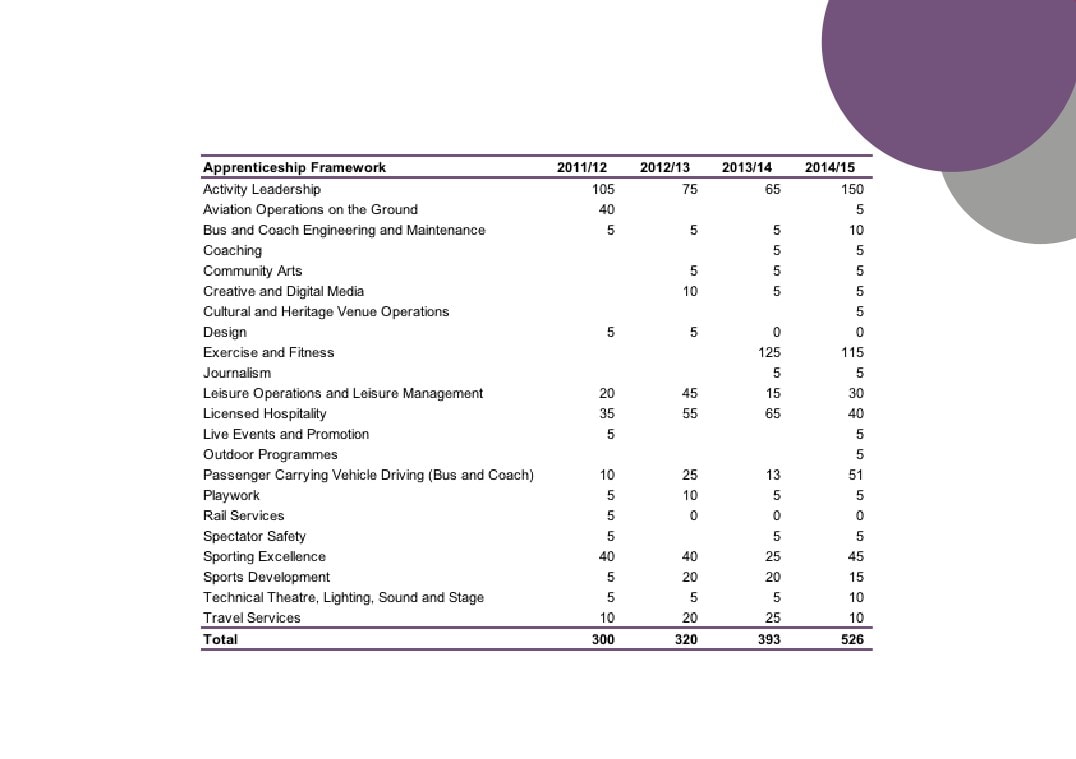
Visitor Economy apprenticeship starts by year
Source: Skills Funding Agency Data Cube
46
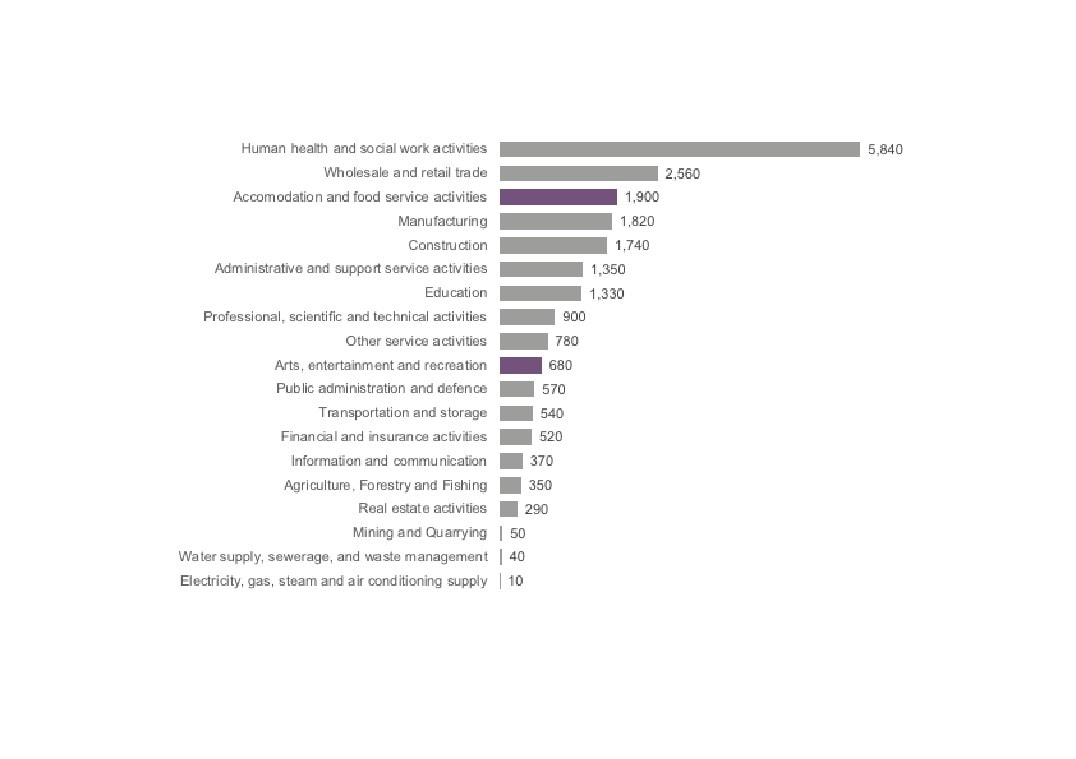
Apprenticeship participation by sector, 2014/15
Source: FE Data Library, Department for Education
47
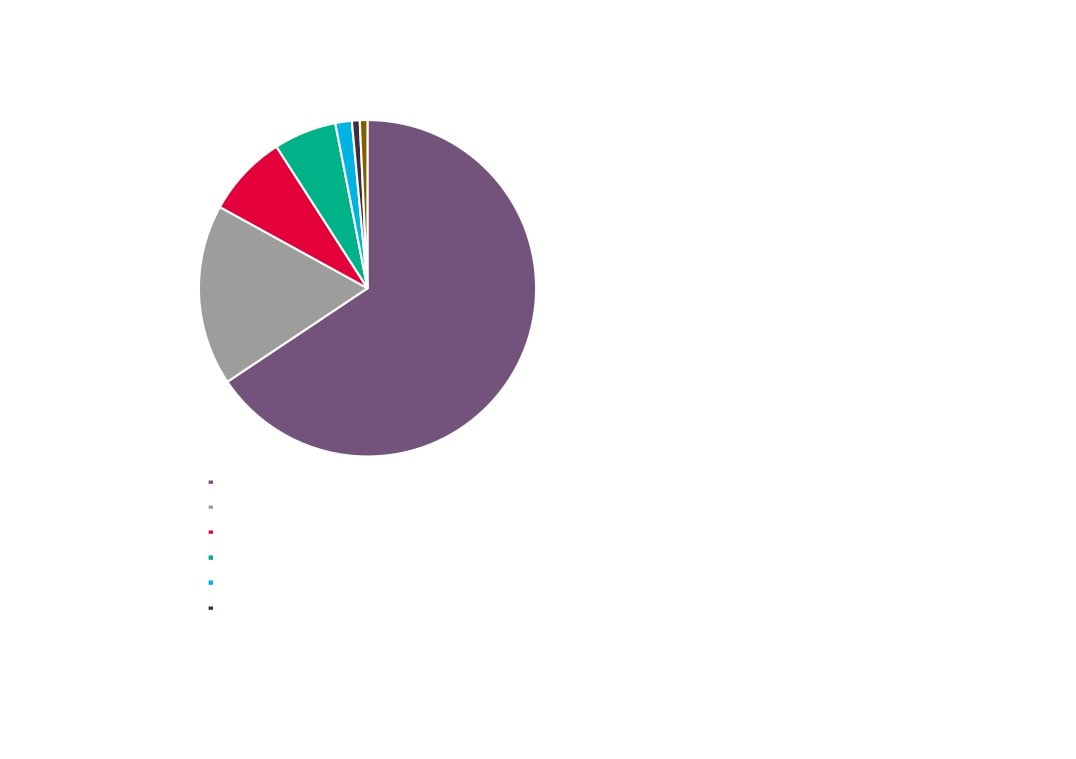
Apprenticeship Participation in the Visitor Economy
2014/15 as a proportion of total participation
11.9%
Visitor Economy
10.0%
3.1%
Arts, entertainment and recreation
2.6%
8.8%
Accomodation and food service activities
7.4%
New Anglia England
Source: FE Data Library, Department for Education
48
Labour Insight
Jobs
The following section presents data from Labour Insight, a Burning Glass analytical tool. This tool collects details of online
job postings from multiple sources and enables the analysis of these postings based on specific skills, educational
requirements, and job titles, for example.
Please note that whilst Labour Insight will capture more information on the jobs market than more traditional Department
for Work and Pensions vacancy data, the fact that not all job vacancies are advertised means that there will still be gaps in
the findings.
In terms of the Visitor Economy then according to the Labour Insight Jobs tool, then there were 36,823 postings for the
sector in New Anglia between Jan. 1, 2012 and Dec. 31, 2016.
The definition for the Visitor Economy in this exercise captures the following industry and sectors: ‘Accommodation and
Food Service Activities’, ‘Travel agency, tour operator and other reservation service and related activities’, ‘Gambling and
betting activities’, and ‘Sports activities and amusement and recreation activities’.
49
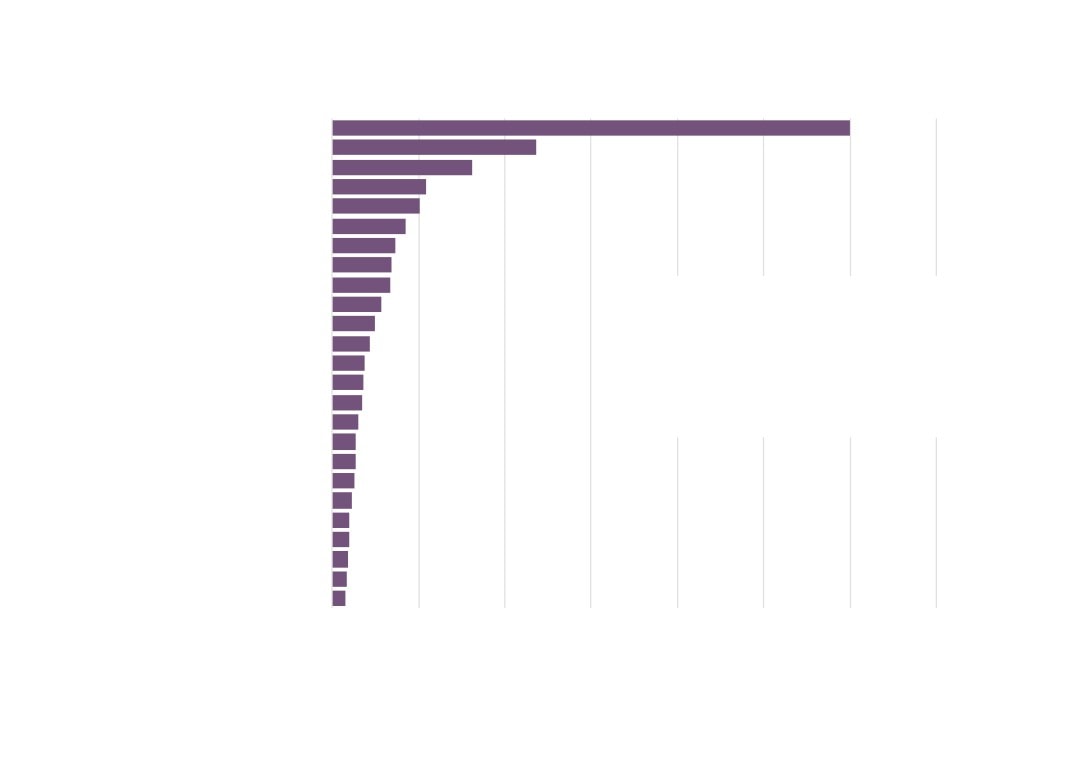
Vacancies
Visitor Economy vacancies across
New Anglia, Jan 2012 - Dec 2016
0
1,000
2,000
3,000
4,000
5,000
6,000
7,000
8,000
9,000
Norwich
Ipswich
St Edmundsbury
King's Lynn and West Norfolk
Waveney
Suffolk Coastal
Forest Heath
North Norfolk
Breckland
Great Yarmouth
Broadland
Babergh
South Norfolk
5,349 unspecified or unclassified postings
Mid Suffolk
Source: Labour Insight Jobs, Burning Glass
Technologies
50
Nuffield Health
Top Visitor Economy
Holiday Inn
Whitbread
Employers across New
Travelodge
Anglia, Jan 2012 - Dec 2016
Ladbrokes
20,864 unspecified or unclassified postings
Hilton Worldwide
Source: Labour Insight Jobs, Burning Glass
Premier Inn
Technologies
Catering, Cleaning, Caretaking and Grounds
Puma Hotels Collection
William Hill
Pizza Hut
David Lloyd
Haven
J D Wetherspoon
Fitness First
Martson's
Mitchells & Butlers
Sodexo
Intercontinental Hotels Group
Marriott International
Huntercombe
Compass Group
Greene King
Center Parcs
McDonald's Restaurants
0
100
200
300
400
500
600
700
800
900
51
0
2,000
4,000
6,000
8,000
10,000
12,000
Chefs (5434)
Kitchen and catering assistants (9272)
Cooks (5435)
Waiters and waitresses (9273)
Bar staff (9274)
Restaurant and catering establishment managers and proprietors (1223)
Receptionists (4216)
Catering and bar managers (5436)
Managers and proprietors in other services n.e.c. (1259)
Other administrative occupations n.e.c. (4159)
Visitor Economy
Other elementary services occupations n.e.c. (9279)
vacancies by occupation,
Housekeeprs and related occupations (6231)
Managers and directors in retail and wholesale (1190)
Jan 2012 - Dec 2016
Sales and retail assistants (7111)
140 unspecified or unclassified postings
Customer service occupations n.e.c. (7219)
Source: Labour Insight Jobs, Burning
Glass Technologies
Sales supervisors (7130)
Conference and exhibition managers and organisers (3546)
Cleaners and domestics (9233)
Fitness instructors (3443)
Hotel and accomodation managers and proprietors (1221)
Business sales executives (3542)
Caretakers (6232)
Sales related occupations n.e.c. (7129)
Travel agents (6212)
Van drivers (8212)
52
0
1,000
2,000
3,000
4,000
5,000
6,000
7,000
Chef
Sous Chef
Head Chef
Waiting Staff
Assistant Manager
Catering Assistant
Receptionist
Cook
Restaurant Manager
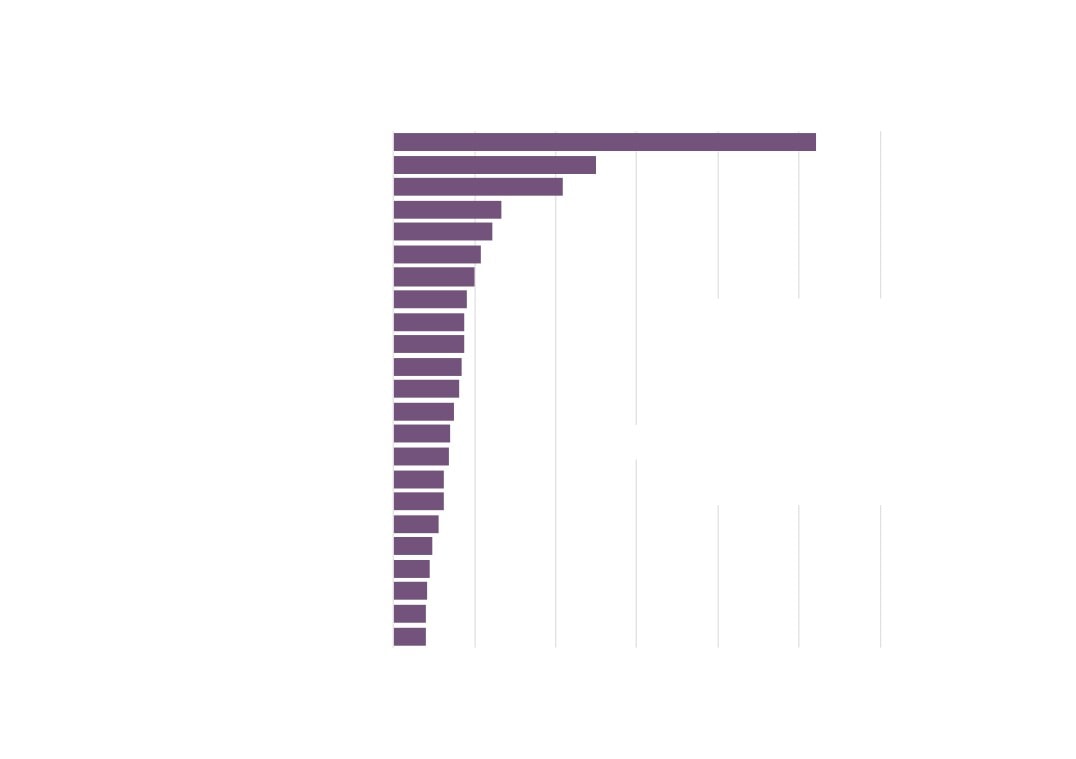
Visitor Economy
Bar Staff
Kitchen Assistant
vacancies by job title,
Housekeeper
Jan 2012 - Dec 2016
Kitchen Porter
Cleaner
1 unspecified or unclassified postings
Kitchen Manager
Source: Labour Insight Jobs, Burning Glass
Technologies
Sales Executive
General Manager
Restaurant Supervisor
Assistant Restaurant Manager
Chef Manager
Bar Manager
Personal Care Assistant
Personal Trainer
Hotel Manager
Bartender
53
32
31
67
255
335
Economy vacancies by
ification level required,
738
Jan 2012 - Dec 2016
32,583 unspecified or unclassified postings
2782
Source: Labour Insight Jobs, Burning Glass Technologies
GCSEs, Standard Grades, and Level 2 S/NVQs
A-Levels, Highers, and Level 3 S/NVQs
Level 1 S/NVQs
Bachelor's degrees, graduate certificates and diplomas
Level 4 diplomas and certificates, HNCs, Level S/NVQs
Foundation degrees and HNDs
54
0
1,000
2,000
3,000
4,000
5,000
6,000
Cooking
Customer Service
Cleaning
Product Sales
Food Safety
Product Sale and Delivery
Food Service Industry Background
Stock Control
Hospitality Industry Experience
Visitor Economy
Supervisory Skills
vacancies by skills
Budgeting
required, Jan 2012
Business Management
Cash Handling
- Dec 2016
Restaurant Industry Experience
22,740 unspecified or unclassified postings
Sales
Source: Labour Insight Jobs, Burning
Glass Technologies
Customer Contact
Restaurant Management
Marketing Sales
Product Promotion
Budget Management
Dining Experience
Contract Management
Housekeeping
55
Where the
Work is
The following analysis makes use of data and findings available via the online toolkit http://wheretheworkis.org/ . The findings presented
are a result of combining data from the UKCES ‘Working Futures’ programme and job vacancy data from the Labour Market Insight tool
developed by Burning Glass.
Limitations
Though the ‘Where the work is’ tool provides a comprehensive and detailed free-to-use dashboard of supply and demand in the UK, the
following limitations should be taken into account when interpreting the data:
- Senior Management and Elementary roles
Occupations not open to recent HR graduates or FE finishers are not considered. Similarly, occupations that do not require any formal
qualifications or training are also excluded from this tool, since the number of job-seekers cannot be meaningfully quantified.
- Matching supply and demand
Some occupations do not have specific qualifications or subject-specific requirements (such as sales, marketing and related associate
professionals). As a result of this, and despite the fact that many people with a broad range of qualifications can apply for these occupations,
they frequently appear ‘undersupplied’ in the tool, i.e. when the “job opportunity” is low. Occupations with very small sample sizes (either of
finishers or job postings) are excluded from the dataset.
- Internal and international migration
Some occupations do not rely solely on FE finishers or HE graduates from their immediate location. Many people travel to find work, often
moving across the country. Other occupations, such as those on the Migration Advisory Committee’s shortage occupation list, may rely more
heavily on jobseekers arriving from outside the UK.
- Online and offline postings
Burning Glass Technologies (BGT) acknowledge that not all jobs are posted online, although a comparison of the Annual Survey of Hours and
Earnings (ASHE) employment data and BGT postings data for UK in 2014 showed a 94 per cent correlation between ASHE and BGT
occupational distributions. The BGT posting data slightly overestimate the proportion of professional and associate professional occupations,
while slightly underestimating the proportion of elementary occupations.
56
Location
Quotient
Location Quotient - Measure of Job Posting Density
relative to employment indexed to the national density
relative to employment
Sports Occs
0.80
Librarians
1.15
Leisure
0.99
Hospitality Trades
1.09
57
Vacancies by
Opportunity
Number of Job Postings asking for entry-level (2 years of
experience or fewer) and school leaver education levels,
further education levels, and higher education levels
Sports Occs
174
365
Librarians
Leisure
313
296
Hospitality Trades
1,377
1,900
School leaver
FE
HE
58
Average
Wages
Advertised Salaries for Job Postings in 2015
£25,100
Sports Occs
£33,600
£40,900
£20,800
Librarians
£25,700
£36,400
£18,800
Leisure
£25,200
£28,500
£23,800
Hospitality Trades
£23,900
£28,500
New Anglia
East of England
England
59
Opportunity
Scores
Opportunity Score - Score based on the Demand
Supply Ratio of FE / HE postings within a
geography, from Very Low (0) to Very High (100)
Further Education
Higher Education
50
68
Sports Occs
55
Sports Occs
65
52
57
Librarians
Librarians
58
Leisure
Leisure
78
58
51
Hospitality Trades
Hospitality Trades
New Anglia
East of England
England
New Anglia
East of England
Englan
60
A Future View of the
Visitor Economy
61
The following analysis uses data from the East of England Forecasting Model (EEFM) and the UKCES Working Futures data
(WF). In each case the Visitor Economy sector has been approximated from the sector splits available in each model. In the case
of the East of England Forecasting Model then ‘Accommodation & food services’, ‘Publishing & broadcasting’, and ‘Arts &
entertainment’ have been combined and used to provide forecasts for the Visitor Economy. For the Working Futures data, the
sectors of ‘Accommodation & food services’, ‘Media’, and ‘Arts & entertainment’ have been used.
Please note that neither model, or the forecasts they produce, take into account the New Anglia LEPs ambitions for growth in
Gross Value Added (GVA) and employment.
62
Forecasts for change in Visitor Economy employment in
New Anglia (2014 = 100)
130
120
110
100
90
80
70
2014
2015
2016
2017
2018
2019
2020
2021
2022
2023
2024
Accommodation & food services (EEFM)
Publishing & broadcasting (EEFM)
Arts & entertainment (EEFM)
Visitor Economy (EEFM)
Accommodation & food services (WF)
Media (WF)
Arts & entertainment (WF)
Visitor Economy (WF)
Sources: East of England Forecasting Model, Cambridge
Econometrics; UKCES Working Futures 2014 - 2024
63
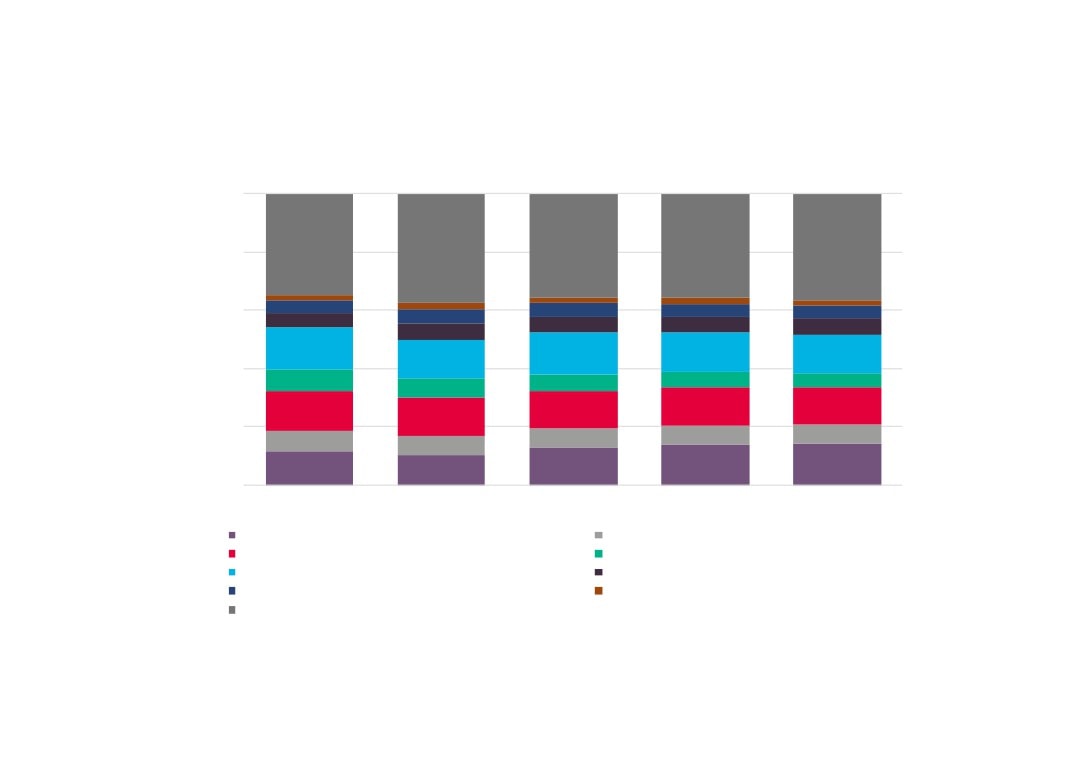
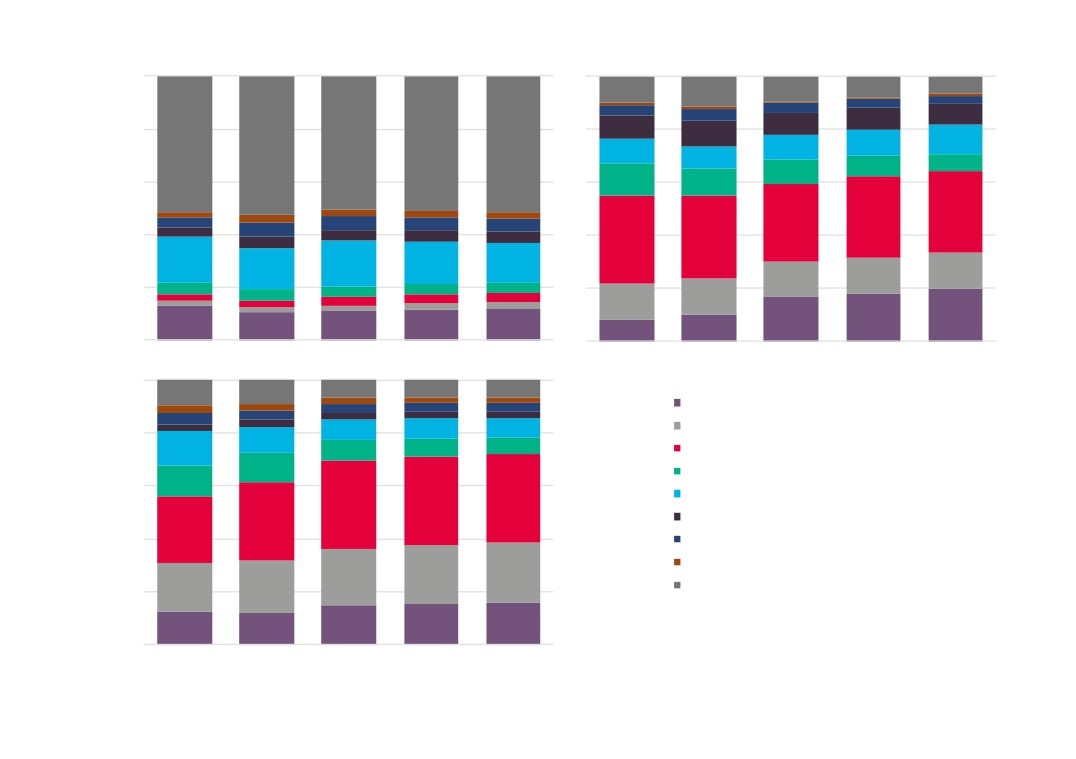
Occupational composition of employment in New Anglia’s
Visitor Economy over time
100%
35%
36%
36%
37%
37%
80%
4%
5%
4%
60%
4%
5%
15%
15%
14%
13%
13%
40%
7%
6%
5%
5%
6%
13%
13%
13%
13%
13%
20%
7%
7%
7%
7%
7%
13%
14%
14%
12%
10%
0%
2004
2009
2014
2019
2024
Managers, directors and senior officials
Professional occupations
Associate professional and technical
Administrative and secretarial
Skilled trades occupations
Caring, leisure and other service
Sales and customer service
Process, plant and machine operatives
Elementary occupations
Source: UKCES Working Futures 2014 - 2024
64
Accommodation & Food
Arts & Entertaint
ment
100%
100%
8%
7%
10%
12%
9%
3%
3%
4%
4%
4%
8%
8%
8%
80%
80%
9%
9%
51%
52%
50%
51%
51%
10%
11%
9%
9%
8%
6%
100%
60%
2%
%
4%
35%
36%
36%
37%
37%
3%
80%
40%
17%
%
20%
4%
60%
4%
5%
4%
4%
5%
%
13%
15%
15%
14%
13%
13%
0%
40%
7%
6%
5%
5%
4
6%
100%
13%
13%
13%
13%
9%
13%
20%
Managers, directors and senior officials
7%
7%
7%
4%
7%
7%
Professional occupations
80%
13%
14%
14%
13%
12%
10%
Associate professional and technical
0%
Administrative and secretarial
12%
2004
2009
2014
2019
2024
60%
Skilled trades occupations
Caring, leisure and other service
25%
40%
Sales and customer service
Process, plant and machine operatives
19%
Elementary occupations
20%
Source: UKCES Working Futures 2014 - 2024
15%
16%
16%
12%
12%
0%
2004
2009
2014
2019
2024
Media
65
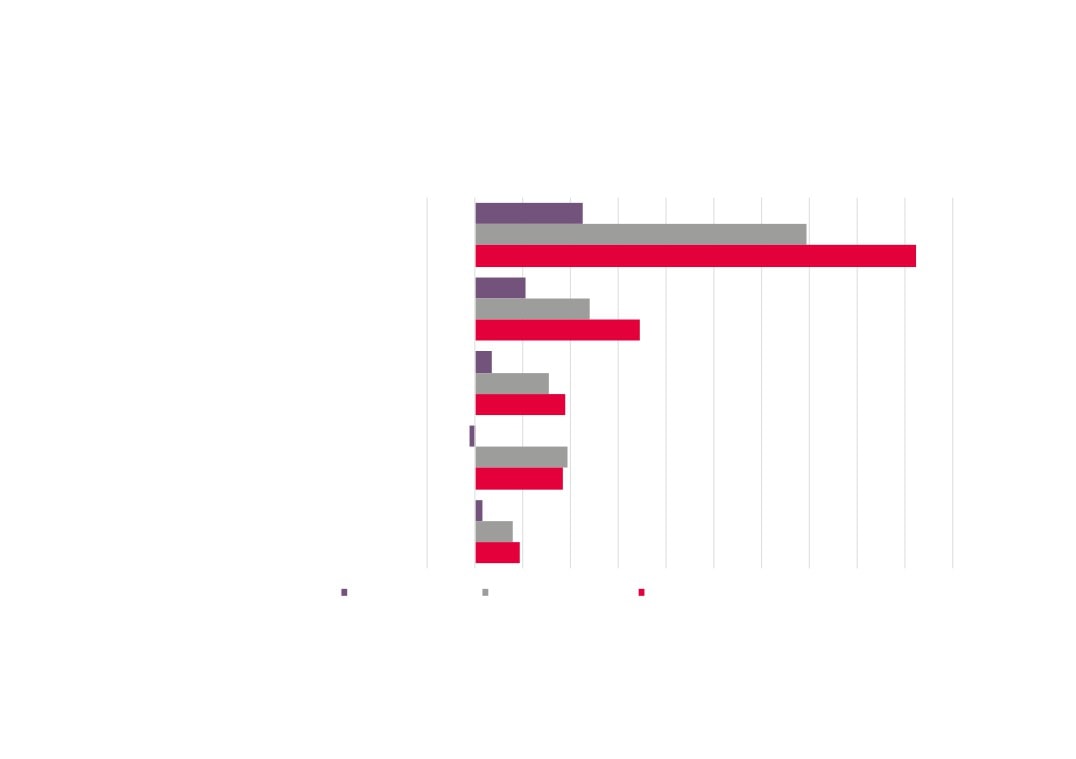
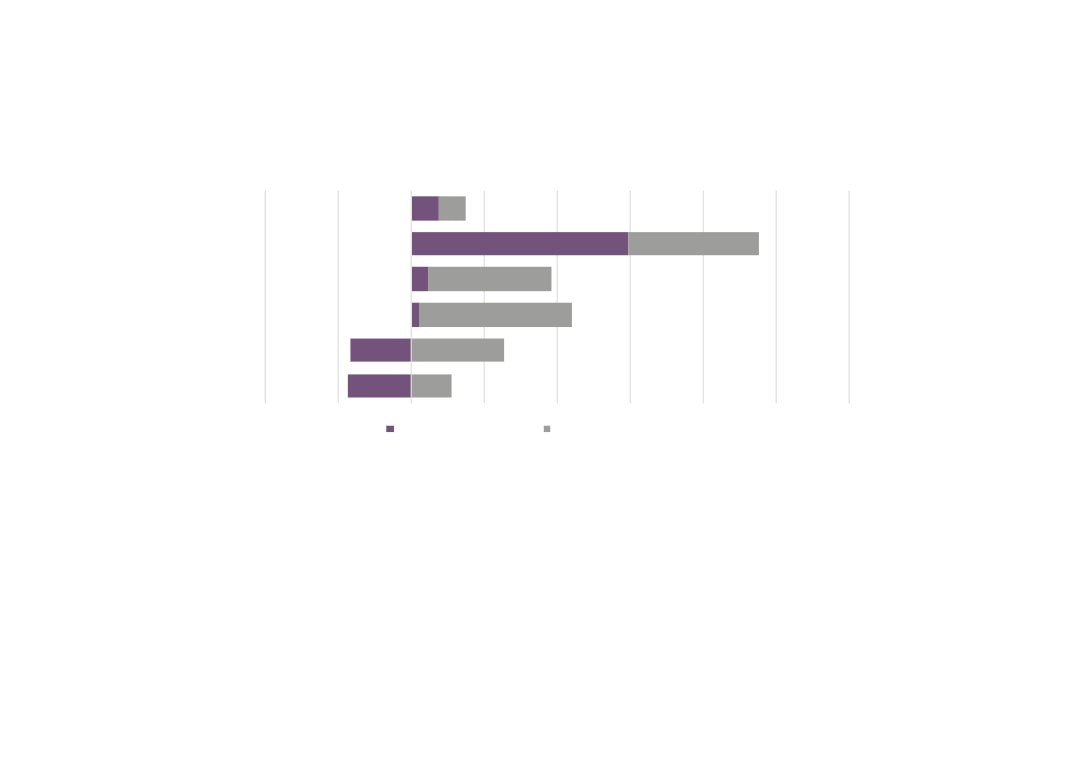
Visitor Economy replacement and expansion demand by occupation
(top 5 in terms of net requirement), 2014 - 2024
-2,000
0
2,000
4,000
6,000
8,000
10,000 12,000 14,000 16,000 18,000 20,000
Elementary administrat ion and service occupations
Other managers and proprietors
Culture, media and sports occupations
Textiles, printing and other skilled trades
Leisure, travel and related personal service occupations
Expansion demand
Replacement demand
Net requirement
Source: UKCES Working Futures 2014 - 2024
66
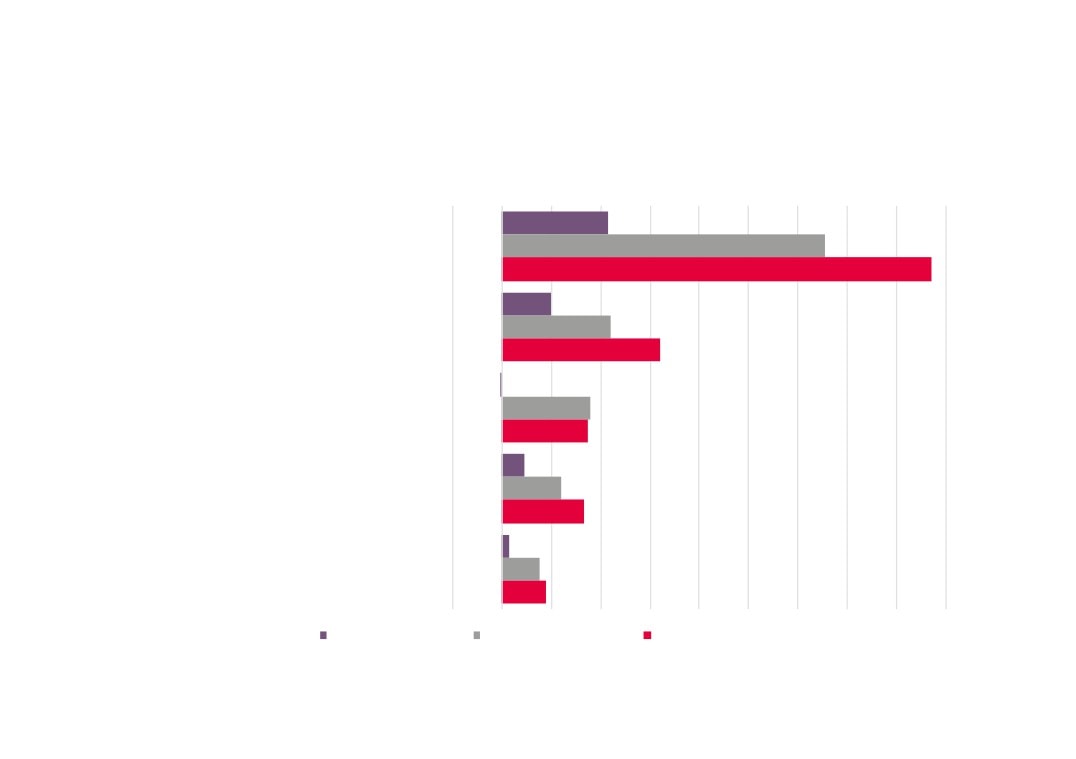
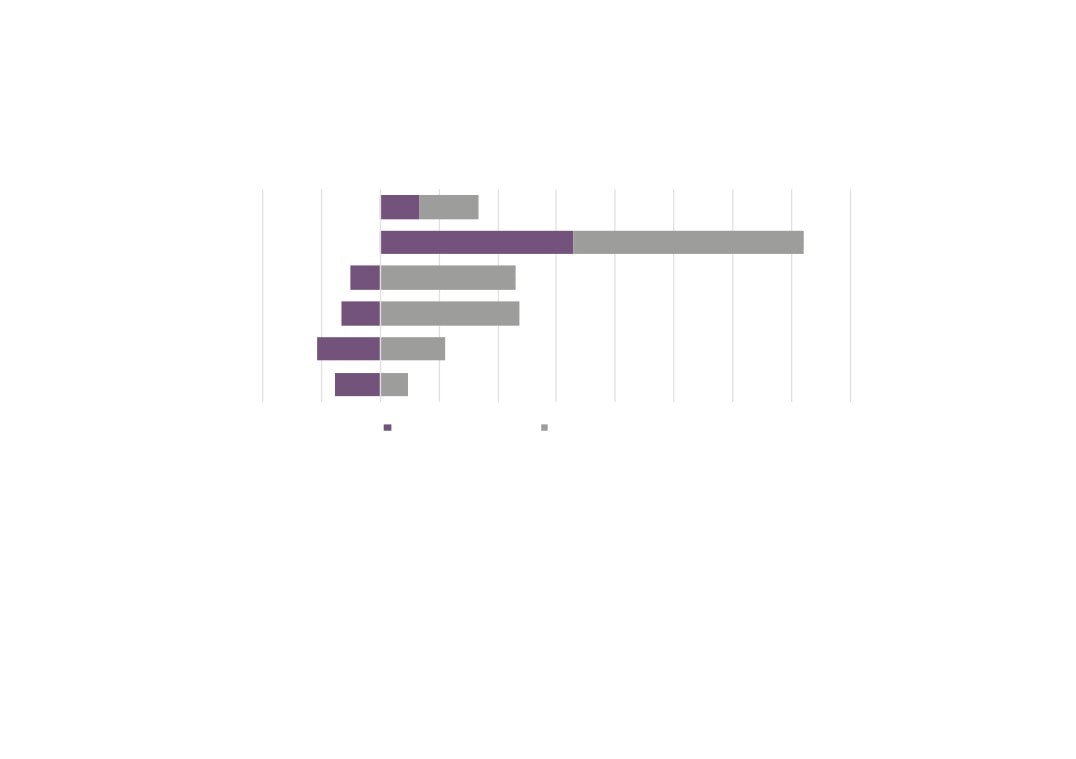
Tourism sector replacement and expansion demand by occupation (top
5 in terms of net requirement), 2014 - 2024
-2,000
0
2,000
4,000
6,000
8,000
10,000 12,000 14,000 16,000 18,000
Elementary administrat ion and service occupations
Other managers and proprietors
Culture, media and sports occupations
Textiles, printing and other skilled trades
Leisure, travel and related personal service occupations
Expansion demand
Replacement demand
Net requirement
Source: UKCES Working Futures 2014 - 2024
67
Culture sector replacement and expansion demand by occupation (top
5 in terms of net requirement), 2014 - 2024
0
1,000
2,000
3,000
4,000
Culture, media and sports occupations
Other managers and proprietors
Skilled agricultural and related trades
Business, media and public service professionals
Corporate managers and directors
Expansion demand
Replacement demand
Net requirement
Source: UKCES Working Futures 2014 - 2024
68
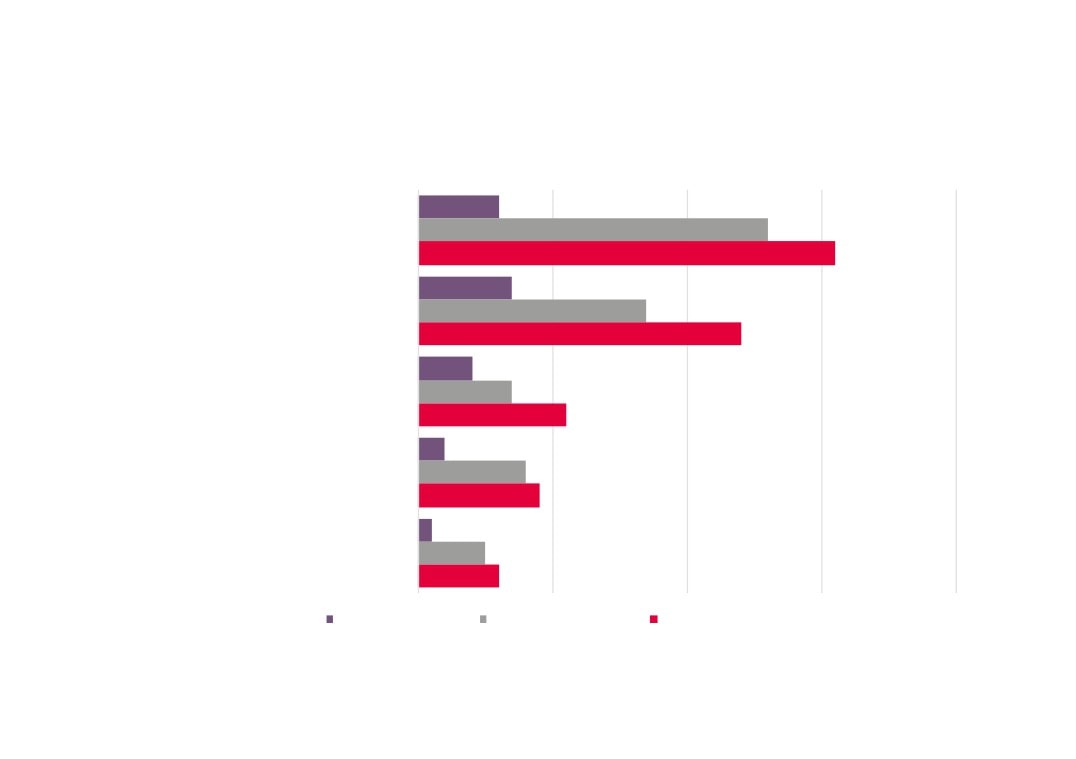
Visitor Economy replacement and expansion demand as a
proportion of employment by occupation, 2014 - 2024
-10%
0%
10%
20%
30%
40%
50%
60%
70%
80%
All occupations
Elementary administration and service occupations
Other managers and proprietors
Culture, media and sports occupations
Textiles, printing and other skilled trades
Leisure, travel and related personal service occupations
Expansion demand
Replacement demand
Net requirement
Source: UKCES Working Futures 2014 - 2024
69
Tourism sector replacement and expansion demand as a proportion
of employment by occupation, 2014 - 2024
-10%
0%
10%
20%
30%
40%
50%
60%
70%
80%
All occupations
Elementary administrat ion and service occupations
Other managers and proprietors
Culture, media and sports occupations
Textiles, printing and other skilled trades
Leisure, travel and related personal service occupations
Expansion demand
Replacement demand
Net requirement
Source: UKCES Working Futures 2014 - 2024
70
Culture sector replacement and expansion demand as a proportion
of employment by occupation, 2014 - 2024
0%
10%
20%
30%
40%
50%
60%
70%
80%
90%
100%
All occupations
Culture, media and sports occupations
Other managers and proprietors
Skilled agricultural and related trades
Business, media and public service professionals
Corporate managers and directors
Expansion demand
Replacement demand
Net requirement
Source: UKCES Working Futures 2014 - 2024
71
Visitor Economy replacement and expansion demand by
qualification, 2014 - 2024
-10,000
-5,000
0
5,000
10,000
15,000
20,000
25,000
30,000
QCF 7-8
QCF 4-6
QCF 3
QCF 2
QCF 1
No Qual
Expansion Demand
Replacement Demand
Please note that the Working Futures data uses the
following breakout of qualification levels:
QCF8 - Doctorate
QCF7 - Other higher degree
QCF6 - First degree
QCF5 - Foundation degree; Nursing; Teaching
QCF4 - HE below degree level
QCF3 - A level & equivalent
QCF2 - GCSE (A-C) & equivalent
QCF1 - GCSE (below grade C) & equivalent
No Q - No Qualification
Source: UKCES Working Futures 2014 - 2024
72
Tourism sector replacement and expansion demand by
qualification, 2014 - 2024
-10,000
-5,000
0
5,000
10,000
15,000
20,000
25,000
QCF 7-8
QCF 4-6
QCF 3
QCF 2
QCF 1
No Qual
Expansion Demand
Replacement Demand
Please note that the Working Futures data uses the
following breakout of qualification levels:
QCF8 - Doctorate
QCF7 - Other higher degree
QCF6 - First degree
QCF5 - Foundation degree; Nursing; Teaching
QCF4 - HE below degree level
QCF3 - A level & equivalent
QCF2 - GCSE (A-C) & equivalent
QCF1 - GCSE (below grade C) & equivalent
No Q - No Qualification
Source: UKCES Working Futures 2014 - 2024
73
Culture sector replacement and expansion demand by
qualification, 2014 - 2024
-2,000
-1,000
0
1,000
2,000
3,000
4,000
5,000
6,000
7,000
8,000
QCF 7-8
QCF 4-6
QCF 3
QCF 2
QCF 1
No Qual
Expansion Demand
Replacement Demand
Please note that the Working Futures data uses the
following breakout of qualification levels:
QCF8 - Doctorate
QCF7 - Other higher degree
QCF6 - First degree
QCF5 - Foundation degree; Nursing; Teaching
QCF4 - HE below degree level
QCF3 - A level & equivalent
QCF2 - GCSE (A-C) & equivalent
QCF1 - GCSE (below grade C) & equivalent
No Q - No Qualification
Source: UKCES Working Futures 2014 - 2024
74
Visitor Economy qualifications, 2014 - 2024
2024
6%
36%
21%
25%
10%
Source: UKCES Working Futures 2014 - 2024
2014
5%
23%
22%
27%
16%
0%
100%
QCF 7-8
QCF 4-6
QCF 3
QCF 2
QCF 1
No Qual
Please note that the Working Futures data uses the
following breakout of qualification levels:
QCF8 - Doctorate
QCF7 - Other higher degree
QCF6 - First degree
QCF5 - Foundation degree; Nursing; Teaching
QCF4 - HE below degree level
QCF3 - A level & equivalent
QCF2 - GCSE (A-C) & equivalent
QCF1 - GCSE (below grade C) & equivalent
No Q - No Qualification
75
Tourism sector qualifications, 2014 - 2024
2024
6%
35%
21%
25%
11%
Source: UKCES Working Futures 2014 - 2024
2014
4%
22%
22%
28%
17%
0%
100%
QCF 7-8
QCF 4-6
QCF 3
QCF 2
QCF 1
No Qual
Please note that the Working Futures data uses the
following breakout of qualification levels:
QCF8 - Doctorate
QCF7 - Other higher degree
QCF6 - First degree
QCF5 - Foundation degree; Nursing; Teaching
QCF4 - HE below degree level
QCF3 - A level & equivalent
QCF2 - GCSE (A-C) & equivalent
QCF1 - GCSE (below grade C) & equivalent
No Q - No Qualification
76
Culture sector qualifications, 2014 - 2024
2024
11%
46%
18%
18%
6%
Source: UKCES Working Futures 2014 - 2024
2014
9%
35%
21%
21%
10%
0%
100%
QCF 7-8
QCF 4-6
QCF 3
QCF 2
QCF 1
No Qual
Please note that the Working Futures data uses the
following breakout of qualification levels:
QCF8 - Doctorate
QCF7 - Other higher degree
QCF6 - First degree
QCF5 - Foundation degree; Nursing; Teaching
QCF4 - HE below degree level
QCF3 - A level & equivalent
QCF2 - GCSE (A-C) & equivalent
QCF1 - GCSE (below grade C) & equivalent
No Q - No Qualification
77
Appendix - Visitor Economy sector definition
The following five digit SIC codes have been used to measure levels of, and change in, both employment and enterprise numbers in the sector.
Accomodation for visitors
55100 : Hotels and similar accommodation
55201 : Holiday centres and villages
55202 : Youth hostels
55209 : Other holiday and other short-stay accommodation (not including holiday centres and villages or youth hostels) nec
55300 : Camping grounds, recreational vehicle parks and trailer parks
55900 : Other accommodation
Food and beverage serving activities
56101 : Licensed restaurants
56102 : Unlicensed restaurants and cafes
56103 : Take away food shops and mobile food stands
56210 : Event catering activities
56290 : Other food service activities
56301 : Licensed clubs
56302 : Public houses and bars
Rail passenger transport
49100 : Passenger rail transport, interurban
Road passenger transport
49320 : Taxi operation
49390 : Other passenger land transport nec
Water passenger transport
50100 : Sea and coastal passenger water transport
50300 : Inland passenger water transport
Air passenger transport
51101 : Scheduled passenger air transport
51102 : Non-scheduled passenger air transport
79
Transport equipment rental
77110 : Renting and leasing of cars and light motor vehicles
77341 : Renting and leasing of passenger water transport equipment
77351 : Renting and leasing of passenger air transport equipment
Travel agencies and other reservation service activites
79110 : Travel agency activities
79120 : Tour operator activities
79901 : Activities of tourist guides
79909 : Other reservation service activities (not including activities of tourist guides)
Cultural activites
90010 : Performing arts
90020 : Support activities to performing arts
90030 : Artistic creation
90040 : Operation of arts facilities
91020 : Museum activities
91030 : Operation of historical sites and buildings and similar visitor attractions
91040 : Botanical and zoological gardens and nature reserve activities
Sporting & Recreational activities
92000 : Gambling and betting activities
93110 : Operation of sports facilities
93191 : Activities of racehorse owners
93199 : Other sports activities (not including activities of racehorse owners) nec
93210 : Activities of amusement parks and theme parks
93290 : Other amusement and recreation activities
77210 : Renting and leasing of recreational and sports goods
Country-specific tourism characteristic activities
82301 : Activities of exhibition and fair organizers
82302 : Activities of conference organizers
68202 : Letting and operating of conference and exhibition centres
80
Culture and The Arts
18140 : Binding and related services
18201 : Reproduction of sound recording
18202 : Reproduction of video recording
18203 : Reproduction of computer media
32120 : Manufacture of jewellery and related articles
32130 : Manufacture of imitation jewellery and related articles
32200 : Manufacture of musical instruments
46431 : Wholesale of gramophone records, audio tapes, compact discs and video tapes and of the equipment on which these are played
46491 : Wholesale of musical instruments
47591 : Retail sale of musical instruments and scores in specialised stores
47610 : Retail sale of books in specialised stores
47630 : Retail sale of music and video recordings in specialised stores
47781 : Retail sale in commercial art galleries
47791 : Retail sale of antiques including antique books, in stores
58120 : Publishing of directories and mailing lists
58141 : Publishing of learned journals
58142 : Publishing of consumer, business and professional journals and periodicals
58190 : Other publishing activities
58210 : Publishing of computer games
58290 : Other software publishing
59111 : Motion picture production activities
59112 : Video production activities
59113 : Television programme production activities
59120 : Motion picture, video and television programme post-production activities
59131 : Motion picture distribution activities
59132 : Video distribution activities
59133 : Television programme distribution activities
81
59140 : Motion picture projection activities
59200 : Sound recording and music publishing activities
60100 : Radio broadcasting
60200 : Television programming and broadcasting activities
74201 : Portrait photographic activities
74202 : Other specialist photography (not including portrait photography)
74203 : Film processing
74209 : Other photographic activities (not including portrait and other specialist photography and film processing) nec
74300 : Translation and interpretation activities
77291 : Renting and leasing of media entertainment equipment
78101 : Motion picture, television and other theatrical casting
85520 : Cultural education
90010 : Performing arts
90020 : Support activities to performing arts
90030 : Artistic creation
90040 : Operation of arts facilities
91011 : Library activities
91012 : Archive activities
91020 : Museum activities
91030 : Operation of historical sites and buildings and similar visitor attractions
91040 : Botanical and zoological gardens and nature reserve activities
92000 : Gambling and betting activities
93110 : Operation of sports facilities
93191 : Activities of racehorse owners
93199 : Other sports activities (not including activities of racehorse owners) nec
93210 : Activities of amusement parks and theme parks
93290 : Other amusement and recreation activities
94910 : Activities of religious organisations
82