New Anglia Transport Board
Agile to Change
Agenda
1.00pm - 3.00pm, Tuesday 25th February 2020
Gallery Two, Ipswich Town Hall, Ipswich
1.00
1.
Welcome and introductions
Chair
Connections Café reflections
1.05
2.
Minutes and matters arising and confidential papers
Chair
1.10
3.
Innovation in transport
Lisa Perkins,
Using technology to shape future transport
BT
1.30
4.
Transport and clean growth
Ellen Goodwin
1.45
5.
Transport East update - verbal
Graeme Mateer
2.00
6.
Ely update
Riz Hanid,
Network Rail
2.20
7.
Making the Integrated Transport Strategy Happen
ALL
MEMBER ROUNDTABLE - verbal
Road: Roads Investment Strategy and Transforming Cities Fund
Rail: Haughley, Trowse and GEML
Others
2.35
8.
Norfolk and Suffolk Investment Plan - verbal
Ellen Goodwin
2.45
9.
Freeports Consultation
All
2.50
10.
Terms of reference review
Chair
2.55
11.
Any other business
All
Forward Plan - for discussion
Date of next meeting - 9.30, 2 June, Norfolk County Council
Officer Contact
If you have any questions about matters contained on this agenda, please get in touch with:
Ellen Goodwin
07384 258662
1
New Anglia Transport Board
Connecting the East, Accessing the World
Meeting Note
9.30am - 11.30am, Tuesday 19th November 2019
Colman Room, County Hall, Norwich, NR1 2UA
Board attendance:
Paul Ager
Associated British Ports
Karen Chapman
Suffolk Growth Programme Board
Helen Corina
Norfolk County Council
David Cumming
Norfolk County Council
Paul Davey
Hutchison Ports
Jonathan Denby
Greater Anglia
Nova Fairbank
Norfolk Chamber of Commerce
Doug Field
New Anglia LEP
Ellen Goodwin
New Anglia LEP
Paul Horne
Suffolk County Council
Graeme Mateer
Suffolk County Council
Richard Perkins
Suffolk Chamber of Commerce
Jonathan Rudd
New Anglia LEP
Cllr Barry Stone
Norfolk County Council
Steve Thulborn
Highways England
Andy Walker
Suffolk Chamber of Commerce
Apologies:
Simon Amor
Highways England
Philip Broadbent-Yale
Sustrans
Jamie Burles
Greater Anglia
Jonathan Cage
Norfolk Chamber of Commerce
Andrew Harston
Associated British Ports
Martin Fellowes
Highways England
Paul Martin
First Buses
Andrew Mower
Federation of Small Businesses
Cllr Graham Plant
Great Yarmouth Borough Council
Cllr Andrew Reid
Suffolk County Council
Sue Roper
Suffolk County Council
Rajinder Sharma
Connected Places Catapult
Chris Soule
CLA
1.
Minutes and matters arising
The previous minutes were accepted as a true record.
2.
The importance of port connectivity
PD presented Hutchison Port’s view on the importance of port connectivity.
3
Key points raised:
The Port of Felixstowe is Britain’s largest container port with more than 40% of all containers coming in and out of
Britain passing through the port.
The port handles 4million TEUs a year, twice that of any other port. 70% of containers coming through
Felixstowe are delivered to the ‘golden triangle’ including the midlands and the north.
2.6million TEUs are transported by road, 1million by rail and 0.5million by sea. Rail modal share has increased
significantly since 2004 with pent up demand for rail being constrained by infrastructure. Rail emissions
compared to road are 76% lower.
The port is well located with respect to the world’s shipping lanes and has a good offer in terms of national
strategic connectivity.
KC asked the group whether they thought more significant private sector investment in infrastructure was likely in the
future.
3.
Maritime cluster update
EG updated the Board on the initial discussions regarding establishing a Norfolk and Suffolk Maritime Cluster.
PD noted confusion between Maritime Clusters and Port Economic Partnerships.
ACTION - Ellen to contact DfT to establish similarities and differences.
PD also noted that short sea economics are challenging compared to both road and rail.
4.
Norwich Airport update
Doug Field presented a short update from Norwich Airport on behalf of Richard Pace.
NF commented that it was challenging to garner business buy-in to new routes before they were introduced.
5.
BREXIT update
The LEP submits a weekly report to government on a range of factors. Information is obtained through a number
of sources.
The LEP and Growth Hub advisers have signposted businesses to government’s dedicated webpage
The LEP is looking to ensure that where EU funding is not yet allocated then local projects come forward to
maximise take up for the region and benefit from any opportunities this creates.
The LEP is also engaged in the dialogue with government on the development of the Shared Prosperity Fund - a
“successor fund” for when the UK leaves the EU.
The LEP is also looking, with government, at how to adapt existing programmes of support, both nationally and
locally, to make interventions that help deal with economic shocks or a possible “no deal”.
The Growth Hub has received funding from BEIS to the end of March 2020 for additional staffing resource to
support business preparations on Brexit, with two advisers holding county-wide roles.
The LEP Executive has appointed Metro Dynamics to update the report published in 2017 on the potential
impacts of Brexit for Norfolk and Suffolk. This piece of work will be completed in early January 2020.
Questions for the group:
Are there any businesses that have pulled together a Brexit plan / business resilience plan?
Have businesses assessed the impacts of Brexit? If so, opportunities or negative impacts?
As a sector, what are the key opportunities or main challenges arising from Brexit?
Are there any interventions that you feel are needed as a result of Brexit in the business support landscape?
ACTION - all to feedback relevant intelligence
6.
Making the Integrated Transport Strategy happen
Growth Deal
JR presented a paper on the Growth Deal programme. He highlighted concerns regarding the Ely area scheme and
4
the timelines for business case delivery.
RP queried why timescales had changed so much. JR stated a number of reasons for this including integrating an
appropriate road solution and the number of level crossings in the area.
JD updated the Board on the Rail Network Enhancements Pipeline (RNEP) process and stated that the Secretary of
State had queried what could practically be achieved before 2024. JD suggested that this could include established
franchise commitments and some additional freight capacity, but Network Rail need to do their assessment in support
of DfT’s request in order to determine costs and deliverability.
The Board noted that while quick wins were desirable it was important to continue to push the case for the delivery of
the full programme. The Board agreed that a political strategy needed to be defined in order to promote the strategic
case with MPs.
ACTION - update from Network Rail at next meeting
ACTION - LEP Board and Ely Taskforce to consider political strategy next steps
ACTION - DF to write to the new Secretary of State outlining the LEP’s transport priorities
RIS 2 and MRN update
A RIS2 announcement is not now expected until the New Year. Copdock junction has received some early funding to
help advance the feasibility stage of progressing a free flowing A12/A14 slip.
Transport East submitted its priorities for the Major Road Network at the end of July. Both the Barnby Bends and
Long Stratton Bypass schemes have progressed to the next stage with other projects requiring some additional
clarification before a final decision is made.
Rail
GEML: new rolling stock to be introduced soon, Norwich in 90/Ipswich in 60 now in service, work ongoing to identify
infrastructure requirements needed on the line, Giles Watling MP the new Taskforce Chair.
Haughley: local commitment has helped to advance the scheme significantly.
Trowse: not needed for GEML until the 2040s but cumulative impact of GEML and east-west connectivity means
improvements are likely to be needed sooner. Initial thinking has begun between interested partners.
Greater Anglia
Good recent performance statistics, new trains continue to be brought into service, new timetable to be introduced in
December, Wherry Line re-signalling expected early 2020
ACTION - develop case study for Norfolk and Suffolk Unlimited regarding challenging perceptions once full
roll out complete
ABP
Significant recent investment across eastern ports.
Suffolk Chamber of Commerce
Written to all MP candidates outlining infrastructure priorities.
Highways England
A14 improvements to open soon. NCC said they had recently met with HE to outline their A47 delivery concerns.
ACTION - ST to provide A47 update
Suffolk County Council
Ipswich Northern Route SOBC announcement expected shortly.
Norfolk County Council
Opening of Hempnall roundabout despite drainage challenges.
5
Connected Places Catapult
Bluetech - forthcoming meeting with Paul Davey from Hutchison Ports. Also, in continued dialogue with Suffolk
County Council, East Suffolk Council and Tech East.
Connections Café - next meeting to coincide with an East of England Connections Café - tbc
Future Mobility Zones, Norwich - currently awaiting announcement from government now delayed after election
due to purdah
Cambridge-Norwich Tech Corridor - currently in discussions with Linn Clabburn on a feasibility study on transport
innovation on the corridor
7.
Transport East update
The new tentative date for the postponed Transport East summit is 26 February 2020.
Transport East are holding a Carbon Inquiry over three sessions, the first of which is scheduled for 2 December.
Board comments included:
Clean maritime plan and supporting air quality strategies
Rail electrification, quick wins and franchise renewal opportunities
Environmental funding expected through RIS2
8.
Any other business
No new items for future business were discussed
Date of next meeting - 9.30am, 25 February 2020 - Ipswich
6
New Anglia Transport Board
Tuesday 25th February 2020
Agenda Item 4
Transport and Clean Growth
Author and presenter: Ellen Goodwin
Summary
This report summarises the work to date of the New Anglia LEP around clean growth and asks
the Transport Board for its thoughts on how it might contribute to this agenda moving forward.
Recommendation
The Board is asked to:
Review the identified actions and consider next steps with respect to clean growth and
the decarbonisation agenda
Consider other actions that the transport sector could pursue
Agree what actions the Transport Board would like to champion and take forward as
part of its ongoing work
Background
In 2019, the New Anglia LEP commissioned the University of East Anglia to produce a Scoping
Report on carbon reduction and climate change adaptation. The output of this work can be
found at Appendix A.
On 25 September 2019, the New Anglia LEP Board endorsed the Local Industrial Strategy for
Norfolk and Suffolk, the golden thread for which is ‘clean growth’. As a result of this golden
thread the LEP Board later tasked the LEP’s sub boards and working groups responsible for
infrastructure to consider how the clean growth agenda might be achieved.
In February 2020 the New Anglia LEP Board will consider a draft action plan in support of clean
growth.
Transport and clean growth
This paper highlights the clean growth considerations with respect to transport and asks the
Board for their view on how it might contribute to achieving clean growth ambitions and the
decarbonisation agenda for Norfolk and Suffolk into the future. The ways in which transport is
already and could further contribute to this agenda include:
Imbed clean growth ambitions in transport strategies and policies
17
Improve access to/use of more sustainable modes/models through integration and
behaviour change
Reduce the need to travel through better digital connectivity, flexible working and the
internet of things
Consider freight movements, including maritime, and air as modes/ types for further
exploration - in order to reduce emissions significantly the full spectrum of the transport
sector should be considered
Develop an EV strategy focussed on supporting infrastructure as well as take up
Work with the Connected Places Catapult to drive transport innovation and support for
SMEs
Improve air quality
Consider the resilience of infrastructure in a changing climate
As previously stated, many of these actions are already being achieved with varying degrees of
success. However, the Climate Change Adaptation and Carbon Reduction Action Plan
Scoping Report states that:
“Data on UK greenhouse gas emissions are published by the Department for Business,
Energy & Industrial Strategy (BEIS) and include carbon dioxide (CO2) emissions estimates
for local authorities (2005-16) with a breakdown by 14 economic sectors. UK CO2 emissions
declined from 522,857 kt CO2 in 2005 to 357,470 kt CO2 in 2016. However, the decline for
transport was much smaller than that for many other sectors, less than 10,000 kt CO2, so its
relative contribution increased from 26% in 2005 to 36% in 2016.”
It is therefore critical that the transport sector further consider how it might contribute to clean
growth and the decarbonisation agenda into the future.
Indeed, Transport East is already planning how it may contribute to the decarbonisation agenda
as part of its ongoing transport strategy work and it would prove useful for the New Anglia
Transport Board to contribute to this debate.
Link to the Integrated Transport Strategy
The Integrated Transport Strategy focusses on the need to plan for the future including the
impacts of climate change and the role of renewable energy.
Recommendation
The Board is asked to:
Review the identified actions and consider next steps with respect to clean growth and
the decarbonisation agenda
Consider other actions that the transport sector could pursue
Agree what actions the Transport Board would like to champion and take forward as
part of its ongoing work
Appendix A - Climate Change Adaptation and Carbon Reduction Action Plan Scoping Report
18
Scoping Report for the New Anglia LEP
Climate Change Adaptation and Carbon Reduction Action Plan
Research Team:
Prof Andrew Lovett
Dr Trudie Dockerty
Ms Gilla Sűnnenberg
Dr Clare Goodess
Prof Corinne Le Quéré
July 2019
19
The Registry
UEA Norwich Research Park
Norwich
NR4 7TJ
Contents
Page
Executive Summary
3
Introduction
7
Part I. Climate Data and Projections
8
1.1 Indications of changes in local climate from the recent historic record
8
1.2 Projected future changes in local climate
12
1.3 Sea level
18
Part II. Emissions Data and Projections
20
Part III. Developing a Climate Change Adaptation and Carbon
27
Reduction Action Plan
3.1 Downscaling to the NALEP area and individual businesses
29
3.2 Elements of an action plan for Norfolk and Suffolk
31
References
33
2
20
The Registry
UEA Norwich Research Park
Norwich
NR4 7TJ
Executive Summary
Climate change is increasingly recognised as a major and urgent global challenge, with existing and
projected impacts on many dimensions of sustainable development. This is reflected in the recent
decision of the UK government to adopt a target of net zero greenhouse gas (GHG) emissions by
2050 and declarations of a ‘Climate Emergency’ by many local government bodies.
The purpose of this scoping study is to help develop an action plan to incorporate climate change
adaptation and carbon reduction ambition into the objectives of the New Anglia LEP for Norfolk and
Suffolk. It is in three main sections and reviews:
• Existing knowledge on observed and projected climate changes
• Trends and geographical distribution of greenhouse gas emissions
• Local priorities for climate change mitigation and adaptation
Observed and Projected Climate Change
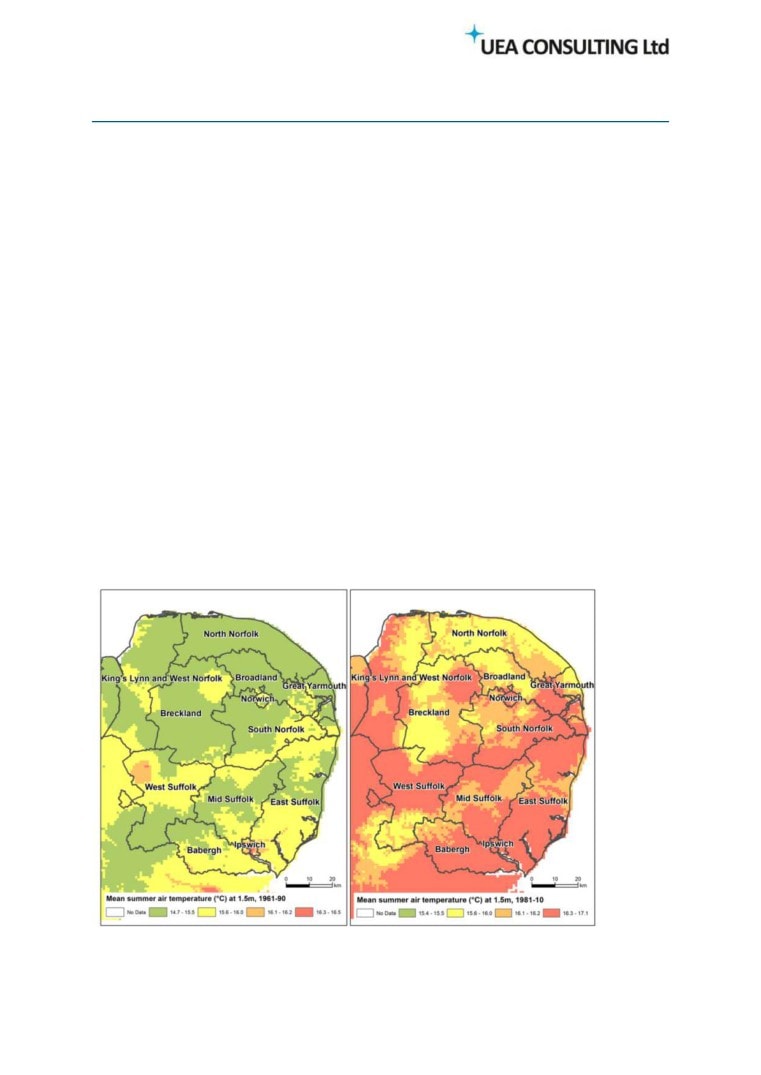
Details from the Met Office HadUK-Grid dataset have been analysed for two 30-year baseline time
periods (1961-90 and 1981-2010) to examine recent changes in temperature and precipitation. The
trends are stronger for temperature than precipitation and generally show an increase in indicators
of higher summer temperatures, a reduction in those for colder winter temperatures and greater
rainfall intensity. The maps below, for example, show an increase in mean summer temperatures of
at least 0.5°C between the two baseline periods.
3
21
The Registry
UEA Norwich Research Park
Norwich
NR4 7TJ
The UK Climate Projections 18 (UKCP18) outputs from the Met Office present estimates of future
climate for four pathways representing different amounts of global surface temperature increase by
2100. Mapped results at a 25 km cell resolution show little geographical variability across the region
and there is considerable uncertainty in the individual pathway projections. Nevertheless, taking the
mid-point (50th percentile) in projections for the East of England through to around 2040 indicates
the following changes compared to a 1981-2000 baseline.
• An increase in mean summer temperature of 1.2°C to 1.6°C
• An increase in mean winter temperature of 1.0°C to 1.3°C
• A decrease in mean summer precipitation of 1% to 13%
• An increase in mean winter precipitation of 5% to 8%
UKCP18 also includes projections for future sea level rise and storm surges. It is expected that the
rise in mean sea level will be greater in the south of the UK than the north and projections for Great
Yarmouth under the most extreme of the four pathways indicate a 0.2 - 0.4m mean sea level rise by
the middle of the century and potentially 0.6 to over 1 metre by 2100. There is considerable
uncertainty in these projections, but they provide an indication of the extent of change that should
be anticipated in long-term planning.
Trends in Greenhouse Gas Emissions
Data on UK greenhouse gas emissions are published by the Department for Business, Energy &
Industrial Strategy (BEIS) and include carbon dioxide (CO2) emissions estimates for local authorities
(2005-16) with a breakdown by 14 economic sectors. UK CO2 emissions declined from 522,857 kt
CO2 in 2005 to 357,470 kt CO2 in 2016. However, the decline for transport was much smaller than
that for many other sectors so its relative contribution increased from 26% in 2005 to 36% in 2016.
Per capita CO2 emissions estimates for the UK declined from 8.7 to 5.4 tonnes/person between 2005
and 2016. Norfolk and Suffolk went from having below UK average per capita CO2 emissions in 2005
to above average in 2016 (5.7 and 5.6 tonnes/person respectively). This was associated with an
increase in the relative importance of road transport sources in the two counties. These totals will
need to reduce to no greater than 1.7 tonnes CO2e/year per capita by 2050 to meet the objective of
the Paris Agreement to limit a global temperature rise this century to 1.5 °C.
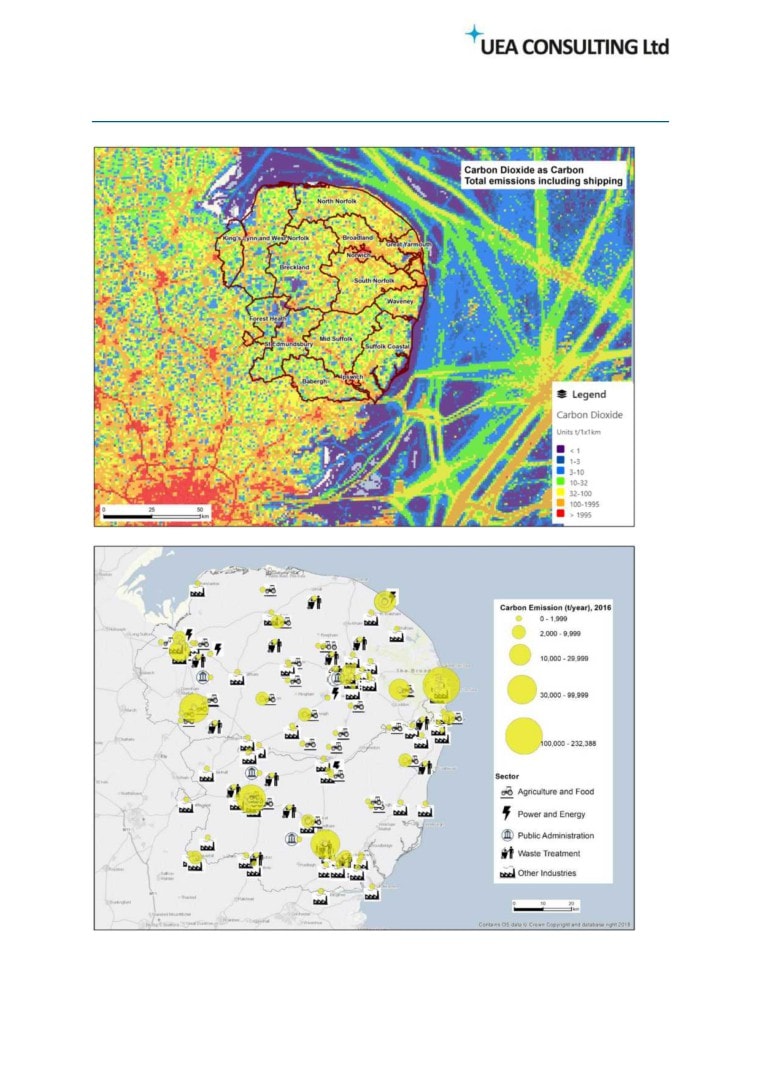
A more geographically detailed perspective on emissions can be obtained from the National
Atmospheric Emissions Inventory (NAEI) which contains both 1 km grid cell emissions estimates and
details of individual ‘point sources’ (i.e. large factories and power stations). The first map on the
next page shows gridded estimates for carbon dioxide and highlights that many parts of Norfolk and
Suffolk have relatively low CO2 emissions compared to the region around London, as well as
illustrating the extent of carbon emissions associated with road transport and shipping routes. A
second map shows major point source emitters such as power stations and food processing plants.
Overall, the 37 point sources accounted for 22.6% of total CO2 emissions in Norfolk and Suffolk
during 2016.
4
22
The Registry
UEA Norwich Research Park
Norwich
NR4 7TJ
5
23
The Registry
UEA Norwich Research Park
Norwich
NR4 7TJ
Local Priorities for Climate Change Mitigation and Adaptation
Based on the data regarding climate and greenhouse gas trends the following are suggested as
issues that need particular attention in an action plan for Norfolk and Suffolk.
Domestic Sector - The existing building stock will need to be adapted to provide suitable conditions
for people to live and work in a warmer climate. This will be important for business productivity and
also represents an opportunity for local construction businesses. An additional consideration in rural
areas that are not connected to the national gas grid will be to develop alternative means of heating
provision, both to meet decarbonisation targets and reduce reliance on oil.
Transport Sector - Increased use of public transport and electric vehicles will need to be a central
element of decarbonising transport in the next 30 years. Provision of public electric charging points
is currently limited in many parts of Norfolk and Suffolk and requires investment.
Agricultural Sector - Improved water management needs to be a priority for coming decades, both
in terms of increased storage capacity and greater use efficiency. Opportunities will exist for land
owners and managers to contribute to carbon sequestration and to develop enterprises based on
new crops or to meet demand for local renewable generation of heat and power.
Food Processing Sector - Several processing plants make a substantial contribution to regional
greenhouse gas emissions and options to reduce their carbon footprints should be investigated.
Energy Sector - The region is already a leading generator of renewable energy and the coming
decades will see a growing demand for electricity, particularly from domestic and transport sectors.
At present, there are constraints on the capacity of the electricity transmission and distribution
network in many parts of Norfolk and Suffolk and developing an investment strategy to rectify this
situation is fundamental to both meeting decarbonisation objectives as well as supporting future
economic growth. Extension of the existing high-voltage transmission network to a coastal
destination would also be beneficial to the marine renewables industry.
Many of these priorities interact with each other so it is important that an action plan should involve
coordination between sectors as well as initiatives within them. Overall, the challenges of climate
change mitigation and adaptation are considerable, but they will be less formidable if action is taken
sooner than later, and this could also provide important opportunities and benefits for businesses
and residents in Norfolk and Suffolk.
6
24
The Registry
UEA Norwich Research Park
Norwich
NR4 7TJ
Introduction
Climate change is increasingly recognised as a major and urgent global challenge, with existing and
projected impacts on many dimensions of sustainable development (Intergovernmental Panel on
Climate Change (IPCC), 2018; Committee on Climate Change (CCC), 2019a). This is reflected in the
recent decision of the UK government to adopt a target of net zero greenhouse gas (GHG) emissions
by 2050 (HM Government, 2019) and declarations of a ‘Climate Emergency’ by many local
government bodies (see https://climateemergency.uk/). Addressing the mitigation (limiting
emissions of GHGs) and adaptation (altering how we live) challenges of climate change will require
action by many different organisations, from global to local scales and in both the public and private
sectors.
Aims
The purpose of this scoping study and report is to help develop an action plan to incorporate climate
change adaptation and carbon reduction ambition into the objectives of the New Anglia LEP for
Norfolk and Suffolk. It details current knowledge that could underpin development of a full action
plan covering three interconnected priorities:
• How can businesses in Norfolk and Suffolk increase their resilience to climate change while
maximising their growth opportunities?
• How can Norfolk and Suffolk contribute to the national carbon reduction goals while meeting
its own objectives for growth and employment; where are the new opportunities arising?
• How can national and international responses to climate change support wider objectives of
reducing poverty in Norfolk and Suffolk and create new opportunities for clean growth?
This scoping report examines historic and projected climate data and trends, highlights key
government research related to business risks and adaptation needs, and indicates initial steps
towards the development of a full adaptation and mitigation action plan for Norfolk and Suffolk.
7
25
The Registry
UEA Norwich Research Park
Norwich
NR4 7TJ
Part I. Climate Data and Projections
This section reviews the existing knowledge on historic climate and projected changes in Norfolk and
Suffolk.
1.1 Indications of changes in local climate from the recent historic record
Land surface weather observations for the UK dating back to 1862 have been compiled into a 1 km
by 1 km gridded dataset (HadUK-Grid) which is available from the Met Office website1. It contains
daily, monthly, seasonal and annual values for a range of variables that enables the analysis of
changes in extremes and also the long term averages (over 30 year timespans) that provide a set of
climatological reference periods for the UK.
The examination of changes in climate between 30 year reference periods2 is a standard way of
examining how the climate is changing over time.
For this study data from HadUK-Grid have been downloaded for Norfolk and Suffolk and imported
into a Geographical Information System (GIS) to enable further analysis and mapping. To illustrate
recent changes in the climate of Norfolk and Suffolk, two reference periods have been selected. The
1961-90 baseline coincides with many early reports from the IPCC and therefore enables these
results to be compared against those documents. The 1981-2010 baseline is the basis for the new
UKCP18 climate change scenarios (https://www.metoffice.gov.uk/research/collaboration/ukcp).
Many of the maps published from UKCP18 data present potential future changes in climate from this
baseline. Hence, using these two periods enables results in this study to be interpreted against a
wide body of literature and existing research.
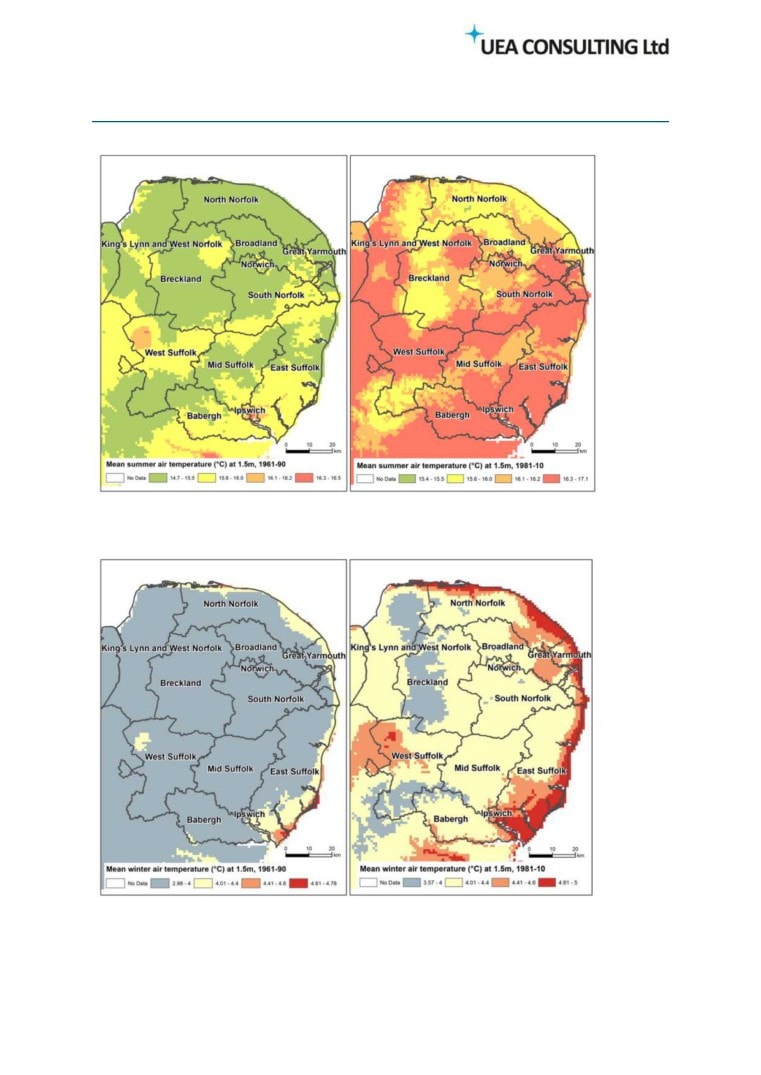
Temperature and precipitation are the weather variables of greatest familiarity and so, for
illustration, Figure 1 shows mean annual summer (June, July, August) temperatures for both baseline
periods and Figure 2 does the same for mean winter (December, January, February) temperatures.
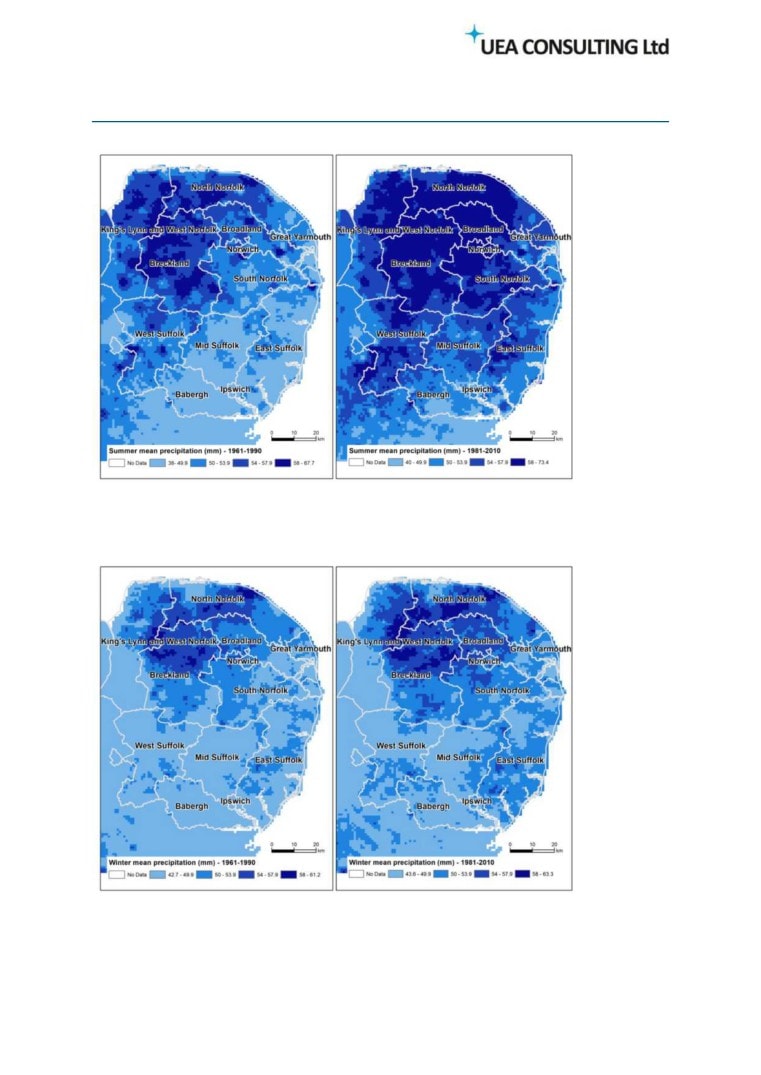
Figures 3 and 4 map mean summer and winter precipitation respectively, again for both baseline
periods. Summer temperatures tend to be higher in the south of the region and in many places are
at least 0.5°C higher in the second baseline period. Mean winter temperatures show a similar
change between the two time periods, though with lower values inland and higher average
temperatures around the coast.
For precipitation, the differences between the two baseline periods are less pronounced, though
there is a tendency for summer precipitation to increase in the east of the region and winter
averages are higher in the north and east compared to further inland.
2 Climate is the weather of a place averaged over a period of time, conventionally 30 years
8
26
The Registry
UEA Norwich Research Park
Norwich
NR4 7TJ
Figure 1: Observed changes in mean summer temperature in East Anglia between 1961-90 and
1981-2010
Figure 2: Observed changes in mean winter temperature in East Anglia between 1961-90 and
1981-2010
9
27
The Registry
UEA Norwich Research Park
Norwich
NR4 7TJ
Figure 3: Observed changes in mean summer precipitation in East Anglia between 1961-90 and
1981-2010
Figure 4: Observed changes in mean winter precipitation in East Anglia between 1961-90 and
1981-2010
10
28
The Registry
UEA Norwich Research Park
Norwich
NR4 7TJ
An additional perspective on observed changes is provided by Met Office indices on climate
extremes (Met Office, 2018a). These are published on a regional basis and are summarised for the
Met Office East Anglian region (defined as the East of England NUTS 1 region but excluding
Peterborough) in Table 1.
Table 1: Observed changes in temperature and precipitation extremes in the Met Office East
Anglian region
1961-1990
1981-2010
Most Recent Decade
Variable
Reference Period
Reference Period
(2008-2017)
High Temperature Indices
Highest daily maximum temperature (°C)
28.5
29.9
30.3
Summer days (number of days with maximum
10.8
16.4
15.7
temperature above 25°C)
Low Temperature Indices
Icing days (number of days with maximum
2.9
2.0
1.0
temperature below 0°C)
Lowest daily minimum temperature (°C)
-8.1
-7.1
-6.9
Cold spell duration index (days where
temperature is below the 90th percentile of
3.7
2.8
1.0
1961-90 baseline)
Precipitation indices
Maximum 5-day precipitation (mm of rainfall
50.6
53.1
51.8
accumulated over 5 days)
Rainfall from extremely wet days (total
50.1
56.8
53.2
rainfall days in excess of 1961-90 baseline)
The indices in Table 1 show the following trends between the two 30-year baseline periods:
• An increase in indicators of higher temperatures
• A reduction in indicators of colder temperatures
• An increase in indicators of rainfall intensity
Several of these trends continue in the data from the 2008-2017 decade (e.g. those for colder
temperatures), but this is not always the case. For instance, the indicators of rainfall intensity are
lower for 2008-2017 than 1981-2100, though higher than in 1961-1990. This highlights the
variability of weather and consequently the importance of evaluating changes in climate over longer
periods of time.
Overall, the maps and indices suggest that the climate of Norfolk and Suffolk has become warmer in
recent decades, with cold spells getting shorter and less cold. This has direct relevance to
agricultural and horticultural production, and potential adaptive consequences for the food and
11
29
The Registry
UEA Norwich Research Park
Norwich
NR4 7TJ
drink sector, but will also affect businesses and industrial premises and other NALEP priority sectors
e.g. through changes to heating and cooling requirements.
There is more ambiguity with regard to long-term precipitation trends, although it does appear that
rainfall intensity is increasing and extremely wet days are becoming more frequent. Again, this can
have direct consequences for farming and agricultural production, but wider implications for other
business sectors and society in general e.g. with regard to flooding risks.
With regard to the potential for changes in frequency or intensity of other climate indicators (e.g.
wind storms or droughts) the State of the UK Climate 2017 report (Kendon et al., 2018) examines the
observed data for possible shifting trends, but reports that the evidence for change in extreme
weather events appears to be weak at present.
1.2 Projected future changes in local climate
A new set of climate change projections for the UK have recently been published by the Met Office
Hadley Centre Climate Programme. UKCP18 (UK Climate Projections 2018) is based on the latest
climate science and examines how the climate may change over the 21st century including, for the
first time, the influence of mitigation measures.
The UKCP18 climate change scenarios are based on four Representative Concentration Pathways
(RCPs) that estimate GHG emissions and climate change for future radiative forcing targets in 2100
of 2.6, 4.5, 6.0 and 8.5 Wm2 (watts per meter squared). Radiative forcing is the difference between
insolation (sunlight) absorbed by the Earth and energy radiated back to space and is influenced by
atmospheric concentrations of greenhouse gases. Table 2 shows the projected increase in global
mean surface temperature under each pathway.
Table 2: UKCP18 climate change scenarios
Increase in global mean surface
RCP
temperature (°C) by 2081-2100
Comment
RCP2.6
1.6 (0.9 - 2.3)
Closest to Paris Agreement
RCP4.5
2.4 (1.7 - 3.2)
‘most likely’
RCP6.0
2.8 (2.0 - 3.7)
Intermediate stabilisation
RCP8.5
4.3 (3.2 - 5.4)
No mitigation
RCP2.6 keeps climate change to below 2.0°C and is closest to meeting the Paris Agreement target of
limiting the increase in global average temperature to 1.5 °C above pre-industrial levels. RCP4.5 is
considered the ‘most likely’ pathway given current trends in GHG emissions. Emissions stabilise at
2030s with no further increases after that. RCP6.0 assumes some continuing increase in emissions
12
30
The Registry
UEA Norwich Research Park
Norwich
NR4 7TJ
increase after 2030s and RCP8.5 assumes no mitigation, and therefore represents an extreme
position (Met Office, 2019).
Data are available at 25 km grid cell resolution for all scenarios. A web-based user Interface3 enables
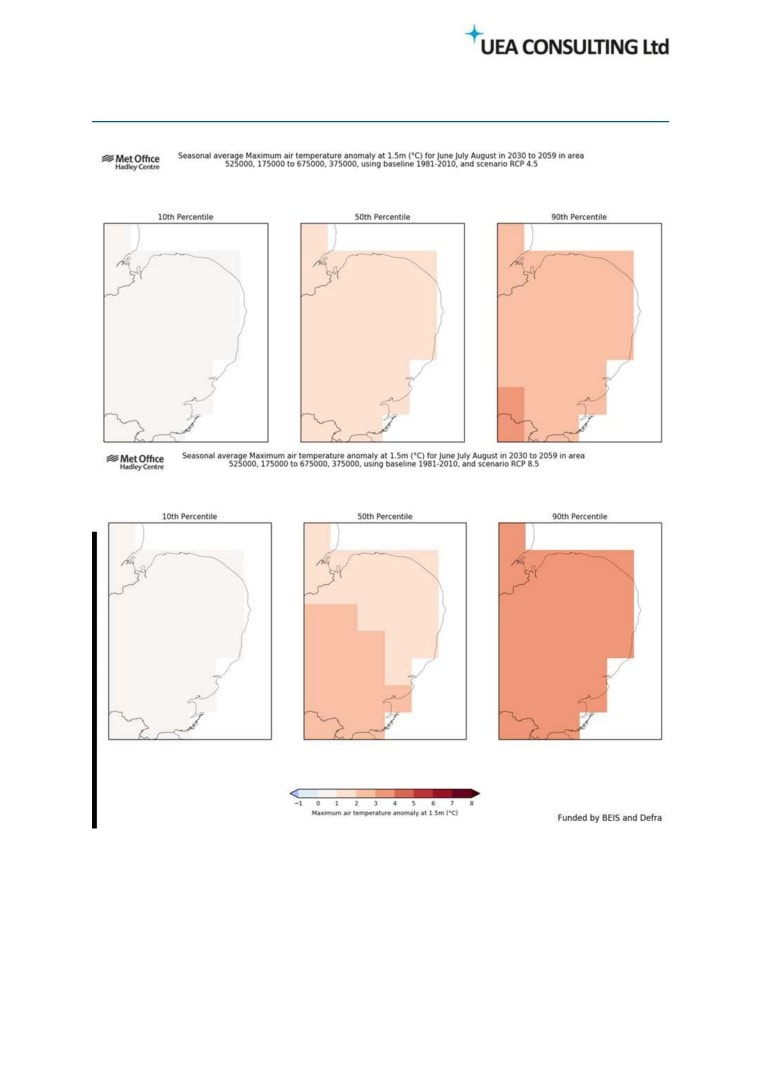
maps and data to be downloaded for further analysis. An example of the kind of map that can be
generated via the user Interface is shown in Figure 5.
The top row of maps in Figure 5 show the projected change in maximum summer temperatures for
the period 2030-2059, compared to the 1981-2010 baseline under the RCP4.5 pathway. All the
projections have an uncertainty range, represented by the three maps - the 10th and 90th percentiles
indicating values towards the lower and upper extremes of likelihood respectively, while the 50th
percentile represents the mid-point of likelihood for that particular pathway. The values mapped
are temperature anomalies so illustrate differences from the 1981-2010 baseline. In the 50th
percentile map all of the region is in the category for a 1-2°C projected increase, while the 10th and
90th percentile maps show a rise of 0-1°C and 2-3°C respectively.
The bottom row of maps shows the same variable under the extreme RCP8.5 pathway. Comparing
pathways provides a means of evaluating the sensitivity of outcomes to input assumptions and in
this case the 50th percentile map indicates that parts of the region could experience a 2-3°C increase
in maximum summer temperatures with an upper estimate (90th percentile) of 3-4°C.
All of the maps show little variability across Norfolk and Suffolk, but there are plans to produce
downscaled versions of the projections at a 2.2 km resolution (Fang, 2019) which would enable a
more detailed assessment of geographical variations in potential impacts.
Additional details can be extracted via the user interface to examine projections at a regional scale.
Table 3 shows results for the East of England region in terms of changes in temperature and
precipitation from 1981-2000 to around 2040 (represented by 2030-49 period). The values cover all
four scenarios and five points on the range of uncertainty. One feature of these results is the range
of uncertainty (e.g. as represented by the range between the 5th and 95th percentile values), but the
50th percentile results (i.e. mid point of likelihood) suggest:
• An increase in mean summer temperature of 1.2°C to 1.6°C
• An increase in mean winter temperature of 1.0°C to 1.3°C
• A decrease in mean summer precipitation of 1% to 13%
• An increase in mean winter precipitation of 5% to 8%
13
31
The Registry
UEA Norwich Research Park
Norwich
NR4 7TJ
Figure 5: Example of map data that can be generated from the UKCP18 user interface
14
32
The Registry
UEA Norwich Research Park
Norwich
NR4 7TJ
Table 3: Projected changes in temperature and precipitation for the East of England from 1981-
2000 to around 2040 (2030-2049)
5th
10th
50th
90th
95th
Emissions
percentile
percentile
percentile
percentile
percentile
Variable
Scenario
change
change
change
change
change
RCP2.6
0.3
0.5
1.6
2.6
2.9
mean summer
RCP4.5
0
0.3
1.3
2.3
2.6
temperature (°C)
RCP6.0
0
0.2
1.2
2.3
2.6
2030-2049
RCP8.5
0.2
0.6
1.6
2.8
3.1
RCP2.6
-0.2
0.1
1
2
2.3
mean winter temperature
RCP4.5
-0.1
0.2
1.1
1.9
2.2
(°C) 2030-2049
RCP6.0
-0.1
0.2
1
1.9
2.1
RCP8.5
0.1
0.3
1.3
2.3
2.6
RCP2.6
-37
-31
-11
10
16
mean summer
RCP4.5
-38
-32
-10
12
19
precipitation (%)
RCP6.0
-37
-31
-10
13
20
2030-2049
RCP8.5
-43
-36
-13
12
19
RCP2.6
-8
-5
6
18
22
mean winter precipitation
RCP4.5
-8
-5
6
17
21
(%) 2030-2049
RCP6.0
-8
-5
5
17
20
RCP8.5
-7
-4
8
21
25
Source: UKCP18-Key-results.xlsx - The UKCP18 datasets are all available under Open Government Licence
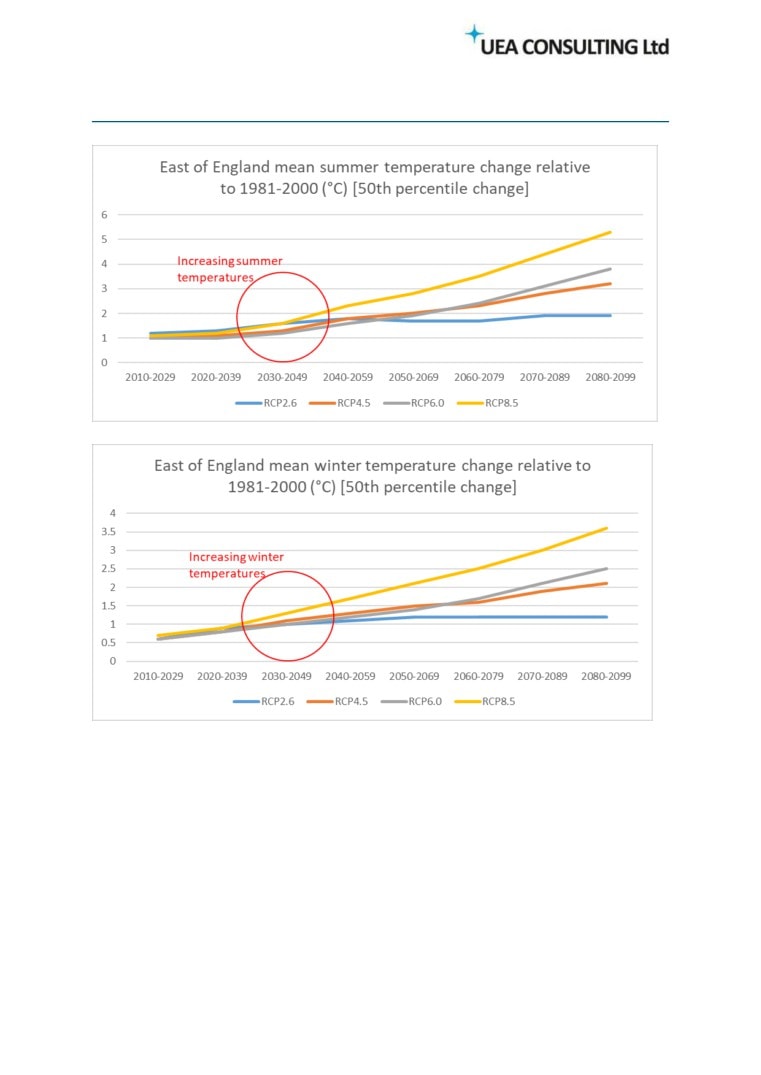
Another feature of Table 3 is that pathways with higher radiative forcing targets for 2100 are not
always associated with larger projected changes in temperature and precipitation for 2040. One
example of this is in the 50th percentile results for mean summer temperature where the projected
changes for RCP2.6 and RCP8.5 are identical and greater than those for RCP4.5 and RCP6.0. This
particular effect is because of a faster decline in aerosols (which have a cooling effect) in RCP2.6 and
a consequent accentuation of warming trends in the next few decades (Chalmers et al., 2012;
Westervelt et al., 2015). However, in the latter half of the 21st Century the influence of increased
C02 concentrations dominates, leading to a clearer association between higher radiative forcing and
greater projected changes in temperature or precipitation. This situation is illustrated for
temperature in Figure 6 and precipitation for Figure 7 using the central (50th percentile) values for
each pathway through to the end of the 21st Century. These graphs provide another perspective on
the projected temperature increases and changes in precipitation for the East of England over this
timescale.
15
33
The Registry
UEA Norwich Research Park
Norwich
NR4 7TJ
Source: UKCP18-Key-results.xlsx - The UKCP18 datasets are all available under Open Government Licence
Figure 6: Projected seasonal temperature changes for the East of England relative to 1981-2010
16
34
The Registry
UEA Norwich Research Park
Norwich
NR4 7TJ
Source: UKCP18-Key-results.xlsx - The UKCP18 datasets are all available under Open Government Licence
Figure 7: Projected seasonal precipitation changes for the East of England relative to 1981-2010
17
35
The Registry
UEA Norwich Research Park
Norwich
NR4 7TJ
1.3 Sea level
It is widely reported that global sea level is rising and will continue to rise over the coming centuries.
Within the UK it is expected that sea level rise will be slightly greater in the south of the country than
the north (Met Office 2018b). Observed sea level trend data is available for Cromer and Felixstowe
from the National Tidal and Sea level facility https://www.ntslf.org/products/sea-level-trend-charts.
UKCP18 includes projections for future sea level rise and storm surges. The study found that
extreme sea levels will increase due to the rise in mean sea level, but found no evidence for
significant changes in future storm surges (Met Office 2018c). However, due to the considerable
year-to-year variability in coastal water levels, one of its key recommendations is that coastal
decision makers should account for this in risk assessments, particularly for shorter-term planning
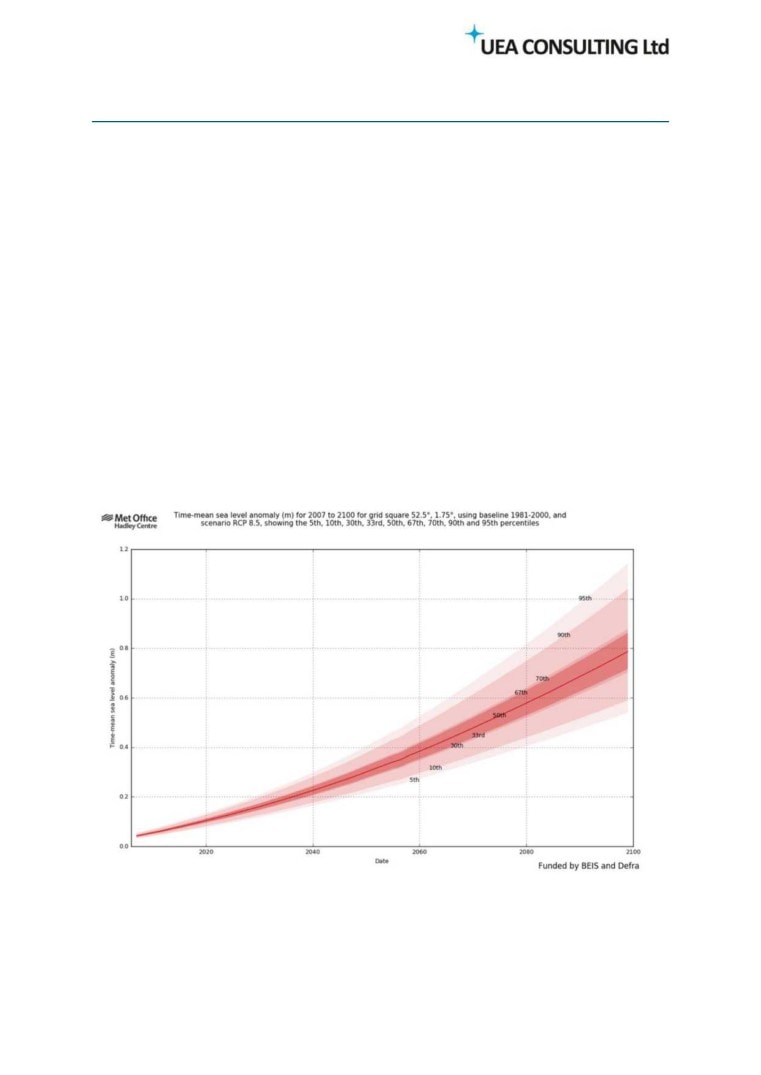
horizons (Met Office 2018c). As with the weather data, sea level rise projections can be
downloaded via the Met Office user interface. Figure 8 shows sea level rise projections from 2007 -
2100 relative to a 1981-2000 baseline, under the RCP8.5 scenario, for a grid-reference
approximating to Great Yarmouth. Noting that RCP8.5 is the most extreme scenario, the plotted
data show a 0.2 - 0.4m mean sea level rise by the middle of the century and potentially 0.6 to over 1
metre by the end of the century.
Figure 8: Local sea level rise projections 2007 - 2100 relative to 1981-2000 baseline under the
RCP8.5 scenario for a grid-reference approximate to Great Yarmouth
18
36
The Registry
UEA Norwich Research Park
Norwich
NR4 7TJ
Zsamboky et al. (2011) identify the following combined risks from sea level rise and climate changes
for the East Anglian coastline:
• Weakening and collapse of cliffs due to desiccation as a result of higher summer temperatures
and lower precipitation; also cliff destabilisation as a result of decreasing vegetation cover.
• Weakening and collapse of cliffs due to increased precipitation in winter, which causes more
water to penetrate into desiccated cracks.
• Higher rates of coastal erosion from higher sea levels, more frequent storm surges and
weakened cliffs.
• High erosion contributing to enhanced rates of longshore drift which may pose threats to the
major ports of Great Yarmouth, Felixstowe and Harwich.
Overall, the precautionary principle would suggest that coastal businesses and land-owners should
make an evaluation of impacts from sea level rise a consideration in long-term planning and monitor
future research updates on storm surges.
19
37
The Registry
UEA Norwich Research Park
Norwich
NR4 7TJ
Part II. Emissions Data and Projections
Data on UK greenhouse gas emissions are published by the Department for Business, Energy &
greenhouse-gas-emissions-statistics. These include carbon dioxide (CO2) emissions estimates for
local authorities (2005-16) with a breakdown by 14 sectors which can be summarised into the
following key groups - industry/commercial, agriculture, domestic, road transport, diesel railways,
other transport and, ‘land use, land use change and forestry’ (LULUCF) which due to CO2 offset
through carbon sequestration, can be represented in the data by negative emissions values. The
dataset also provides population and per capita CO2 estimates for each local authority area.
Over 2005-2016 the data show that the general trend in UK CO2 emissions was downwards, totalling
522,857 kt CO2 in 2005 and reducing to around 357,470 kt CO2 in 2016. However, while there was a
reduction of approximately 100,000 kt CO2 from industry/commercial sectors and just over 50,000 kt
CO2 from domestic sources in that time period, the decline for transport was less than 10,000 kt CO2.
This meant that the relative contribution from transport sources increased from 26% in 2005 to 36%
in 2016.
Table 4 shows changes in per capita CO2 estimates for the UK, Norfolk, Suffolk and their constituent
local authorities between 2005-16. Norfolk and Suffolk went from having below UK average per
capita CO2 emissions in 2005 to above average in 2016. This was associated with an increase in the
relative importance of road transport sources in the two counties. Contrasts between urban and
rural areas are also evident in the statistics for individual authorities, with declines of around 45%
between 2005 and 2016 in Ipswich and Norwich, compared to a national average of 37% and 32%
for Norfolk and Suffolk as a whole.
Table 4: Changes in per capita CO2 emissions (t/person) in 2005-16
Area
2005
2010
2016
% Decline 2005-16
UK Total
8.7
7.4
5.4
37.1
Norfolk Total
8.4
8.0
5.7
32.2
Suffolk Total
8.2
7.6
5.6
32.1
Breckland
7.7
6.7
5.1
33.0
Broadland
7.9
8.2
6.0
25.0
Great Yarmouth
5.9
5.3
3.8
35.4
King's Lynn and West Norfolk
11.4
12.8
8.0
30.3
North Norfolk
8.7
7.9
6.0
31.3
Norwich
6.9
5.8
3.8
44.3
South Norfolk
9.1
8.1
6.3
29.9
Babergh
8.1
7.4
5.6
29.9
Forest Heath
9.9
8.8
6.8
31.4
Ipswich
5.8
4.8
3.1
46.2
Mid Suffolk
9.4
8.1
6.4
32.1
St Edmundsbury
12.6
13.6
9.3
26.1
Suffolk Coastal
6.8
5.9
4.6
32.5
Waveney
6.7
6.2
4.5
32.0
20
38
The Registry
UEA Norwich Research Park
Norwich
NR4 7TJ
The per capita values for Norfolk and Suffolk in 2016 are slightly higher than that for Lincolnshire
(5.4 t/person), but lower than the average for Cambridgeshire (7.2 t/person). The latter reflects
higher emissions from road transport and a positive contribution from land use change. However, it
is sobering to note that all will need to reduce these figures to no greater than 1.7 tonnes CO2e/year
per capita by 2050 to meet the requirements of the Paris Agreement to keep a global temperature
rise this century well below 2°C above pre-industrial levels and pursue limiting it to 1.5 °C (CCC,
2019a, Table 1).
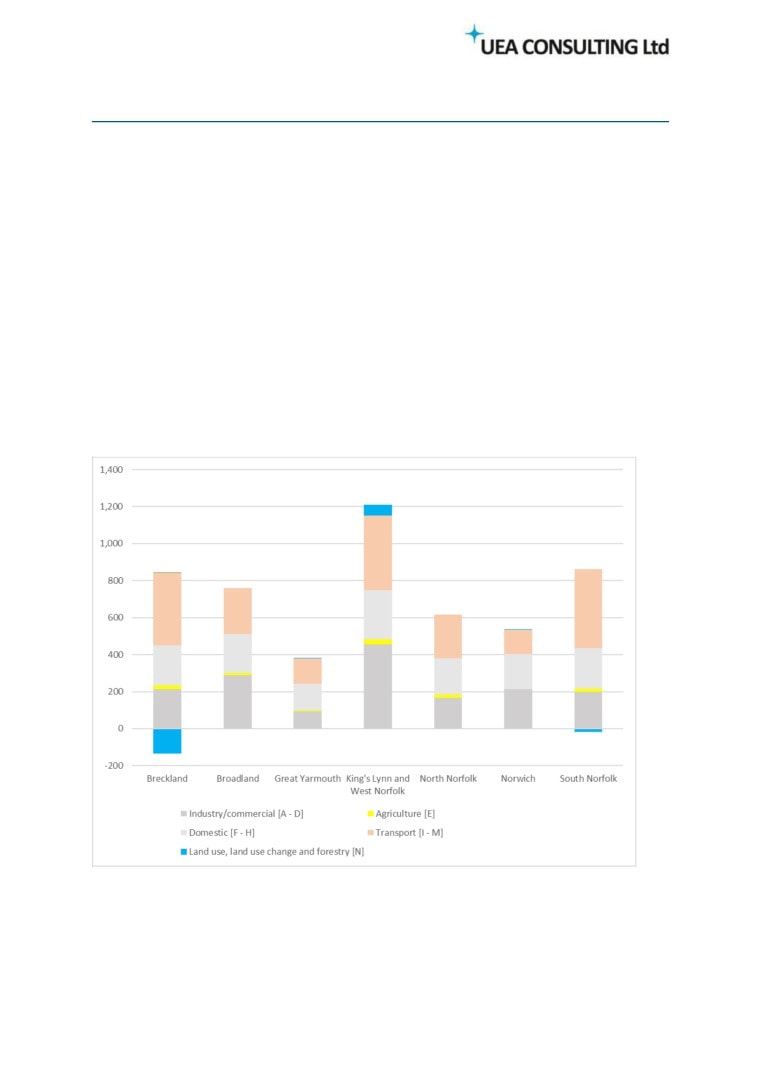
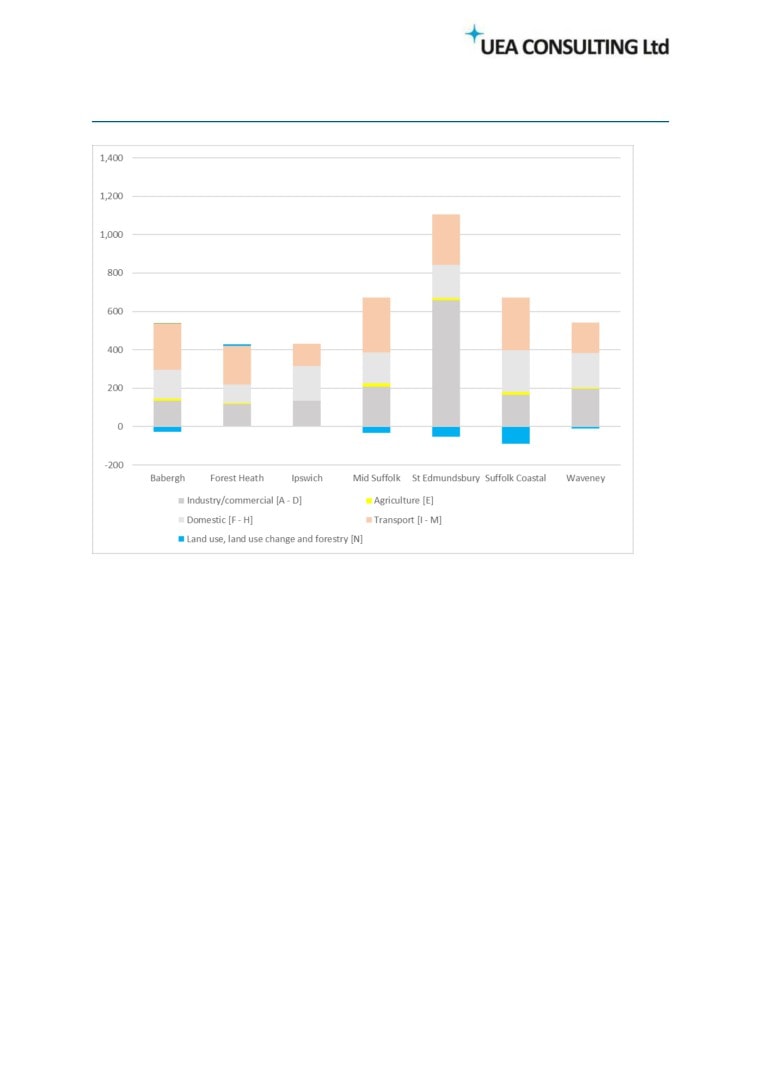
Further insight into the differences between districts can be obtained from Figures 8 and 9 which
show the composition of CO2 emissions by sector groupings for local authorities in Norfolk and
Suffolk. It is apparent that contributions from transport (overwhelmingly road transport) are higher
in more rural districts and that a few authorities (e.g. Kings Lynn and West Norfolk, St Edmundsbury)
have relatively large emissions from industrial or commercial sectors. In many districts the
contributions from land use (LULUCF) are negative, reflecting processes such as carbon
sequestration by forests and woodland.
Figure 8: Emissions estimates (kt CO2) by sector for Norfolk districts, 2016
21
39
The Registry
UEA Norwich Research Park
Norwich
NR4 7TJ
Figure 9: Emissions estimates (kt CO2) by sector for Suffolk districts, 2016
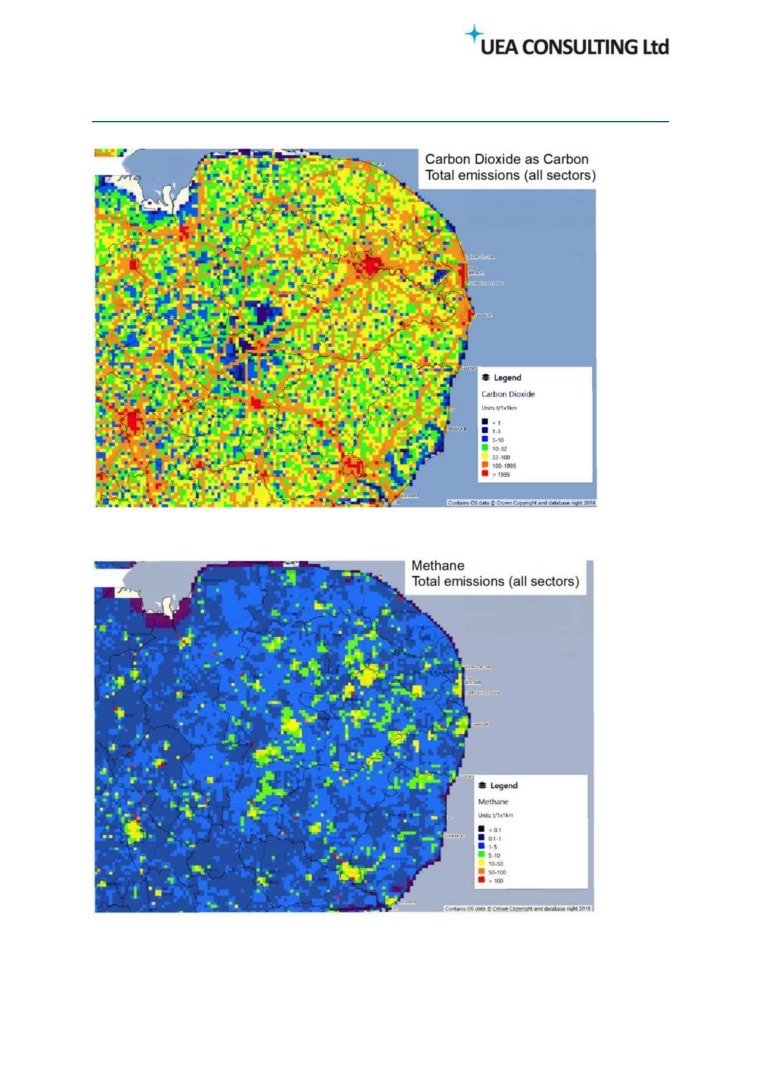
A more geographically detailed perspective on GHG emissions can be obtained from the National
Atmospheric Emissions Inventory (NAEI) (http://naei.beis.gov.uk/data/) which contains both 1 km
grid cell emissions estimates and details of individual ‘point sources’ (i.e. large factories and power
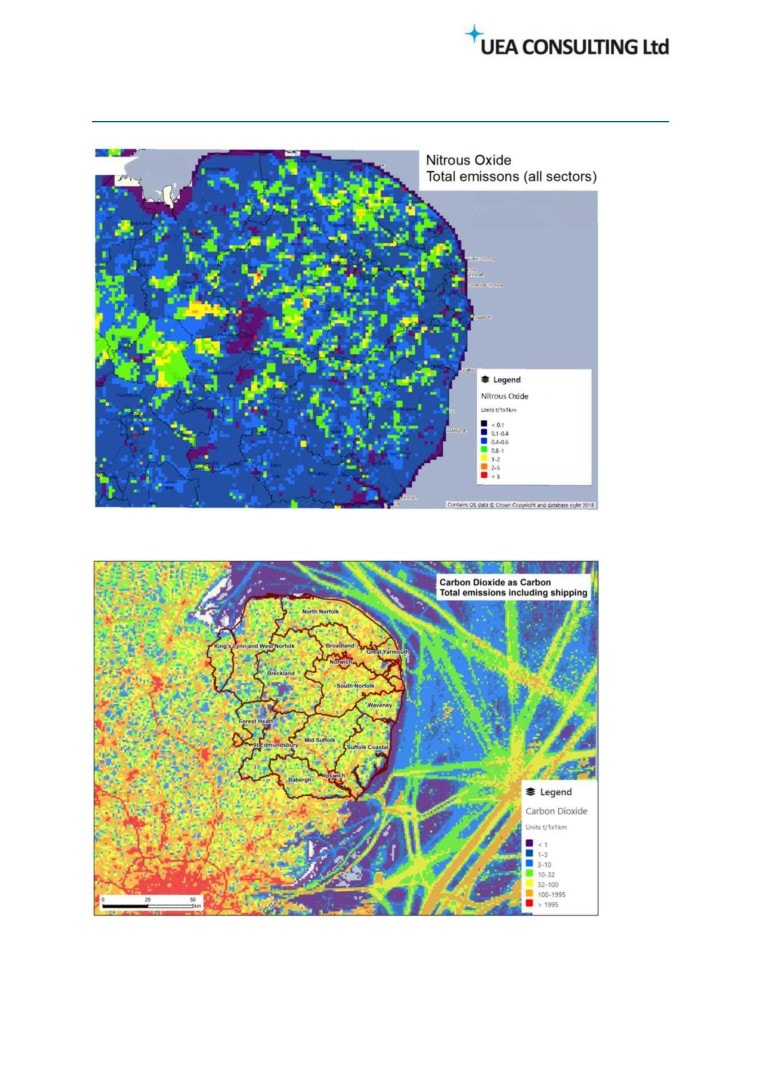
stations). Figures 10 to 12 present 1 km resolution maps for C02, methane (CH4) and nitrous oxide
(N2O) which are the three most important greenhouse gases. The map for CO2 (Figure 10) highlights
urban areas and main roads, whereas for methane and nitrous oxide it is various agricultural and
combustion sources that are more important.
A view of CO2 emissions across a larger geographical region is provided by Figure 13 which includes
shipping sources (excluded from Figure 10) and also extends down to London. The map highlights
that many parts of Norfolk and Suffolk have relatively low CO2 emissions compared to the region
around London, as well as illustrating the extent of carbon emissions associated with shipping routes
and ports such as Felixstowe and Great Yarmouth.
22
40
The Registry
UEA Norwich Research Park
Norwich
NR4 7TJ
Figure 10: Gridded emissions estimates for carbon dioxide (as carbon) in 2016
Figure 11: Gridded emissions estimates for methane in 2016
23
41
The Registry
UEA Norwich Research Park
Norwich
NR4 7TJ
Figure 12: Gridded emissions estimates for nitrous oxide in 2016
Figure 13: Gridded emissions estimates for carbon dioxide as carbon (Including shipping) in 2016
24
42
The Registry
UEA Norwich Research Park
Norwich
NR4 7TJ
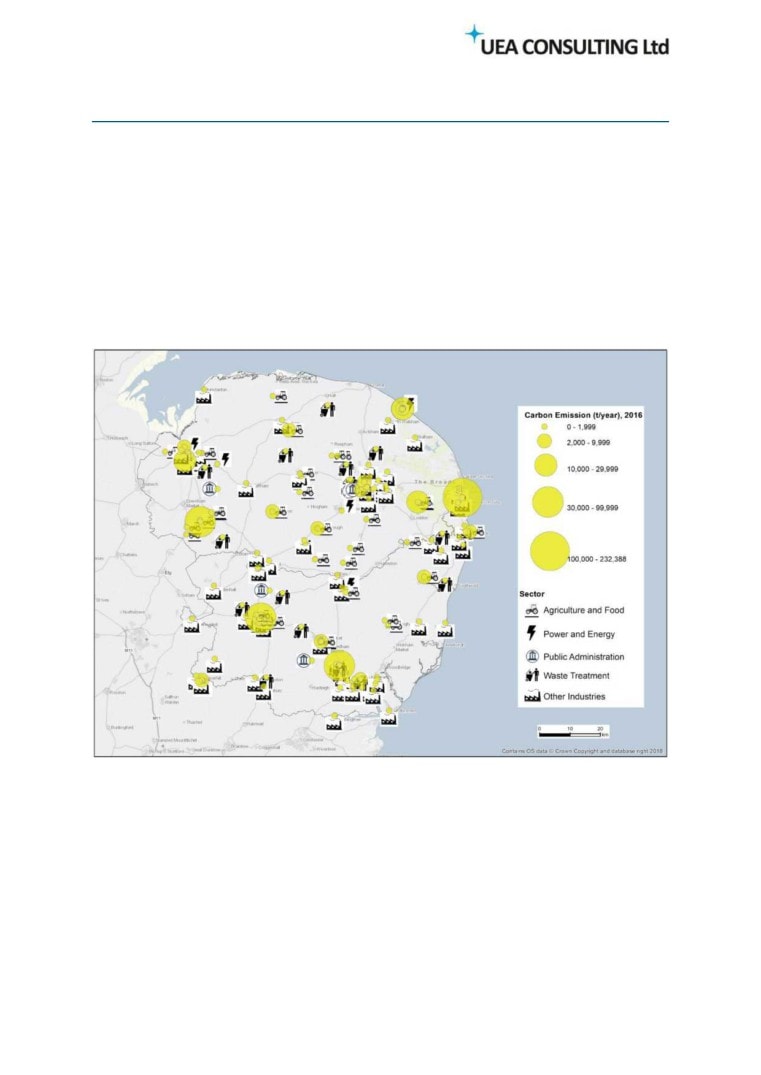
Information on point source emissions of C02 from the National Atmospheric Emissions Inventory is
mapped in Figure 14. Each point is mapped with a circle to represent the amount of emissions and a
symbol to show the sector involved. There are 37 sources in total. The emissions data are reported
as tonnes of carbon rather than CO2 and for the 37 point sources total 568,019 tonnes in 2016.
One tonne of carbon is equal to 3.67 tonnes of C02 (conversion based on atomic weights) so 568,019
tonnes of carbon is equivalent to 2,088,303 tonnes of CO2. The BEIS emission estimates summarised
in Figures 8 and 9 total 9,232,700 tonnes of CO2 for Norfolk and Suffolk in 2016 so the 37 point
sources account for 22.6% of total CO2 emissions.
Figure 14: Major point source emitters of Carbon Dioxide in Norfolk and Suffolk during 2016
25
43
The Registry
UEA Norwich Research Park
Norwich
NR4 7TJ
Table 5 summarises the point source emissions of CO2, methane and nitrous oxide by key economic
sectors. Their total emissions (given in tonnes in the original NAEI data) have been converted to CO2
equivalents (CO2e) to aid interpretation.
Table 5: Point source greenhouse gas emissions in Norfolk and Suffolk in 2016
CH4 as
Nitrous
N20 as
Carbon
Methane
CO2e
Oxide
CO2e
Emissions
CO2
Emissions
Emission
Emissions
Emission
Sector
(tonnes)
Emissions
%
(tonnes)
s
%
(tonnes)
s
%
Agriculture
3,309
12,144
1%
0.2
5.3
0%
0.0
6.4
0%
Food processing
201,853
740,800
36%
24.2
605.8
1%
3.2
946.5
7%
99
Energy
303,248
1,112,919
53%
2,348.1
58,702.5
41.5
12,371.8
92%
%
Others
59,610
218,768
10%
6.2
155.0
0%
0.4
126.7
1%
Total
568,019
2,084,632
2,379
59,469
45
13,451
These results indicate that power/energy producers (gas and biomass) are the largest point source
emitters of all three greenhouse gases. However, there is a significant contribution from food and
drink producers so businesses in these and other food producing industries would be an appropriate
focus for initiatives to reduce their carbon footprints.
26
44
The Registry
UEA Norwich Research Park
Norwich
NR4 7TJ
Part III. Developing a Climate Change Adaptation and Carbon Reduction Action Plan
Assisting businesses with identifying potential climate change impacts that might affect their
operation or profitability, helping them examine their own contribution to climate change and how
they can mitigate this, and supporting them to plan for and adapt to climate change is an important
part of the overall response that society needs to make to meet the challenges ahead. Although
there is now widespread agreement that action on climate change is urgent and necessary, there
may also be a task in convincing some organisations of the need for self-reflection and change in the
face of more short-term pressures.
There is an extensive literature on such issues. At the national level, the Committee on Climate
Change’s UK Climate Change Risk Assessments (CCRA), undertaken 5-yearly, provide a useful
overview of potential risks to businesses from climate change4. Table 6 reproduces findings from the
latest report (Adaptation Sub-Committee (ASC), 2016) summarising the risks/opportunities to
businesses in England along with an urgency score for action needed by government to support the
business sector.
Table 6: Actions need to support business identified in the 2nd UK Climate Change Risk Assessment
Risk/Opportunity
Urgency Score
Rationale for Scoring
More effort needed in England to address flood risks and
Bu1: Risks to business sites from
More action
inform businesses of their current and future exposure
flooding
needed
and what steps they might take to limit impacts.
Bu2: Risks to business from loss of
More research needed on costs and benefits of
Research priority
coastal locations and infrastructure
adaptation options for different coastal areas.
Bu3: Risks to business operations
Sustain current
Sustain current actions to create more flexible regimes
from water scarcity.
action
and promote water efficiency among businesses
Monitor and research action by regulators, banks and
Bu4: Risks to business from reduced
Watching brief
insurance firms, and information disclosures by UK
access to capital
companies
Bu5: Risks to business from reduced
More research needed on disruption to ICT, power and
employee productivity, due to
transport infrastructure which prevents workers accessing
infrastructure disruption and higher
Research priority
premises or working remotely, and on impacts of higher
temperatures in working
temperatures on employee safety and productivity
environments
Bu6: Risks to business from
Sustain and monitor the uptake of existing guidance
disruption to supply chains and
Sustain current
which helps businesses improve the resilience of supply
distribution networks. (Also
action
chains and distribution networks, particularly at the
international risks)
international level
Bu7: Risks and opportunities for
Monitor sales of adaptation goods and services within the
business from changes in demand for
Watching brief
UK and by UK companies
goods and services
Source: Adapted from ASC (2016) Table SR.A.4: Urgency of additional actions to support business
4 An excellent review of both the CCRA work and overall status of the knowledge base relating to climate
change risk to businesses is provided by Surminski et al. (2018)
27
45
The Registry
UEA Norwich Research Park
Norwich
NR4 7TJ
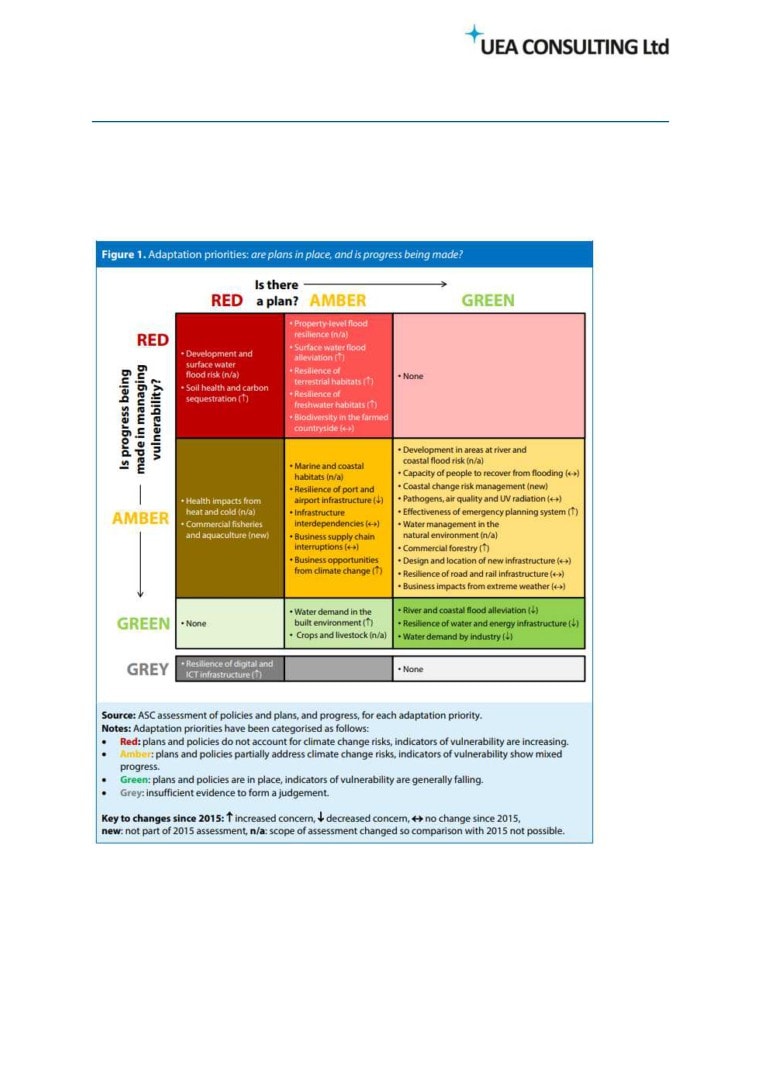
The UK National Adaptation Programme is informed by the priorities identified by the CCRA. Figure
15 provides a graphical overview of the current state of the UK National Adaptation Programme as
presented in a recent update report (CCC, 2017) and in the 2nd UK National Adaptation Programme
report (DEFRA, 2018). It also incorporates the actions identified in Table 6.
Figure 15: Status of the UK National Adaptation Programme (CCC, 2017)
The matrix in Figure 15 classifies different adaptation priorities according to whether plans or
policies are in place and whether progress is being made in managing vulnerability. Issues classified
as green on both dimensions are those where there is generally reduced concern (e.g. resilience of
28
46
The Registry
UEA Norwich Research Park
Norwich
NR4 7TJ
water and energy infrastructure) while those rated as red (e.g. soil health and carbon sequestration)
are particular priorities.
A summary of climate change risks for the East of England was published by Sustainability East
(2012) in response to the first CCRA. This reflected the national findings, stating that the
“... main climate challenges to businesses include flooding and coastal erosion, increased competition
for water, and disruption of transport and communication links... The degree to which individual
organisations are affected depends upon their level of vulnerability and adaptive capacity... There
are potentially significant advantages to be gained for those businesses taking on the challenge.”
(p.8).
3.1 Downscaling to Norfolk and Suffolk and individual businesses
Whilst governments need to understand the risks and opportunities from climate change at a broad-
scale across business and industry sectors, individual businesses may need to evaluate these at a
site-specific scale or across their entire value chain of activity (i.e. impacts on suppliers through to
operational factors and changes in customer behaviour, both domestic and international).
As a consequence, the impacts of climate change can be both indirect (as above) or direct (e.g. if a
business has to close or relocate due to flooding). Some sectors (e.g. ICT) may adapt by shifting
location, others will need to adapt in-situ (i.e. agriculture). The latest CCRA also highlights certain
sectors where the effect of climate variability is likely to be more pronounced in terms of risks and
opportunities e.g. tourism, insurance and finance, agriculture, food, utilities, engineering and
consultancy (as reported in Surminski et al., 2018).
For large companies there may be legal requirements or voluntary decisions to undertake risk
assessments and reporting (e.g. through corporate social responsibility reports or participations in
initiatives such as the Carbon Disclosure Project or Task Force on Climate-related Financial
Disclosures, Surminski et al., 2018). However, it is unclear how many smaller businesses have
considered climate change in their forward planning and, even if they have, much of this information
will not be in the public domain.
An initial scoping of potential considerations in relation to three key sectors of the economy in
Norfolk and Suffolk (energy; digital/ICT; agriculture, food and drink) is presented in Table 7. In
relation to agriculture, a recent PostNote on climate change and agriculture (Houses of Parliament,
2019) identified this sector as both one of the most vulnerable to climate change (with implications
for food security) as well as being the fourth highest GHG emitting sector globally.
For agriculture, in particular, there is a considerable body of literature relating to adaptation and
decarbonisation that is too large to summarise here (the PostNote mentioned in the previous
paragraph alone cites 126 research articles). The IPCC has published widely on the subject and most
recently has called for ‘rapid and far-reaching’ transitions in both agriculture and dietary change to
achieve the 1.5°C target of the Paris Agreement (IPCC, 2018). This is likely to lead to new initiatives
29
47
The Registry
UEA Norwich Research Park
Norwich
NR4 7TJ
and opportunities for farming businesses as part of the planned reform of agricultural policies.
However, many of the potential risks (e.g. flooding, restrictions in water availability, loss of
productivity through overheating, increased energy demand for cooling, sea level rise etc.) are cross-
sectoral and simply scoping out or summarising the literature will add little to understanding local
business vulnerability and needs.
Table 7: Potential adaptation and decarbonisation considerations for key economic sectors
Sector and Climate
Change Pressures
Adaptation Considerations
Decarbonisation Considerations
Energy
How ‘resilient’ are these
Opportunities for increased
Infrastructure constraints? (e.g.
industries to climate change?
renewable energy generation as
limiting ability to connect new
fossil fuels are displaced.
renewables to the grid)
e.g. nuclear and offshore wind
to sea level rise?
Policy changes (e.g.
‘renationalising’ the national grid -
would this speed up or slow down
decarbonisation?)
Carbon capture and storage? How
soon will this be feasible?
Digital Creative and ICT
Less ‘location’ sensitive than
Growth in digital devices =
some other sectors
increasing proportion of
domestic/business energy use (up
to 20% of electricity demand by
2050 cited by some studies). Life-
cycle analysis needed for ‘smart
technologies’.
Agriculture, Food and Drink
High location dependence -
How closely tied are food processing
Will societal changes (e.g. in dietary
need for adaptation.
businesses to local agricultural
preferences) affect these
producers? Will this relationship
businesses?
Vulnerable to reduced water
adapt or decouple?
availability (e.g. for irrigation)
Opportunities for increased carbon
Potential for shift in crop types
sequestration through changes in
bringing opportunities and
crop cultivation practices, more
challenges (capital costs and risks in
afforestation or bioenergy.
changing farming practices)
Instead, at the individual business level there may be a need for simplified tools or guides that
businesses can use to work through issues relevant to their activities and identify appropriate
actions and responses for themselves. As an example, a ‘business function’ risk assessment tool,
developed by UKCIP (2013), evaluates business risk in the following six areas:
30
48
The Registry
UEA Norwich Research Park
Norwich
NR4 7TJ
• Products and services
• Employee and labour productivity
• Site location
• Distribution (output)
• Supply chain (input)
• Access to capital
3.2 Elements of an Action Plan for Norfolk and Suffolk
Based on the material discussed in previous sections the following are identified as key issues in
particular sectors that need attention in a climate change adaptation and carbon reduction action
plan for Norfolk and Suffolk.
1) The Domestic Sector - There will be a need to adapt the existing building stock to provide
suitable conditions for people to live and work in a warmer climate. This will be important for
business productivity and also represents an opportunity for local construction businesses.
There is an additional consideration in rural parts of Norfolk and Suffolk that many households
are not connected to the national gas grid. Across England, 13% of households were not
connected to the gas grid in 2016, but the proportion for Norfolk and Suffolk was 30% and there
were five local authorities (Breckland, King’s Lynn and West Norfolk, North Norfolk, South
Norfolk and Mid Suffolk) where the share was above 40% (BEIS, 2018). This is important
because it increases current reliance on oil for heating and means that the future option of
supplying hydrogen through the gas grid is not available. There is consequently a need for
initiatives to test and evaluate alternative means of heating provision, both to meet
decarbonisation targets and reduce reliance on oil.
2) The Transport Sector - Decarbonising transport will need to be a major feature of climate
change mitigation policies in the next 30 years. Increased use of public transport and electric
vehicles will be a central element of such initiatives and will require greater investment in
charging infrastructure. At present, many parts of Norfolk and Suffolk have little provision of
public charging points (see Local Energy East, 2018, Figure 9) and addressing such gaps will be
important in maintaining economic activities alongside transport decarbonisation.
3) The Agricultural Sector - Agriculture faces both risks and opportunities from climate change.
The threats include more variable weather conditions that impact crop and livestock
production and pressures on water resources. Improved water management needs to be a
priority for coming decades, both in terms of increased storage capacity and greater use
efficiency (e.g. through investment in reservoirs and transfer schemes).
31
49
The Registry
UEA Norwich Research Park
Norwich
NR4 7TJ
Opportunities for agriculture include the potential to contribute to carbon sequestration
through changes in cultivation practices and improved soil management. These could be
supported as ‘public goods’ in future agri-environmental schemes. A warmer climate may also
offer scope to grow new crops or introduce other enterprises. For instance, Norfolk and Suffolk
have been identified as counties with considerable potential for vineyards (Nesbitt et al., 2018)
and there is likely to be increased demand for local renewable generation of heat and power
(e.g. through anaerobic digestion or other forms of bioenergy).
4) The Food Processing Sector - There are a number of processing plants that make a substantial
contribution to regional GHG emissions. It would be an important step towards meeting
decarbonisation objectives if these businesses could be supported to lower the carbon
footprints of their production processes.
5) The Energy Sector - The East of England is already one of the leading regions of England in
terms of the generation of renewable energy (Local Energy East, 2018) and this will need to
further increase in coming decades to meet a growing demand for electricity, particularly from
domestic and transport sectors. At present, however, there are constraints on the capacity of
the electricity transmission and distribution network in many parts of Norfolk and Suffolk (see
Local Energy East, 2018, Figure 6) and developing an investment strategy to rectify this
situation is fundamental to both meeting decarbonisation objectives and well as supporting
future economic growth. It is also worth noting that the existing high-voltage (400 kV)
transmission network does not extend into northern and eastern Norfolk, as well as north-east
Suffolk (see Local Energy East, 2018, Figure 2). If investment was made into extend the
network to the coast in this region (e.g. to Great Yarmouth or Bacton) it would have
appreciable benefits for the marine renewable industry, as well as supporting associated
onshore activities.
The above discussion of priorities has been structured around individual sectors, but it is important
to recognise that there are many interactions between them. It is, for instance, increasingly
common to refer to a food-energy-water nexus (e.g. Simpson and Jewitt, 2019) and meeting future
decarbonisation objectives is likely to be as much a matter of achieving coordination between
sectors as initiatives within them. Other requirements for any action plan, such as raising
awareness, disseminating information and promoting the resilience of critical infrastructure are also
cross-sectoral and emphasise that addressing the challenges of climate change will require action
across society and by many different organisations in Norfolk and Suffolk.
32
50
The Registry
UEA Norwich Research Park
Norwich
NR4 7TJ
References
Adaptation Sub-Committee (ASC) (2016) UK Climate Change Risk Assessment 2017 Synthesis Report:
Priorities for the next Five Years. Adaptation Sub-Committee of the Committee on Climate Change,
Synthesis-Report-Committee-on-Climate-Change.pdf.
BEIS (2018) Sub-National Estimates of Households not Connected to the Gas Network 2012-2016.
Available at https://www.gov.uk/government/collections/sub-national-gas-consumption-data.
Chalmers C, Highwood EJ, Hawkins E, Sutton R, Wilcox LJ (2012) Aerosol contribution to the rapid
warming of near-term climate under RCP 2.6. Geophysical Research Letters 39, L18709,
doi:10.1029/2012GL052848, 2012
CCC (2017) Progress in Preparing for Climate Change 2017. Report to Parliament Committee on
Climate Change. June 2017. Adaptation Sub-Committee of the Committee on Climate Change,
London.
CCC (2019a) Net Zero: The UK’s Contribution to Stopping Global Warming. Committee on Climate
CCC (2019b) Net Zero Technical report. Committee on Climate Change. May 2019. Available at
DEFRA (2018) The National Adaptation Programme and the Third Strategy for Climate Adaptation
Reporting: Making the country resilient to a changing climate. July 2018. DEFRA. Available at
Fung, F et al. (2019) UKCP18 National Climate Projections. Presentation at CIWEM Conference on
Climate Resilience and Extreme Incidents, April 2019. Available at
f.
HM Government (2019) Government gives details on setting a UK net zero emissions target.
setting-a-uk-net-zero-emissions-target/.
Houses of Parliament (2019) Climate Change and Agriculture. PostNote Number 600, May 2019.
London: Houses of Parliament, Parliamentary Office of Science and Technology. Available at
https://researchbriefings.parliament.uk/ResearchBriefing/Summary/POST-PN-0600.
IPCC (2018) Summary for Policymakers. In: Global Warming of 1.5°C. An IPCC Special Report on the
Impacts of Global Warming of 1.5°C above Pre-Industrial Levels and Related Global Greenhouse Gas
33
51
The Registry
UEA Norwich Research Park
Norwich
NR4 7TJ
Emission Pathways, in the Context of Strengthening the Global Response to the Threat of Climate
Change, Sustainable Development, and Efforts to Eradicate Poverty (Masson-Delmotte V et al., eds).
Kendon M, McCarthy M, Jevrejeva S, Matthews A, Legg T (2018) State of the UK climate 2017.
International Journal of Climatology 38, Issue S2 pp 1-35, DOI: 10.1002/joc.5798.
Local Energy East (2018) Local Energy East Strategy: An Energy Strategy for the Tri-LEP Area.
Met Office (2018a) State of the UK Climate 2017: Supplementary report on Climate Extremes. Met
Office, National Climate Information Centre. Available at
climate/soc_supplement-002.pdf.
Met Office (2018b) UKCP18 Marine Report. Met Office, National Climate Information Centre.
Available at https://ukclimateprojections.metoffice.gov.uk.
Met Office (2018c) UKCP18 Factsheet: Sea Level Rise and Storm Surge. Met Office, National Climate
Information Centre. Available at
Met Office (2019) UKCP18 Science Overview Report. November 2018 (updated March 2019). Met
Office, National Climate Information Centre. Available at
Nesbitt A, Dorling S, Lovett A (2018) A suitability model for viticulture in England and Wales:
opportunities for investment, sector growth and increased climate resilience. Journal of Land Use
Science 13:4, 414-438, DOI: 10.1080/1747423X.2018.1537312
Simpson GB, Jewitt GPW (2019) The development of the water-energy-food nexus as a framework
for achieving resource security: a review. Frontiers in Environmental Science 7:8. doi:
10.3389/fenvs.2019.00008.
Surminski S, Di Mauro M, Baglee JAR, Connell RK, Hankinson J, Haworth AR, Ingirige B, Proverbs D
(2018) Assessing climate risks across different businesses and industries: an investigation of
methodological challenges at national scale for the UK. Philosophical Transactions of the Royal
Society A: Mathematical, Physical and Engineering Sciences, 376 (2121). DOI:
10.1098/rsta.2017.0307
Sustainability East (2012) A Summary of Climate Change Risks for the East of England: To coincide
with the publication of the UK Climate Change Risk Assessment (CCRA) 2012. Commissioned by the
Department for Environment, Food and Rural Affairs (Defra) to coincide with the publication of the
34
52
The Registry
UEA Norwich Research Park
Norwich
NR4 7TJ
UKCIP (2013) BACLIAT (business areas climate assessment tool) vulnerability assessment. UKCIP
Environmental Change Institute, University of Oxford. Available at
Westervelt DM, Horowitz LW, Naik V, Golaz J-C, Mauzerall DL (2015) Radiative forcing and climate
response to projected 21st century aerosol decreases. Atmospheric Chemistry and Physics 15:
12681-12703.
Zsamboky M, Fernández-Bilbao A, Smith D, Knight J , Allan J (2011) Impacts of Climate Change on
Disadvantaged UK Coastal Communities. The Joseph Rowntree Foundation. Available at:
35
53
New Anglia Transport Board
Tuesday 25th February 2020
Agenda Item 10
Terms of reference review
Author: Ellen Goodwin
Summary
This paper looks to review the terms of reference of the Board in line with the agreement least year to do so
on an annual basis.
Recommendation
The Board are asked to:
consider the Board’s purpose, aims and objectives;
approve the revised terms of reference for the Board; and
consider how the Board will monitor progress against the identified aims and objectives.
Background
The previously agreed terms of reference have been amended to reflect new membership and the LEP
ambitions regarding clean growth. They are attached at Appendix A for the Board’s consideration.
This paper seeks comments from the Board on the proposed purpose:
The New Anglia Transport Board will ensure current & future transport networks meet the needs of
both businesses and residents in order to support clean and inclusive growth.
It also seeks comments on the objectives and expected outcomes:
Objectives:
The New Anglia Transport Board will provide strategic direction on transport issues by:
Acting as a forum for information and expertise sharing, discussion and debate
Acting as a powerful advocate for Norfolk and Suffolk on behalf of the New Anglia LEP
Maintaining, executing and monitoring the Integrated Transport Strategy Delivery Plan,
reporting to the Economic Strategy Co-ordinating Delivery Board
Directing the formation and work programmes of Task and Finish Groups to tackle specific
topics
Producing and executing a stakeholder management plan
Producing a high-level work programme summarising individual scheme progress
Offering recommendations for prioritisation of projects for delivery and subsequent
monitoring of outcomes
Expected outcomes:
A reliable, resilient and integrated transport network with improved capacity and journey
times, providing good connectivity both within and around New Anglia, and to other UK,
European and worldwide destinations
A Delivery Plan for the Integrated Transport Strategy for Norfolk and Suffolk, current and
valued by transport bodies
Central government understanding of the transport infrastructure needs and priorities of
55
Norfolk and Suffolk businesses and residents to support inward investment and growth
Finally, this paper seeks the Board’s view on how they wish to monitor progress against their agreed
aims and objectives.
Link to the Integrated Transport Strategy
The New Anglia Transport Board will provide a strong voice for Norfolk and Suffolk to ensure that
the best is secured for the area. It will also help to deliver the ambitious objectives set out in the
Norfolk and Suffolk Economic Strategy, the Local Industrial Strategy and the Integrated Transport Strategy
for Norfolk and Suffolk.
Recommendation
The Board are asked to:
consider the Board’s purpose, aims and objectives;
approve the revised terms of reference for the Board; and
consider how the Board will monitor progress against the identified aims and objectives.
Appendix A - terms of reference (2020)
56
New Anglia Transport Board - Terms of Reference
Introduction
New Anglia LEP is the Local Enterprise Partnership covering the geographical area of Norfolk and
Suffolk.
New Anglia LEP has ambitious plans for driving business growth and productivity in our diverse
economy, for communicating our offer to the world and for driving inclusion and skills. Norfolk and
Suffolk are leading places in the competitive global economy, with a large number of world leading
competitive clusters already based here. In addition Norfolk and Suffolk is positioned as UK’s clean
growth region, the golden thread of our recently endorsed Local Industrial Strategy.
A modern and efficient transport system is key to our future success. A mobile and accessible world-
class economy will ensure that Norfolk and Suffolk retains this enviable position and will benefit
thousands of businesses of all sizes and open significant opportunities in our extensive supply chain
network.
The New Anglia Transport Board will provide a strong voice to ensure that we can secure the best for
the area and deliver the ambitious objectives set out in the Norfolk and Suffolk Economic Strategy, the
Local Industrial Strategy and the Integrated Transport Strategy for Norfolk and Suffolk.
Purpose
The New Anglia Transport Board will ensure current & future transport networks meet the needs of
both businesses and residents in order to support clean and inclusive economic development &
growth.
The New Anglia Transport Board brings together key transport specialists, pooling transport expertise
across the region to help shape the future transport system. It will:
Understand partners’ transport ambitions
Ensure the transport network satisfies the needs of business and residents both now and in the
future
Assess how New Anglia LEP and partners can best deliver the Integrated Transport Strategy
for Norfolk and Suffolk
Specific Activities/Objectives
The New Anglia Transport Board will provide strategic direction on transport issues by:
Acting as a forum for information and expertise sharing, discussion and debate
Acting as a powerful advocate for Norfolk and Suffolk on behalf of the New Anglia LEP
Maintaining, executing and monitoring the Integrated Transport Strategy Delivery Plan, reporting to
the Economic Strategy Co-ordinating Delivery Board
Directing the formation and work programmes of Task and Finish Groups to tackle specific topics
Producing and executing a stakeholder management plan
Producing a high-level work programme summarising individual scheme progress
Offering recommendations for prioritisation of projects for delivery and subsequent monitoring
of outcomes
Expected outcomes
A reliable, resilient and integrated transport network with improved capacity and journey times,
providing good connectivity both within and around Norfolk and Suffolk, and to other UK,
European and worldwide destinations
57
A Delivery Plan for the Integrated Transport Strategy for Norfolk and Suffolk, current and valued
by transport bodies
Central government understanding of the transport infrastructure needs and priorities of Norfolk
and Suffolk businesses and residents to support inward investment and growth
Powers
The role of the Board is an advisory one, bringing expertise and transport knowledge. It will feed into
the Investment and Appraisal Committee to enable them to devise, deliver and manage the relevant
programmes.
Composition of the Transport Board (Membership)
ABP
CBI, East of England
Connected Places Catapult
Country Land Owners and Business Association
Department for Transport
East Midlands Trains
Federation of Small Businesses
First Group
Govia Thameslink Railway
Greater Anglia
Highways England
Hutchison Ports
Ipswich Buses
Liftshare
Network Rail
New Anglia LEP
Norfolk Chamber of Commerce
Norfolk County Council
Norfolk district representative
Norwich Airport
Peel Ports
Stansted Airport
Suffolk Chamber of Commerce
Suffolk County Council
Suffolk district representative
Sustrans
Format and Frequency of Meetings
Meetings will be generally be open to the public
Meetings will take place quarterly and will take place ahead of Transport East Forums. Venues
will alternate between Ipswich and Norwich
Format of meetings - Chaired by New Anglia LEP
58
Meetings are formally minuted, with agenda, papers and minutes to be published via the New
Anglia LEP website
Secretariat - New Anglia LEP will supply secretarial services, and meeting support in terms of
accommodation will be hosted/facilitated by Norfolk and Suffolk County Councils
Papers to be circulated one week prior to Board meetings
The Board will work together by consensus
59
New Anglia Transport Board
Tuesday 25th February 2020
Agenda Item 11
Transport Board Forward Plan 2020
Author: Ellen Goodwin
Summary
This paper seeks the Board’s input on the 2020 Forward Plan for the Transport Board with the view
of successfully delivering the Integrated Transport Strategy.
Recommendation
The Board:
offers suggested input to the Transport Board Forward Plan 2020
Background
The Integrated Transport Strategy, adopted by the LEP Board in May 2018 has the following themes:
Connecting the East, Accessing the World: Quicker, more reliable and resilient strategic
connections to boost our contribution to UK plc., encouraging improved perceptions, economic
participation and inward investment for our key sectors and competitive clusters.
Agile to Change: Embracing new technologies and digital connectivity to enable remote access
to services and opportunities to facilitate Mobility as a Service (MaaS).
Regional Connectivity and Our Priority Places: Keeping people and products moving in and
around our growing Priority Places and Enterprise Zones through new investment,
placemaking, maintenance and an integrated public transport network with opportunities for
walking and cycling.
Local and Coastal: Innovative on-demand transport solutions and improvements to facilitate local
sustainable growth, walking and cycling, recognising local distinctiveness, and offering access to
services and opportunities through digital means.
Appendix A outlines a draft forward plan for the Board’s input. The Board are asked to consider what
items it would like to consider during the next year.
Link to the Integrated Transport Strategy
Outlined above.
Recommendation
The Board:
offers suggested input to the Transport Board Forward Plan 2020
Appendix A - Transport Board Forward Plan 2020
61
Appendix A
New Anglia Transport Board Forward Plan
Date
Venue and Theme
Forward Looking
Governance & Delivery
19 November 2019
County Hall, Norfolk
Ports and airports
Transport East update
RIS2
ITS delivery including Growth Deal
Connecting the East,
Rail
Accessing the World
BREXIT
Maritime Cluster development
25 February 2020
Ipswich Town Hall, Suffolk
Clean growth and resilience - what’s our role?
Review terms of reference
Innovation in transport
Transport East update
Agile to Change
Ely area road/rail improvement
ITS delivery
2 June 2020
County Hall, Norfolk
New crossings
Transport East update - Major Road Network
Integrated ticketing/public transport
ITS delivery including Growth Deal
Regional Connectivity and Our
Future funding opportunities - tbc
Engagement with Transport East
Priority Places
25 August 2020
Endeavour House, Suffolk
Ports and airports
Transport East update
Strategic Road Network
ITS delivery
Connecting the East,
Strategic rail
Accessing the World
Winter 2020 - tbd
Norfolk
Mobility as a Service
Transport East update
Electric vehicles
ITS delivery including Growth Deal
Agile to Change
Use of data
62