Ports & Logistics
Data Pack
Version 3 09.03.2018
CONFIDENTIAL
Contents
Page
-
Introduction to the Sector Data Pack
3
-
Introduction to and Definition of the Ports & Logistics Sector
3
-
The Ports & Logistics Sector in New Anglia
o Overview
5
o Employment
7
o Enterprises
22
-
Ports & Logistics Sector Skills Supply and Demand
o Qualifications
30
o UKCES Employer Skills Survey sector analysis
32
▪ Vacancies
33
▪ Skills Gaps
34
▪ Training
35
▪ Staff
37
o Further Education Learning Aims analysis
38
o Apprenticeships
45
o Labour Insight Jobs tool sector analysis
48
o
‘Where the Work is’ tool sector analysis
55
-
A Future View of the Ports & Logistics Sector
60
-
Appendix - Ports & Logistics Sector Definition
68
2
Introduction to the Sector Data Pack
The role of the Sector Data Pack is to bring together the latest socio-economic and labour market data and present both an up-to-date, and
future view, of the sector and any underlying issues within the area that could impact upon it. Data is presented in a navigable format without
comment with interpretation at this stage left to the reader
The Data Pack informs the Sector Evidence Report, the key findings from which help to inform the priorities developed in the Sector Skills Plan.
The Sector Evidence Report is also summarised within the Sector Skills Plan and appears in full in the its appendices.
In most instances data has been analysed and presented down to local authority level. In some instances, and even where local authority data
is available, it has not been presented in the data pack due to issues of unreliability and small sample sizes. This is particularly the case with
data from the Annual Population Survey and the Annual Survey of Hours and Earnings.
Introduction to and Definition of the Ports & Logistics Sector
3
The Ports & Logistics
Sector in New Anglia
4
Ports & Logistics sector contribution to the
local economy
4,085
£2.33bn
6.7%
6.5%
48,700
6.2%
GVA
Employment
Enterprises
Source: New Anglia LEP Economic Strategy evidence base work
5
Ports & Logistics sector contribution to growth in the
local economy (2010=100)
140
130
120
110
100
90
2010
2011
2012
2013
2014
2015
2016
Transport & Logistics GVA
Transport & Logistics Employment
Transport & Logistics Enterprises
Total GVA
Total Employment
Total Enterprises
Source: New Anglia LEP Economic Strategy evidence base work
6
Employment
Employment provided by the Ports & Logistics sector
across comparator areas, 2015
New Anglia
45,000
Norfolk
18,900
Suffolk
26,000
Greater Lincolnshire LEP
32,000
Humber LEP
28,000
Solent LEP
39,000
South East LEP
103,800
East of England
166,100
Source: Business Register and Employment Survey, Office for National Statistics
Please note that due to the experimental nature of the employment statistics produced by New Anglia LEP for the New Anglia
area presented on page 5, these have not been able to be replicated for comparator areas, hence why the figures for New
Anglia here are different to those reported previously.
7
Proportion of employment provided by the Ports &
Logistics sector across comparator areas, 2015
New Anglia
6.7%
Norfolk
5.2%
Suffolk
8.2%
Greater Lincolnshire LEP
7.6%
Humber LEP
7.3%
Solent LEP
7.4%
South East LEP
6.5%
East of England
6.2%
England
5.9%
Source: Business Register and Employment Survey, Office for National Statistics
Please note that due to the experimental nature of the employment statistics produced by New Anglia LEP for the New Anglia
area presented on page 5, these have not been able to be replicated for comparator areas, hence why the figures for New
Anglia here are different to those reported previously.
8
https://newanglia.co.uk/wp-content/uploads/2021/05/background09-28.jpg8b50540a-b235-11eb-8b25-0cc47a792c0a_id_8b50540a-b235-11eb-8b25-0cc47a792c0a_files/background09.jpg" width=841 height=595>
Employment provided by the Ports & Logistics sector
across New Anglia, 2015
Babergh
1,450
Breckland
3,225
Broadland
1,655
Forest Heath
1,200
Great Yarmouth
1,780
Ipswich
5,240
King`s Lynn and West Norfolk
3,000
Mid Suffolk
3,915
North Norfolk
1,625
Norwich
5,530
South Norfolk
1,750
St Edmundsbury
3,195
Suffolk Coastal
9,205
Waveney
2,040
Source: Business Register and Employment Survey, Office for National Statistics
9
Proportion of employment provided by the Ports &
Logistics sector across New Anglia, 2015
Breckland
6.5%
Broadland
3.6%
Great Yarmouth
4.7%
Kings Lynn and West Norfolk
5.6%
North Norfolk
9.8%
Norwich
10.3%
South Norfolk
3.9%
Babergh
4.7%
Forest Heath
4.9%
Ipswich
7.3%
Mid Suffolk
11.1%
St Edmundsbury
2.6%
Suffolk Coastal
10.9%
Waveney
4.4%
Source: Business Register and Employment Survey, Office for National Statistics
10
Change in Ports & Logistics employment across
comparator areas, 2010 - 2015
New Anglia
10%
Norfolk
7%
Suffolk
13%
Greater Lincolnshire LEP
6%
Humber LEP
16%
Solent LEP
20%
South East LEP
9%
East of England
11%
England
9%
Source: Business Register and Employment Survey, Office for National Statistics
11
Change in Ports & Logistics employment
across New Anglia, 2010 - 2015
Babergh
4%
Breckland
-10%
Broadland
-6%
Forest Heath
32%
Great Yarmouth
-10%
Ipswich
14%
King`s Lynn and West Norfolk
7%
Mid Suffolk
11%
North Norfolk
19%
Norwich
25%
South Norfolk
0%
St Edmundsbury
9%
Suffolk Coastal
16%
Waveney
14%
Source: Business Register and Employment
Survey, Office for National Statistics
12
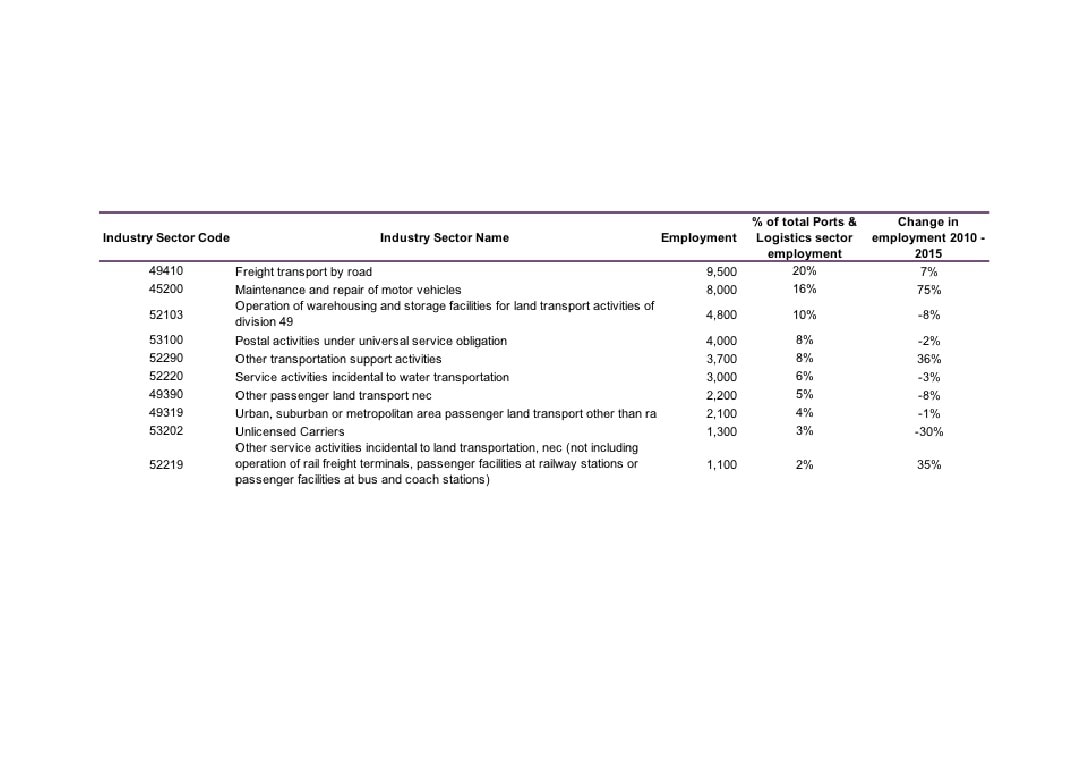
Top Ports & Logistics sub sectors by employment, 2015
Source: New Anglia LEP Economic Strategy evidence base work
13
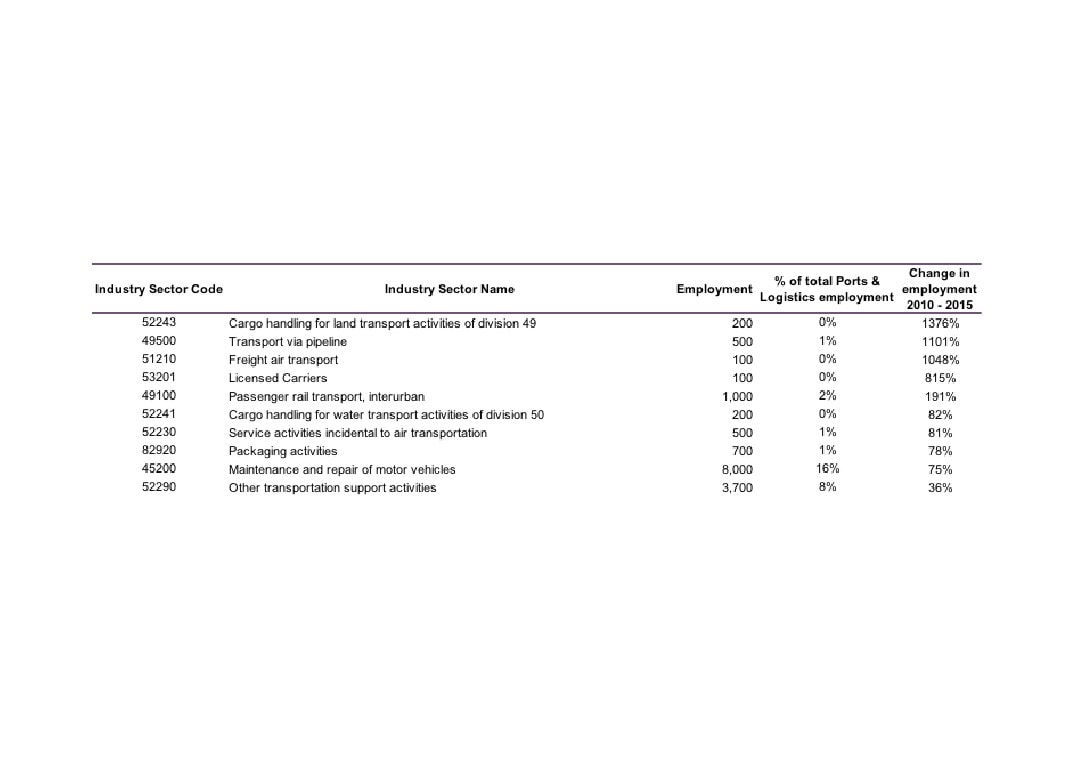
Top Ports & Logistics sub sectors with 100 employees or more by growth in
employment
Source: New Anglia LEP Economic Strategy evidence base work
14
Ports & Logistics location quotients across
comparator areas, 2010 and 2015
1.1
New Anglia
1.1
0.9
Location quotients (LQs) are a
Norfolk
0.9
useful way of showing a sectors
importance to the local economy
1.4
Suffolk
relative to the national picture. The
1.3
analysis presented here uses
employment with an LQ above 1
showing a higher concentration than
nationally, and an LQ of below than
1.3
1 a lower concentration.
Greater Lincolnshire LEP
1.3
1.3
Humber LEP
1.1
1.3
Solent LEP
1.1
2015
1.1
South East LEP
1.1
2010
1.1
East of England
1.0
Source: Business Register and Employment Survey, Office
for National Statistics
15
Ports & Logistics location quotients
across New Anglia, 2015
0.8
Babergh
0.8
1.1
Breckland
1.5
0.6
Broadland
0.6
0.8
Forest Heath
0.6
0.8
Great Yarmouth
0.9
1.3
Ipswich
1.2
1.0
King`s Lynn and West Norfolk
0.9
1.9
Mid Suffolk
1.8
0.8
North Norfolk
0.8
1.1
2015
Norwich
0.9
0.6
South Norfolk
2010
0.6
0.9
St Edmundsbury
0.9
3.1
Suf folk Coastal
2.9
0.9
Waveney
0.7
Source: Business Register and Employment Survey, Office for National Statistics
16
Ports & Logistics sub sectors with location quotients (LQs) above 2
Source: Business Register and Employment Survey 2015, Office for National Statistics
17
Full time, part time, and self-employment in the
Ports & Logistics sector, 2015
New Anglia
57%
29%
14%
Transport & Logistics
76%
12%
12%
0%
100%
Full time
Part time
Self Employed
Source: New Anglia LEP Economic Strategy evidence base work
18
Change in full time, part time, and self-employment
in the Ports & Logistics sector, 2010 - 2015
Source: New Anglia LEP Economic Strategy evidence base work
19
New Anglia LEP
7%
18%
43%
9%
3%
19%
Norfolk
4%
8%
13%
25%
49%
Suffolk
3%
8%
13%
25%
49%
Workplace Ports &
Logistics sector
Greater
7%
15%
44%
11%
3%
18%
Lincolnshire LEP
employment 2011 by broad
Humber LEP
7%
15%
44%
10%
4%
20%
Standard Occupational
Solent LEP
7%
6%
20%
39%
5%5%
18%
Classification (SOC)
South East LEP
8%
15%
45%
6%
5%
20%
across comparator areas
Source: 2011 Census, Office for National Statistics
East
8%
15%
44%
7%3%
22%
England
8%
14%
45%
6%4%
22%
116 Managers and Directors in Transport and Logistics
351 Transport Associate Professionals
523 Vehicle Trades
821 Road Transport Drivers
822 Mobile Machine Drivers and Operatives
823 Other Drivers and Transport Operatives
926 Elementary Storage Occupations
20
Breckland
7%
15%
45%
10%
20%
Broadland
5%
19%
42%
8%
22%
Great Yarmouth
7%
18%
46%
7%
4%
16%
King`s Lynn and West Norfolk
6%
24%
39%
13%
15%
North Norfolk
5%
27%
43%
9%
13%
Workplace Ports & Logistics
Norwich
6%
21%
44%
5%
16%
sector employment 2011 by
South Norfolk
7%
21%
45%
9%
16%
broad Standard Occupational
Babergh
9%
16%
44%
9%
19%
Classification (SOC) across
Forest Heath
7%
22%
37%
7%
22%
New Anglia
Ipswich
8%
14%
46%
6%
5%
20%
Mid Suffolk
8%
18%
44%
9%
17%
Source: 2011 Census, Office for National Statistics
St Edmundsbury
7%
13%
43%
8%
27%
Suffolk Coastal
11%
10%
41%
10%
6%
21%
Waveney
6%
20%
42%
8% 6%
16%
116 Managers and Directors in Transport and Logistics
351 Transport Associate Professionals
523 Vehicle Trades
821 Road Transport Drivers
822 Mobile Machine Drivers and Operatives
823 Other Drivers and Transport Operatives
926 Elementary Storage Occupations
21
Enterprises
Ports & Logistics sector enterprises across
comparator areas, 2016
New Anglia
4,085
Norfolk
1,970
Suffolk
2,110
Greater Lincolnshire LEP
4,120
Humber LEP
2,555
Solent LEP
2,500
South East LEP
10,090
Source: UK Business Counts, Office for National Statistics
22
Ports & Logistics sector enterprises as a proportion of
total enterprises across comparator areas, 2016
New Anglia
6.7%
Norfolk
6.1%
Suffolk
7.3%
Greater Lincolnshire LEP
10.9%
Humber LEP
8.7%
Solent LEP
6.3%
South East LEP
6.1%
East of England
6.6%
England
5.8%
Source: UK Business Counts, Office for National Statistics
23
Ports & Logistics sector enterprise numbers
across New Anglia, 2016
Suffolk Coastal
500
King`s Lynn and West Norfolk
380
Ipswich
375
Breckland
375
South Norfolk
320
Mid Suffolk
315
St Edmundsbury
285
Norwich
240
Broadland
240
Waveney
220
North Norfolk
205
Babergh
205
Great Yarmouth
155
Forest Heath
145
Source: UK Business Counts, Office for National Statistics
24
Ports & Logistics enterprises as a proportion of total
enterprises across New Anglia, 2016
Ipswich
%
10%
Suffolk Coastal
9%
Breckland
8%
King`s Lynn and West Norfolk
7%
Mid Suffolk
7%
St Edmundsbury
6%
Forest Heath
6%
Waveney
6%
South Norfolk
6%
Norwich
5%
Great Yarmouth
5%
Broadland
5%
Babergh
5%
North Norfolk
5%
Source: UK Business Counts, Office for National Statistics
25
New Anglia
88%
10%
2%
Norfolk
89%
9%
1%
Suffolk
87%
11%
2%
Ports & Logistics sector
Greater Lincolnshire
92%
7%
1%
LEP
enterprise numbers by size
Humber LEP
88%
11%
1%
Solent LEP
91%
8%
1%
across comparator areas,
South East LEP
90%
9%
1%
2016
East of England
90%
9%
1%
Please note that at Local Authority level that
England
91%
7%
1%
businesses employing more than 250 people are
not reported due to their very small numbers and
No. of employees
resulting disclosive nature.
Micro (0 to 9) Small (10 to 49) Medium-sized (50 to 249)
Large (250+)
Source: UK Business Counts, Office for
Babergh
92%
8%
National Statistics
Breckland
91%
8%
1%
Broadland
93%
7%
Forest Heath
96%
4%
Great Yarmouth
94%
6%
Ipswich
93%
6%
1%
Ports & Logistics sector
King`s Lynn and West Norfolk
91%
9%
Mid Suffolk
90%
10%
enterprise numbers by size
North Norfolk
95%
5%
across New Anglia, 2016
Norwich
91%
9%
South Norfolk
95%
5%
St Edmundsbury
91%
9%
Suffolk Coastal
86%
12%
2%
Waveney
88%
13%
26
Change in Ports & Logistics sector enterprises
across comparator areas, 2010 - 2016
New Anglia
17%
Norfolk
14%
Suffolk
18%
Greater Lincolnshire LEP
65%
Humber LEP
18%
Solent LEP
27%
South East LEP
23%
East of England
33%
England
36%
Source: UK Business Counts, Office for National Statistics
27
Change in Ports & Logistics sector enterprises across
New Anglia, 2010 - 2016
Babergh
5%
Breckland
17%
Broadland
2%
Forest Heath
7%
Great Yarmouth
0%
Ipswich
56%
King`s Lynn and West Norfolk
21%
Mid Suffolk
3%
North Norfolk
0%
Norwich
30%
South Norfolk
21%
St Edmundsbury
33%
Suffolk Coastal
16%
Waveney
13%
Sources: UK Business Counts, Office for National Statistics
28
Ports & Logistics Skills
Supply and Demand
29
Qualifications
Ports & Logistics sector workplace qualifications across comparator
areas, 2011
New Anglia
21%
25%
19%
10%
12%
13%
Greater Lincolnshire LEP
21%
23%
18%
10%
13%
15%
Humber LEP
21%
23%
19%
10%
14%
14%
Solent LEP
15%
21%
18%
12%
22%
12%
South East LEP
20%
24%
19%
10%
14%
13%
Source: 2011 Census, Office for National Statistics
East of England
20%
24%
18%
10%
15%
14%
England
19%
22%
18%
11%
17%
14%
No qualifications
Level 1 qualifications
Level 2 qualifications
Level 3 qualifications
Level 4 qualifications and above
Apprenticeships and other qualifications
30
Change in Ports & Logistics sector workplace qualifications,
2001 - 2011
2011
21%
25%
19%
10%
12%
13%
2001
25%
25%
22%
7%
12%
10%
2011
20%
24%
18%
10%
15%
14%
2001
23%
25%
23%
8%
13%
9%
2011
19%
22%
18%
11%
17%
14%
2001
22%
24%
23%
8%
15%
8%
0%
100%
No qualifications
Level 1 qualifications
Level 2 qualifications
Level 3 qualifications
Level 4 qualifications and above
Apprenticeships and other qualifications
Source: 2001 and 2011 Census, Office for National Statistics
31
UKCES ESS
2015
The following analysis uses the LEP level data released as part of the UK Commission for Employment and Skills (UKCES) Employer Skills
Survey (ESS) 2015. The data covers the areas of vacancies, skills gaps, training, and staff retention and underutilisation.
Data is published for a limited number of broad sectors at LEP level and we have chosen the sector of ‘Transport, Storage and Comms’ as that
being closest to encapsulating Ports & Logistics sector activity. In all instances, national, regional, and New Anglia LEP averages are presented
as comparators.
In total, 2,364 employers in New Anglia were surveyed, 253 of which were ‘Transport, Storage and Comms’ employers.
32
Vacancies
17%
17%
Establishments with any vacancies
19%
20%
6%
10%
Have at least one vacancy that is hard to fill
7%
8%
4%
8%
Have a skills shortage vacancy (prompted or
unprompted)
5%
Source: UKCES Employer
Skills Survey 2015
6%
3%
2%
Number of vacancies as a % of all employment
3%
3%
19%
41%
% of all vacancies which are SSVs
22%
23%
New Anglia (Average)
Transport, Storage & Comms (New Anglia)
East of England (Average)
England (Average)
33
Skills Gaps
14%
18%
% of establishments with any staff not fully
proficient
13%
14%
3%
3%
Number of staff not fully proficient as a % of
employment
5%
5%
New Anglia (Average)
Transport, Storage & Comms (New Anglia)
East of England (Average)
England (Average)
Source: UKCES Employer Skills Survey 2015
34
Training
7.5
4.6
Training days per trainee
6.3
6.8
4.7
2.0
Training days per staff
4.0
4.3
New Anglia (Average)
Transport, Storage & Comms (New Anglia)
East of England (Average)
England (Average)
Source: UKCES Employer Skills Survey 2015
35
65%
58%
% of establishments training staff over the last 12 months
64%
66%
48%
% of establishments providing off-the-job training in the last
43%
12 months
47%
48%
51%
% of establishments providing on-the-job training in the last
43%
12 months
51%
52%
42%
% of training establishments providing online training or e-
40%
learning in the last 12 months
44%
45%
63%
43%
Number trained as % of total staff
64%
63%
Source: UKCES Employer Skills Survey 2015
New Anglia (Average) Transport, Storage & Comms (New Anglia) East of England (Average) England (Average)
36
Staff
25%
29%
Establishments with underutilised staff
25%
30%
7%
8%
Whether any jobs in which have difficulties retaining staff
Source: UKCES Employer
Skills Survey 2015
7%
8%
New Anglia (Average) Transport, Storage & Comms (New Anglia) East of England (Average) England (Average)
37
FE Learning
Aims
All data (unless stated otherwise) is sourced from the Department for Education’s Further Education data library
In order to present information that is relevant to New Anglia LEPs high performing and underpinning sectors then we have
identified FE and skills provision data split by Sector Lead Body and aligned a best-fit with each sector.
The Sector Lead Bodies identified as being the most relevant to the Ports & Logistics sector are ‘Automotive Industries’, ‘Freight, Logistics &
Wholesale’, ‘Maritime’ and ‘Passenger Transport’.
However, not all FE and Skills learning aims align with a sector lead body. In fact, on average around two thirds are classed as unknown. This
means that we are basing results here on roughly a third of the data.
Please note that all data is rounded to the nearest 10 and that therefore some figures presented may not add to the sum totals presented.
38
Ports & Logistics sector learning aims delivered to
domiciled learners by Sector Lead Body
0%
10%
20%
30%
40%
50%
60%
70%
80%
90%
100%
New Anglia
2,020
610
410
National
62,100
62,400
42,700
Automotive Industries
Freight Logistics & Wholesale
Maritime
Passenger Transport
Source: FE Data Library, Department for Education
39
Ports & Logistics sector learning aims delivered to New Anglia
learners by Sector Lead Body, 2010/11 and 2012/13
2,020
1,900
1,130
610
480
410
170
20
Automotive
Freight Logistics &
Maritime
Passenger
Industries
Wholesale
Transport
2010/11
2012/13
Source: FE Data Library, Department for Education
40
Change in Ports & Logistics sector learning aims delivered to resident
learners by Sector Lead Body, 2010/11 - 2012/13
11%
Total inc. Unknown
9%
4%
Total not inc. Unknown
7%
-17%
Transport & Logistics
-13%
6%
Automotive Industries
-5%
-46%
Freight Logistics & Wholesale
-11%
-88%
Maritime
-79%
-15%
Passenger Transport
-21%
New Anglia
National
Source: FE Data Library, Department for Education
41
Ports & Logistics learning aims delivered to New Anglia
residents by New Anglia based and external providers by
Sector Lead Body, 2012/13
0%
10%
20%
30%
40%
50%
60%
70%
80%
90%
100%
Transport & Logistics
1,990
1,070
Automotive Industries
1,670
350
Freight Logistics & Wholesale
210
400
Maritime
20
-
Passenger Transport
90
320
Total inc. unknown
158,480
52,170
Total with unknown removed
55,340
24,770
New Anglia Provider
External Provider
Source: FE Data Library, Department for Education
42
Ports & Logistics learning aims delivered to New Anglia learners by
New Anglia providers by Sector Lead Body, 2010/11 and 2012/13
1,670
1,590
2010/11
2012/13
250
210
170
130
90
20
Automotive Industries
Freight Logistics &
Maritime
Passenger Transport
Wholesale
Source: FE Data Library, Department for Education
43
Change in Ports & Logistics learning aims delivered to resident learners
by domiciled providers by Sector Lead Body, 2010/11 - 2012/13
5%
Total inc. Unknown
9%
-38%
Total not inc. Unknown
7%
-7%
Transport & Logistics
-13%
5%
Automotive Industries
-5%
62%
Freight Logistics & Wholesale
-11%
-88%
Maritime
-79%
-64%
Passenger Transport
-21%
New Anglia
National
Source: FE Data Library, Department for Education
44
Apprenticeships
Ports & Logistics sector apprenticeship starts
by year
Apprenticeship Framework
2011/12
2012/13
2013/14
2014/15
Aviation Operations on the Ground
40
0
0
<5
Bus and Coach Engineering and Maintenance
<5
5
5
10
Driving Goods Vehicles
70
70
85
35
International Trade and Logistics Operations
65
15
30
20
Logistics Operations
20
25
15
20
Marine Industry
0
<5
0
Passenger Carrying Vehicle Driving (Bus and Coach)
10
20
15
50
Print and Printed Packaging
25
10
<5
10
Rail Engineering (Track)
<5
5
<5
<5
Rail Infrastructure Engineering
<5
<5
10
20
Rail Services
5
0
0
0
Vehicle Body and Paint
35
40
120
80
Vehicle Fitting
5
20
10
10
Vehicle Maintenance and Repair
275
315
300
330
Vehicle Parts
20
25
20
15
Warehousing and Storage
110
95
100
90
Grand Total
685
650
720
690
Source: Skills Funding Agency Data Cube
45
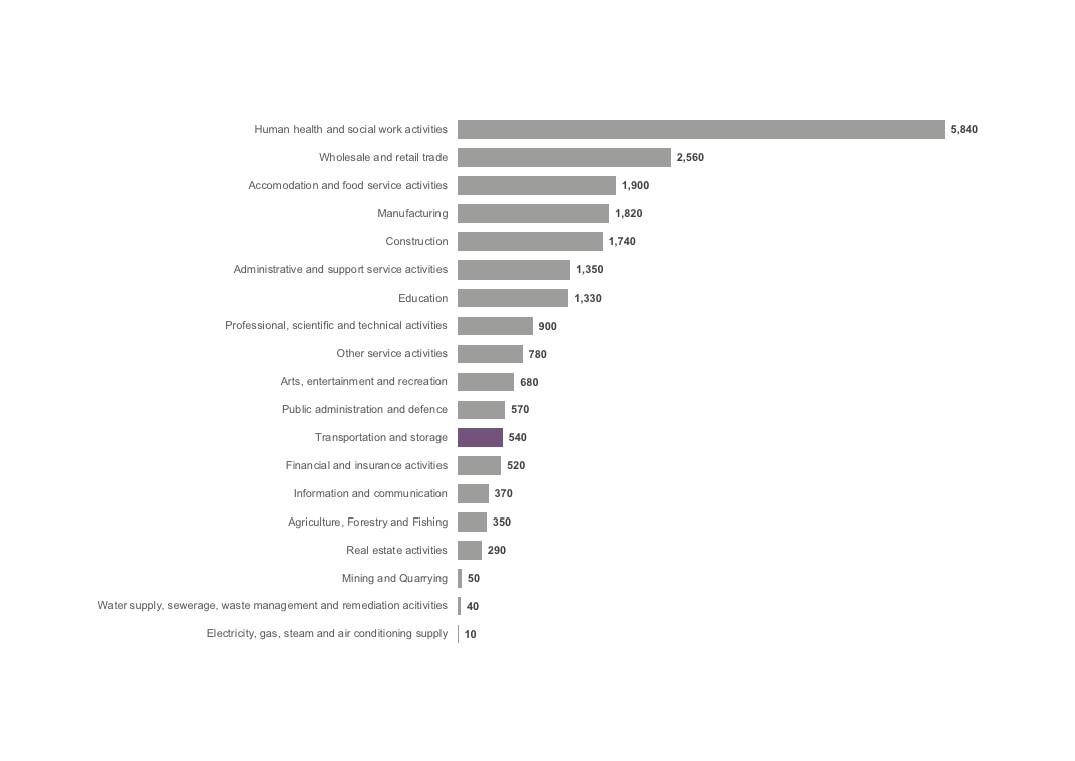
Apprenticeship participation by sector, 2014/15
Source: FE Data Library, Department for Education
46
Apprenticeship participation in the Ports & Logistics sector
2014/15 as a proportion of total participation
New Anglia
2.5%
England
2.9%
New Anglia England
Source: FE Data Library, Department for Education
47
Labour Insight
Jobs
The following section presents data from Labour Insight, a Burning Glass analytical tool. This tool collects details of online
job postings from multiple sources and enables the analysis of these postings based on specific skills, educational
requirements, and job titles, for example.
Please note that whilst Labour Insight will capture more information on the jobs market than more traditional Department
for Work and Pensions vacancy data, the fact that not all job vacancies are advertised means that there will still be gaps in
the findings.
According to the Labour Insight Jobs tool, then there were 10,516 postings for the Ports & Logistics sector in New Anglia
between Jan. 1, 2012 and Dec. 31, 2016.
The definition for the Ports & Logistics sector in this exercise captures the following industry and sectors: ‘Transportation
and Storage’.
48
Location
0
500
1,000
1,500
2,000
2,500
Norwich
Ipswich
Breckland
St Edmundsbury
Suffolk Coastal
Mid Suffolk
King's Lynn and West Norfolk
Forest Heath
Waveney
Ports & Logistics sector
South Norfolk
vacancies across New Anglia,
Great Yarmouth
Jan 2012 - Dec 2016
North Norfolk
1,004 unspecified or unclassified postings
Source: Labour Insight Jobs, Burning
Babergh
Glass Technologies
Broadland
49
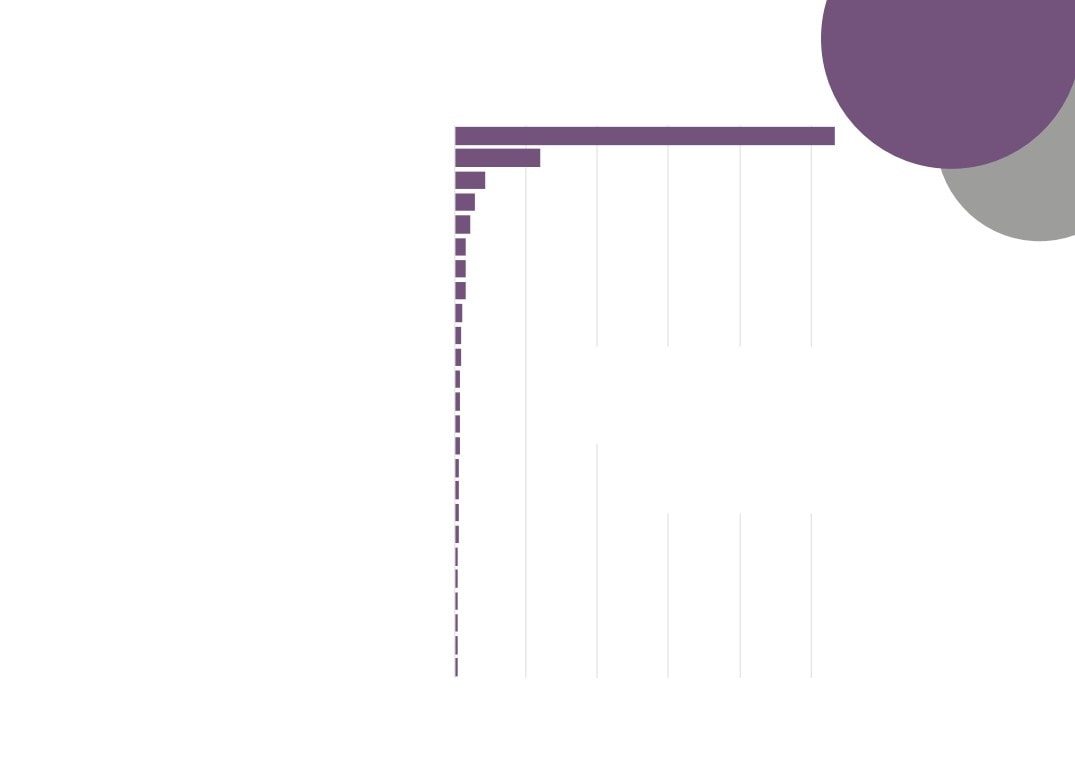
Recruiters
Reliance Employment Limited
British Marine
Truckdriver4hire
Parcelforce
Driverbase East
British Airways
Top Ports & Logistics sector
TNT UK Ltd
Firstgroup Plc
recruiters across New Anglia,
East of England Co-operative Society
Jan 2012 - Dec 2016
APRS Ltd
7,096 unspecified or unclassified postings
Associated British Ports Holdings
First Scotrail
Source: Labour Insight Jobs, Burning Glass
Technologies
UK Mail Group
Scotrail
First Captial Connect
Yodel
DHL Express
Park Resorts
UPS - UK
Post Office Ltd
Arc Norwich Ltd
Arc Incorporated Ltd
Royal Mail
Dee Set Logistics
Salian Group
0
50
100
150
200
250
50
Occupation
0
1,000
2,000
3,000
4,000
5,000
Large goods vehicle drivers (8211)
Fork-lift truck drivers (8222)
Van drivers (8212)
Bus and coach drivers (8213)
Sales and retail assistants (7111)
Other administrative occupations n.e.c. (4159)
Programmers and software development managers (2136)
Plant and machine operatives n.e.c. (8129)
Postal workers, mail sorters, messengers and couriers (9211)
Taxi and cab drivers and chauffeurs (8214)
Call and contact centre occupations (7211)
Ports & Logistics sector
Business sales executives (3542)
Managers and directors in retail and wholesale (1190)
vacancies by occupation,
Transport and distribtuion clerks and assistants (4134)
Jan 2012 - Dec 2016
Customer service occupations n.e.c. (7219)
26 unspecified or unclassified postings
Elementary storage occupations (9260)
Source: Labour Insight Jobs, Burning
Merchandisers and window dressers (7215)
Glass Technologies
Sales accounts and business development managers (3545)
Vehicle technicians, mechanics and electricians (5231)
Construction operatives n.e.c.
Managers and proprietors in other services n.e.c.
Sales related occupations n.e.c. (7129)
Managers and directors in storage and distribution (1161)
Managers and directors in storage and warehousing (1162)
Telephone salespersons (7113)
51
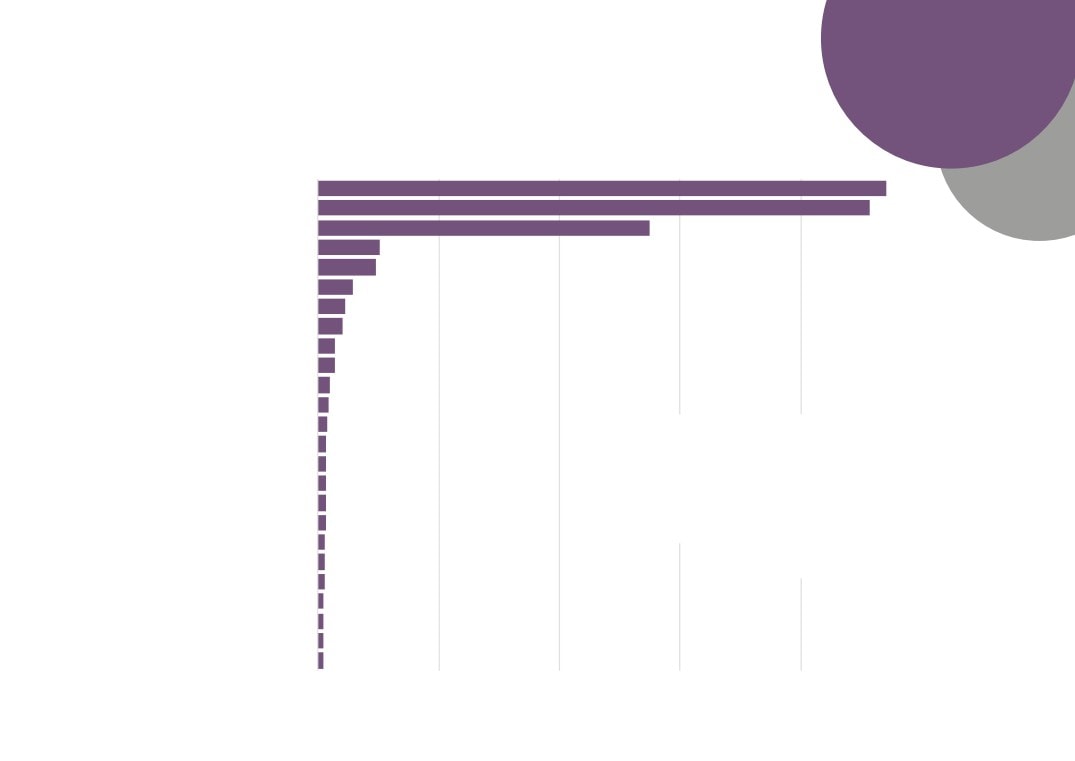
Job Title
0
500
1,000
1,500
2,000
HGV2 / LGV C Driver
HGV1 / LGV C1+E Driver
Forklift Driver
Bus / Coach Driver
HGV Driver
Sales Executive
Merchandiser
Truck Driver
LGV Driver
Delivery Driver
Taxi Driver
Trainee HGV Driver
Retail Salesperson
Ports & Logistics sector
Retail
Business Development Executive
vacancies by job title, Jan
Cleaner
2012 - Dec 2016
Office Manager
Quantity Surveyor
0 unspecified or unclassified postings
Hiab Driver
Source: Labour Insight Jobs, Burning
Glass Technologies
Receptionist
Warehouse Operative
Office Clerk
Distributor
Post Office Assistant
Distributor for Delivery A
52
Qualification
Requirements
1
22
28
230
Ports & Logistics sector
132
vacancies by qualification level
required, Jan 2012 - Dec 2016
9,921 unspecified or unclassified postings
Source: Labour Insight Jobs, Burning Glass Technologies
170
GCSEs, Standard Grades, and Level 2 S/NVQs
Bachelor's degrees, graduate certificates and diplomas
A-Levels, Highers, and Level 3 S/NVQs
Post graduate degrees, Level 5 S/NVQs, certificates and
diplomas
Level 4 diplomas and certificates, HNCs, Level S/NVQs
Foundation degrees and HNDs
53
Skills
Requirements
0
100
200
300
400
500
600
Customer Service
Forklift Operation
Product Sales
Product Sale and Delivery
Microsoft Excel
Customer Contact
Transportation Logistics
Repair
Microsoft Office
Business Management
Project Management
Ports & Logistics sector
Construction Industry Knowledge
Merchandising
vacancies by skills
Sales
required, Jan 2012 - Dec
Key Performance Indicators
Invoicing
2016
Office Management
7,625 unspecified or unclassified postings
Order and Invoice Processing
Source: Labour Insight Jobs, Burning
Lift Trucks
Glass Technologies
Logistics
Heavy / Large Goods Vehicle Driving
Marketing Sales
Scheduling
Microsoft Windows
Cleaning
54
Where the
Work is
The following analysis makes use of data and findings available via the online toolkit http://wheretheworkis.org/ . The findings presented
are a result of combining data from the UKCES ‘Working Futures’ programme and job vacancy data from the Labour Market Insight tool
developed by Burning Glass.
Limitations
Though the ‘Where the work is’ tool provides a comprehensive and detailed free-to-use dashboard of supply and demand in the UK, the
following limitations should be taken into account when interpreting the data:
- Senior Management and Elementary roles
Occupations not open to recent HR graduates or FE finishers are not considered. Similarly, occupations that do not require any formal
qualifications or training are also excluded from this tool, since the number of job-seekers cannot be meaningfully quantified.
- Matching supply and demand
Some occupations do not have specific qualifications or subject-specific requirements (such as sales, marketing and related associate
professionals). As a result of this, and despite the fact that many people with a broad range of qualifications can apply for these occupations,
they frequently appear ‘undersupplied’ in the tool, i.e. when the “job opportunity” is low. Occupations with very small sample sizes (either of
finishers or job postings) are excluded from the dataset.
- Internal and international migration
Some occupations do not rely solely on FE finishers or HE graduates from their immediate location. Many people travel to find work, often
moving across the country. Other occupations, such as those on the Migration Advisory Committee’s shortage occupation list, may rely more
heavily on jobseekers arriving from outside the UK.
- Online and offline postings
Burning Glass Technologies (BGT) acknowledge that not all jobs are posted online, although a comparison of the Annual Survey of Hours and
Earnings (ASHE) employment data and BGT postings data for UK in 2014 showed a 94 per cent correlation between ASHE and BGT
occupational distributions. The BGT posting data slightly overestimate the proportion of professional and associate professional occupations,
while slightly underestimating the proportion of elementary occupations.
55
Location
Quotient
Location Quotient - Measure of Job Posting Density
relative to employment indexed to the national density
relative to employment
Vehicle Trades
0.88
Skilled Trades (Other)
0.73
56
Vacancies by
Opportunity
Number of Job Postings asking for entry-level (2 years of
experience or fewer) and school leaver education levels,
further education levels, and higher education levels
Vehicle Trades
192
684
Skilled Trades (Other)
117
95
School leaver
FE HE
57
Average
Wages
Advertised Salaries for Job Postings in 2015
£27,100
Vehicle Trades
£29,600
£34,200
£24,100
Skilled Trades (Other)
£32,000
£42,400
New Anglia
East of England
England
58
Opportunity
Scores
Opportunity Score - Score based on the Demand
Supply Ratio of FE postings within a geography,
from Very Low (0) to Very High (100)
54
Vehicle Trades
72
63
39
Skilled Trades (Other)
55
50
New Anglia
East of England
England
59
A Future View of the
Ports & Logistics Sector
60
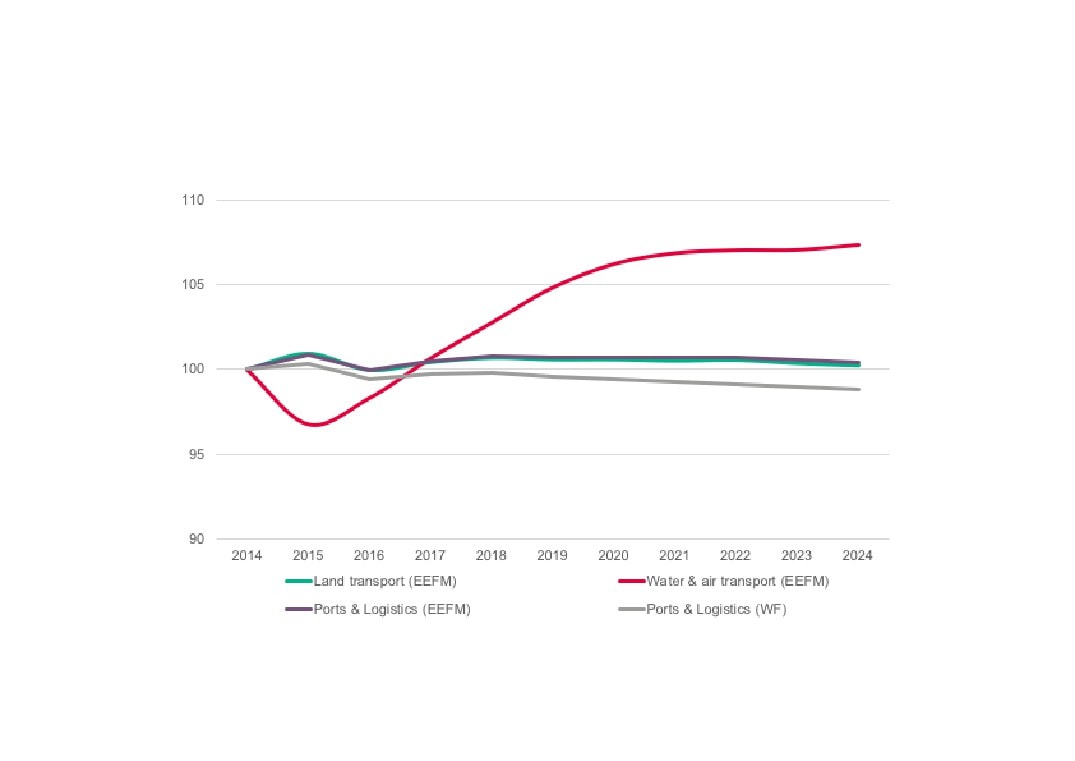
The following analysis uses data from the East of England Forecasting Model (EEFM) and the UKCES Working Futures data
(WF). In each case the Financial Services & Insurance sector has been approximated from the sector splits available in each
model. In the case of the East of England Forecasting Model then ‘Land transport’ and ‘Water & air transport’ have been
combined to provide forecasts for the Ports & Logistics sector. For the Working Futures data, the sector ‘Transport & Logistics’
has been referred to.
Please note that neither model, or the forecasts they produce, take into account the New Anglia LEPs ambitions for growth in
Gross Value Added (GVA) and employment.
61
Forecasts for change in Ports & Logistics sector
employment in New Anglia (2014 = 100)
Sources: East of England Forecasting Model, Cambridge Econometrics;
UKCES Working Futures 2014 - 2024
62
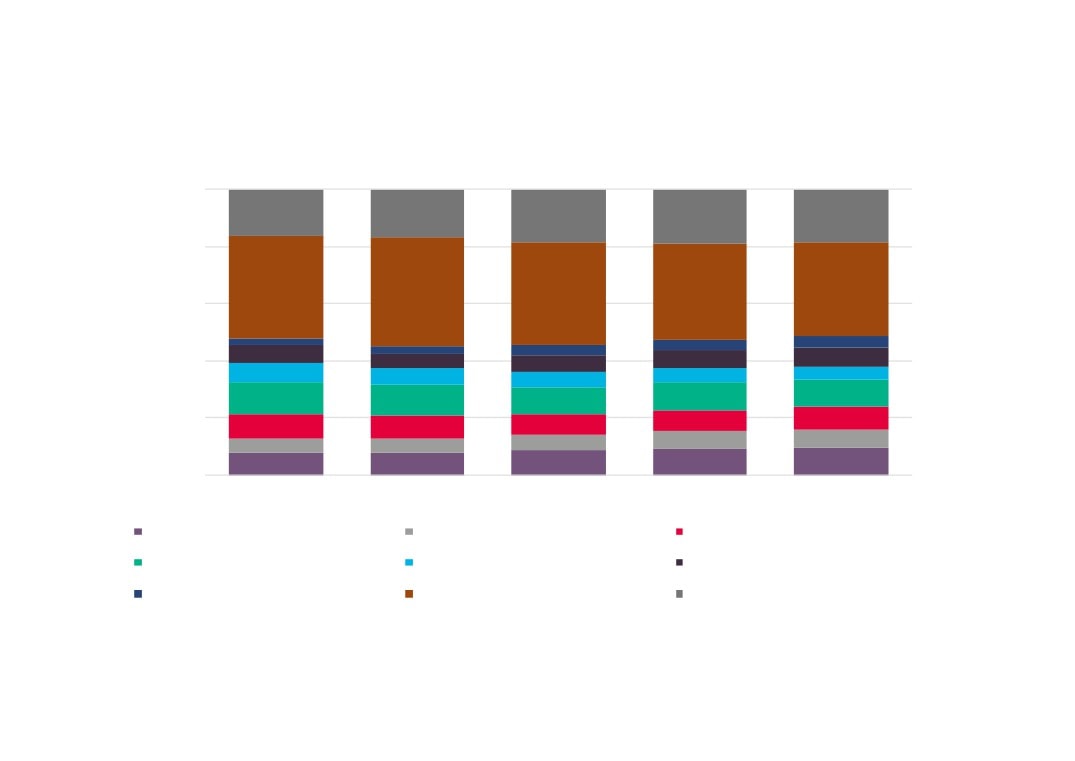
Occupational composition of employment in New Anglia’s
Ports & Logistics sector over time
100%
16%
17%
19%
19%
19%
80%
36%
38%
34%
33%
36%
60%
3%
4%
4%
3%
3%
40%
7%
6%
5%
5%
6%
11%
10%
10%
11%
10%
20%
8%
8%
8%
8%
7%
6%
6%
6%
5%
5%
8%
8%
9%
9%
10%
0%
2004
2009
2014
2019
2024
Managers, directors and senior officials
Professional occupations
Associate professional and technical
Administrative and secretarial
Skilled trades occupations
Caring, leisure and other service
Sales and customer service
Process, plant and machine operatives
Elementary occupations
Source: UKCES Working Futures 2014 - 2024
63
Ports & Logistics sector replacement and expansion demand by
occupation (top 5 in terms of net requirement), 2014 - 2024
-1,000
0
1,000
2,000
3,000
4,000
5,000
6,000
7,000
Transport and mobile machine drivers and
operatives
Elementary administration and service occupations
Administrative occupations
Corporate managers and directors
Leisure, travel and related personal service
occupations
Expansion demand
Replacement demand
Net requirement
Source: UKCES Working Futures 2014 - 2024
64
Ports & Logistics sector replacement and expansion demand as a
proportion of employment by occupation, 2014 - 2024 requirement)
-20% -10%
0%
10% 20% 30% 40% 50% 60% 70%
All occupations
Transport and mobile machine drivers and
operatives
Elementary administration and service
occupations
Administrative occupations
Corporate managers and directors
Leisure, travel and related personal service
occupations
Expansion demand
Replacement demand
Net requirement
Source: UKCES Working Futures 2014 - 2024
65
Ports & Logistics sector replacement and expansion demand by
qualification, 2014 - 2024
-5,000
-2,500
0
2,500
5,000
7,500
10,000
QCF 7-8
QCF 4-6
QCF 3
QCF 2
QCF 1
No Qual
Expansion Demand
Replacement Demand
Source: UKCES Working Futures 2014 - 2024
Please note that the Working Futures data uses the
following breakout of qualification levels:
QCF8 - Doctorate
QCF7 - Other higher degree
QCF6 - First degree
QCF5 - Foundation degree; Nursing; Teaching
QCF4 - HE below degree level
QCF3 - A level & equivalent
QCF2 - GCSE (A-C) & equivalent
QCF1 - GCSE (below grade C) & equivalent
No Q - No Qualification
66
Ports & Logistics sector qualifications, 2014 - 2024
2024
4%
26%
21%
31%
16%
QCF 7-8
QCF 4-6
QCF 3
QCF 2
QCF 1
No Qual
2014 2%
16%
22%
30%
22%
8%
Source: UKCES Working Futures 2014 - 2024
0%
100%
Please note that the Working Futures data uses the
following breakout of qualification levels:
QCF8 - Doctorate
QCF7 - Other higher degree
QCF6 - First degree
QCF5 - Foundation degree; Nursing; Teaching
QCF4 - HE below degree level
QCF3 - A level & equivalent
QCF2 - GCSE (A-C) & equivalent
QCF1 - GCSE (below grade C) & equivalent
No Q - No Qualification
67
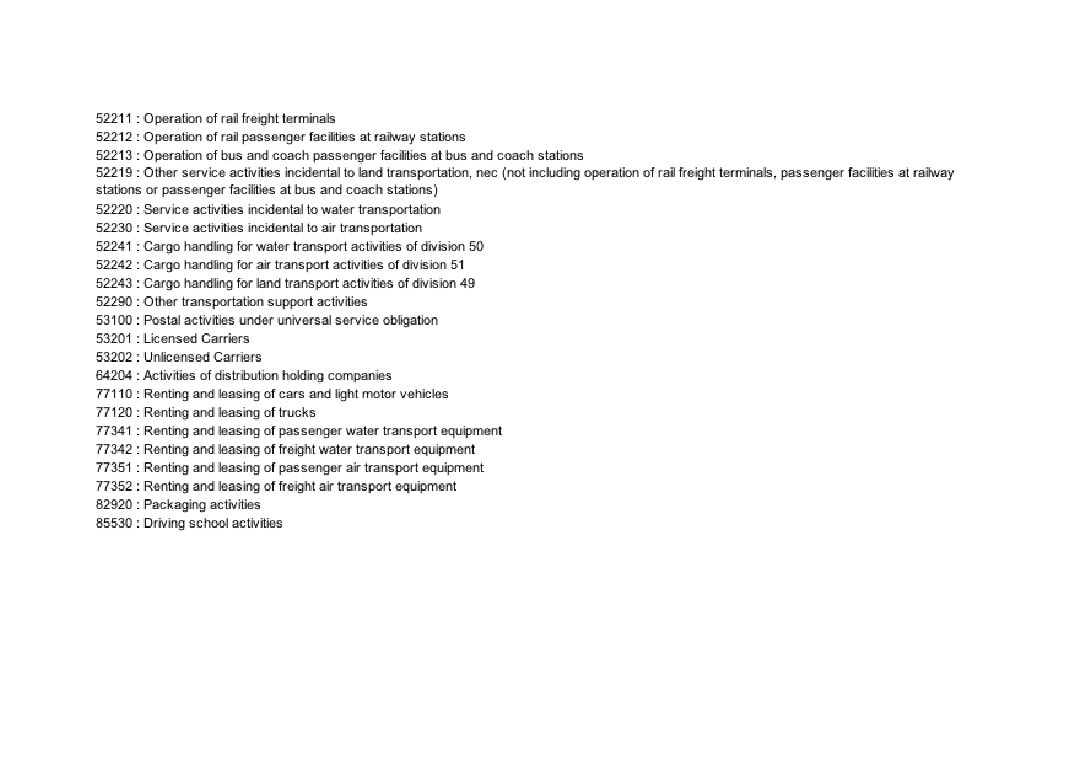
Appendix - Ports & Logistics Sector Definition
The following five digit SIC codes are being used to measure levels of, and change in, both employment and enterprise numbers in the sector.
69