New Anglia LEP - Construction Labour and Skills
Research
Final Report
Client: New Anglia LEP
Author: Sandra Lilley, Doug
Forbes and Martin Turner
Approved by: CITB
Date: 12/02/16
New Anglia LEP
Construction Labour Research
February 2016
Version
Date
Details of modifications
Draft 1
17/09/15
Initial draft release
Draft 2
05/02/16
Updated labour demand and supply projections
This report was commissioned by, and prepared for the New Anglia LEP by a consortium of CITB and Whole Life Consultants
Ltd, ('The Consortium’)͘ The findings and conclusions set forth in this report represent the best professional judgment of the
Consortium based on information made available to it at a point in time. The Consortium has relied on, and not
independently verified, data provided to it by such sources and secondary sources of information cited in the report. We
disclaim any responsibility to the client and others in respect of any matters outside the scope of the above. We accept no
responsibility to third parties to whom this report, or any part, thereof is made available. Any such party relies upon the
report at their own risk.
CITB
Whole Life Consultants Limited
Bircham Newton
Dundee University Incubator
Kings Lynn
James Lindsay Place
Norfolk
Dundee
PE31 6RH
DD1 5JJ
t: +44 (0)344 994 4400
t/f: +44 (0)1382 224 304
CITB is registered in England and Wales Charity No 264289
Whole Life Consultants Ltd is registered in Scotland as
and in Scotland Charity No SC044875
SC259987, VAT number 852809506
Registered office c/o 14 City Quay, Dundee DD1 3JA
i
New Anglia LEP
Construction Labour Research
February 2016
Table of Contents
TABLE OF CONTENTS
II
LIST OF FIGURES
IV
LIST OF TABLES
V
INTRODUCTION
1
Background
1
Defining strategic objectives
1
Creating the evidence base
2
METHODOLOGY
3
A VIEW OF DEMAND
4
Introduction
4
Pipeline analysis
4
3.2.1.
Glenigan pipeline
4
3.2.2.
Breakdown of spend by project type
7
3.2.3.
Producing estimates of labour demand
12
Breakdown of labour demand by project type
16
Sizewell C nuclear power station
16
Assessing the wider demand within New Anglia
18
3.5.1.
Methodology and assumptions
18
3.5.2.
Updated labour demand calculations and projections
19
Neighbouring regions
21
Summary of demand
25
A PICTURE OF SUPPLY
26
Main points
26
Existing workforce
27
Employer Structure
29
Training provision
29
Mobility of the workforce
31
Main points
31
Work history
31
Worker origins
32
Travel to site
32
Site duration and change
33
Sub-sector and sector mobility
33
Leaving the sector
34
DEMAND AGAINST SUPPLY
35
Main points
35
Gap Analysis
36
ii
New Anglia LEP
Construction Labour Research
February 2016
5.2.1. Construction specific occupations
38
5.2.2. Cross-sector occupations
39
Long term construction employment forecast
39
CONCLUSIONS AND RECOMMENDATIONS
41
Summary of Concluding Remarks
41
Recommendations
42
iii
New Anglia LEP
Construction Labour Research
February 2016
List of Figures
Figure 1: The significant projects in Glenigan used in this analysis
7
Figure 2: Total Construction labour demand arising from the Glenigan data
for the LEP including projected growth (excluding Sizewell C)
14
Figure 3: Construction labour demand arising from the Glenigan Pipeline by
occupation in the peak year
15
Figure 4: Construction labour demand arising by sector and sub-sector
16
Figure 5: Construction labour demand of the Sizewell C development
compared to the rest of the demand in the New Anglia LEP
17
Figure 6: Total construction labour demand including estimate for R&M and
projects not in the Glenigan database
20
Figure 7: Construction employment in the East of England: 2002-2019
(Source: Experian & CITB)
27
Figure 8: Construction firms by size, 2014 (Source: ONS/NOMIS)
29
Figure 9: Furthest distance worked in past 12 months (CITB, 2015)
33
Figure 10: Average number of weeks from planning to work on site, UK 2010-
2013 (Source: UKCG/Glenigan)
35
iv
New Anglia LEP
Construction Labour Research
February 2016
List of Tables
Table 1: Details of large projects
5
Table 2: Breakdown of the significant project and total values in the LEP, as
captured in Glenigan
5
Table 3: Proportion of total value related to construction
6
Table 4: List of 20 significant projects
8
Table 5: Construction spend per sector for the period 2015-2019
9
Table 6: Construction spend per infrastructure sub-sector for the period
2015-2019
10
Table 7: Total labour demand in the LEP (excluding mine and offshore)
13
Table 8: Comparison of labour demand arising from Sizewell C to the New
Anglia LEP
18
Table 9: Total labour demand in the New Anglia LEP area
19
Table 10: Significant projects in neighbouring areas
22
Table 11: Construction occupational breakdown, 2015 (Source Experian &
CITB)
28
Table 12: Type of projects spent significant periods on (CITB, 2015)
34
Table 13: Demand as a % of 2015 employment (Source: CITB/WLC)
36
Table 14: Occupational breakdown of demand for New Anglia LEP (Source
CITB/WLC)
37
v
New Anglia LEP
Construction Labour Research
February 2016
Introduction
Background
The New Anglia Local Enterprise Partnership (LEP) and the Construction Industry Training Board (CITB)
are working together on the creation of a plan for action to enable some of the challenges the LEP
faces to be addressed through local construction activity.
This research report creates a detailed ‘evidence base’ that should be utilised to inform decision
making and enable the creation and execution of that action plan.
CITB and New Anglia LEP have held a series of discussions highlighting the objectives that this research
should inform. This report represents the concluded research, taking into account key questions posed
by the LEP, the New Anglia Skills Board and Building Growth Group; addressing issues so that a
practical approach can be taken to realising the opportunities that activity in the construction sector
can generate in terms of developing skills and creating jobs.
Defining strategic objectives
Underpinning the action plan is the New Anglia LEP, which is a partnership for growth between the
private sector, local authorities, universities, further education and other stakeholders across Norfolk
and Suffolk.
The LEP’s Strategic Economic Plan (SEP) outlines how the New Anglia LEP will:
Create the right conditions for business to thrive, establishing New Anglia as a centre of global
business excellence.
Create 95,000 more jobs across all sectors feeding a more efficient local economy;
Create a further 10,000 new businesses, with a focus on SMEs.
Shape the local workforce to provide people with skills that businesses need to succeed and
that will provide them with job opportunities.
Improve productivity, ensuring that by 2026 gross value add per job will equal the national
average.
Create 117,000 new homes by 2026, a 32% increase in delivery.
To achieve the goal of increased high value jobs and increased productivity across businesses New
Anglia LEP recognises the need to improve the skills system across Norfolk and Suffolk. Activity has
taken place through the City Deal approach to bring stakeholders together, including local businesses,
training providers and local authorities to ensure a common approach was identified and an effective
strategy developed. This strategy (which includes the creation of a Skills Manifesto and Skills Board)
focuses on improving processes, utilising funding streams with improved effect and ensuring national
programmes are relevant for local stakeholders.
Understanding the challenges that exist in each sector has become key, hence the commission of this
study. Construction as a sector is significant and is still feeling the impact of the recession that saw a
considerable decline in its skills base and people leaving the sector. Construction projects of all sizes
create jobs that contribute to economic growth and stability and require a significantly skilled
workforce that needs to be supported and trained, mainly locally. In addition 95% of the construction
sector workforce is supplied by SME and micro employers throughout the New Anglia LEP area. The
sector is, therefore, dominated by micro businesses and there is a significant proportion of self-
employed labour in the sector.
1
New Anglia LEP
Construction Labour Research
February 2016
Traditionally employers in this segment of the market can be difficult to reach. However, the LEP has
made supporting small businesses a priority, which should create significant benefits for the
construction sector in this area.
CITB’s primary remit includes:
Assisting and directing the further education offer to employers - improving the quality,
relevance and impact of the most significant providers of initial training and up-skilling.
Sharing labour market intelligence - creating a ‘bespoke evidence base’ where required͘
Improving employability with a focus on ensuring that young people aged 16-24 have the best
opportunity to get a job locally and are work ready.
Supporting business-provider collaboration.
The subsequent action plan co-created by the New Anglia LEP and the CITB team will seek to ensure
that a continuing supply of appropriately qualified local people is available to meet the identified local
skills and employment outcomes. This approach will be supported and informed by the development
of a comprehensive evidence base that will provide information to support decision making and help
ensure that the vision and objectives for the New Anglia LEP and CITB are met.
Creating the evidence base
This evidence base will:
Analyse the demand pipeline in the New Anglia area
(by occupation, sector and
geographically) to understand what construction opportunities are likely to be created, the
skills challenges and how employment and training opportunities can be maximised. This
analysis will include the impact of any potential new nuclear new build at Sizewell in Suffolk.
Create additional analysis based on the development of a scenario that estimates an element
of ‘unknown’ construction projects that have a value less that £250,000 or will be repair &
maintenance focussed. The purpose of this is to ascertain additional elements of the demand
pipeline but it should be noted that this part of the analysis cannot be assessed at occupational
level.
Analyse the wider New Anglia demand pipeline to understand what additional projects will be
taking place that will potentially draw on the localised skills base.
What major employers exist in New Anglia that will employ the construction workforce and
deliver the forecasted projects.
Conduct analysis into current supply including the existing workforce, provision supplied by
local colleges, technical and higher level skills development and retention and how new
entrants feed into construction.
Understand the impact of the loss of skills from construction into other sectors post-recession
and the risks associated with an aging workforce.
Consider inter-regional supply mobility and how this might impact on construction skills and
employment in the area.
Evaluate existing construction training provision in the area, the extent to which this is fit for
purpose and the potential viability of a range of flexible training options in the future
incorporating innovation within the sector.
CITB will engage local stakeholders, as appropriate, during the development of this action plan and
evidence base.
2
New Anglia LEP
Construction Labour Research
February 2016
Methodology
The methodology utilised covers a range of research approaches rather than relying on a singul
method, therefore enhancing the ability to produce a richer evidence base through a range of
approaches that are both quantitative and qualitative.
CITB offers a bespoke research service that builds on the detailed Labour Market Intelligence it
produces utilising its unique forecasting model known as the Labour Forecasting Tool (LFT). The team
works in close partnership with WLC Ltd (a spin out company from the University of Dundee) that
specialises in labour productivity, planning and control and building labour forecasting models. Please
refer to Appendix A for an explanation of the methodology followed to produce the labour demand
figures.
This research has been supported by the CITB research team that specialises in labour market analysis
relating to the supply of labour and identifying skills ‘pinch-points’͘ To date our work has been
significantly tested and extends to a portfolio of bespoke research skills commissions at project,
programme and regional level to create a compelling evidence base to support decision making.
The research has included:
Demand analysis of construction projects projected over a five year period in the LEP area at
a detailed occupational level, utilising the Labour Forecasting Tool.
Analysis of labour supply; including the existing workforce, new entrants
(including
apprentices) and labour mobility.
Gap analysis to determine occupational pinch-points and decipher recommendations
regarding training interventions.
A map of existing provision to support recommendations relating to capacity, capability and
collaboration on future curriculum offers.
This methodology has enabled a comprehensive research report to be produced that will identify
current and emerging skills needs and make recommendations on strategies and actions to ensure the
LEP has a construction workforce that is fit for purpose.
This will underpin the wider construction strategy work that the LEP is progressing with CITB and
support the LEP in meeting its strategic priorities in the production of detailed, specific labour market
intelligence for construction. The information it will generate will enable stakeholders to hold effective
conversations and work across the LEP and with other agencies, employers and providers to ensure
maximum employment and training opportunities for local residents.
The Labour Market Intelligence (LMI) and its recommendations will provide the evidence base to
enable the New Anglia LEP to ensure that there are adequate and effective programmes of skills
development and employment interventions that meet demand during the construction phase of key
projects.
3
New Anglia LEP
Construction Labour Research
February 2016
A view of demand
Introduction
This section provides an evidence base of the labour demand that construction investment will create
across the LEP over the next five years. Please refer to Appendix A for an explanation of the
methodology followed to produce the labour demand figures. First, in Section 3.2, we analyse the
demand based solely on the data contained on the Glenigan database. In Section 3.3, we add to the
Glenigan data our estimates of the total value of new build projects that is not included in Glenigan
and the value of repair and maintenance projects. We have input this data to our Labour Forecasting
Tool1 (LFT) to analyse the skills requirements in each of 28 occupations listed in Appendix B. The results
are also presented at a trade, craft and professional level that will enable the LEP to take a
comprehensive view of the demand generated by planned projects.
This study includes a detailed analysis of the projects taking place wholly within the counties of Norfolk
and Suffolk as well as the relevant portions of frameworks taking place within the area. A detailed
picture of the labour demand for the New Anglia LEP area and for the two areas of Norfolk and Suffolk
are presented in Appendix E and Appendix F.
Pipeline analysis
Our analysis of the demand in the area initially considers the demand from the known pipeline of
work. This demand is principally generated by those projects included within the Glenigan database
although it is supplemented with additional knowledge of the New nglia area’s construction output.
3.2.1.
Glenigan pipeline
Our initial analysis of the pipeline of construction work taking place in New Anglia is based on the
projects contained in the Glenigan database. This contains details of the planning applications from
local authorities. Glenigan supplements this with additional project-specific data. The Glenigan
database does not identify every single project in an area as some small projects (typically but not
exclusively those less than £250,000 in value) and those which do not require a planning application
(including repair and maintenance) are not included. An initial assessment of the projects in the
database ensured that only projects which had a) a defined value and b) defined start and end dates
were considered in the analysis. Also excluded were two consultancy projects2 and a number of
projects (16 in total) which were clearly identified as duplicates. A full set of the projects which were
omitted from the analysis are shown in Appendix D. Values given in the Glenigan database are the
total value of construction and engineering works. The scope of this study is limited to the
construction sector and where appropriate an estimate of the engineering value has been made and
removed from the total value to provide what we have termed the construction value.
Included in the Glenigan pipeline are two projects related to the Sizewell C nuclear new build site.
These are large, one off projects, which warrant special consideration in understanding the
construction labour market in the LEP area. The labour demand figures and timeframe of the Sizewell
C project used in the report were provided by the Nuclear Energy Skills Alliance (NESA).
1 A methodological note on the LFT is provided in Appendix A
2 The LFT calculates the demand for professional occupations from a project’s construction value͘ To include consultancy
projects separately would result in double counting
4
New Anglia LEP
Construction Labour Research
February 2016
Table 1: Details of large projects
Project
Area
Construction
Proportion of total Glenigan
Value (£m -
Construction spend
2015 values)
Sizewell C Power Stations - Contract 1
Suffolk
5,000
46.0%
Sizewell C Power Stations - Contract 23
Suffolk
1,000
9.2%
The Mean Value Theorem4 was applied to the remainder of the pipeline for Norfolk and Suffolk
separately, excluding the two Sizewell C projects in Table 1, to identify the significant projects in the
LEP. This process identified 61 significant projects in Norfolk and 74 in Suffolk, in both cases accounting
for over 70% of the construction spend in each respective county. This allowed a detailed analysis of
a large proportion of all the projects and a comprehensive consideration of the project types to which
they were assigned.
Table 2 shows the number of significant projects within each county and the percentage of spend per
area arising from the significant projects. The total spend per area can also be seen. The construction
spend shown in this table takes account of any adjustments for engineering works and any incomplete,
duplicate or consultancy projects. Values are shown in 2015 prices as this was provided in the Glenigan
database.
Table 2: Breakdown of the significant project and total values in the LEP, as captured in Glenigan5
Areas
Total (New Anglia LEP)
Norfolk
Suffolk
Total number of projects
412
330
742
Construction spend (£m - 2015
3,741
2,135
5,876
values)
Number of significant projects
61
74
135
Construction spend in
2,868
1,721
4,589
significant projects (£m - 2015
values)
Percentage of construction
76.7%
80.6%
78.1%
spend in significant projects
Some of the projects within the Glenigan database have elements that cover more than one area.
Elements of the UK-wide Social Infrastructure Development (SID) framework are taking place within
the New Anglia LEP. These were estimated to be proportional to the population of the Norfolk and
Suffolk counties relative to the UK’s total population͘ maintenance and works framework taking
place in Norfolk and the surrounding counties was broken down proportionally to each county’s
population and the appropriate elements were used for the analysis in Norfolk and Suffolk. A
construction framework comprising works in the East of England region was broken down into the
3 Glenigan lists two separate contracts for Sizewell C
4 The Mean Value Theorem states that most information is obtained for least effort simply by considering only those data
whose annual construction spend is higher than the mean. This approach is used to identify the few significant values that
account for the largest amount of expenditure.
5 The values in this table are the values from the Glenigan database to which the construction element percentage has
been applied and thus reflect the adjusted values of the infrastructure projects to distinguish between construction and
engineering construction.
5
New Anglia LEP
Construction Labour Research
February 2016
counties of East of England in proportion to their population and the appropriate elements for Norfolk
and Suffolk were used in the analysis.
The labour demand for all of the projects in the Glenigan database was produced using the Labour
Forecasting Tool. The following input data was used to produce the forecasts.
The value of each project in the pipeline provided in the Glenigan database, for all projects
excluding infrastructure.
As noted previously for infrastructure projects, the value used was a percentage of the value
in the Glenigan database, representing the construction portion of the value, excluding
engineering construction. The percentages applied can be seen in Table 3. The construction
proportions have been validated in work we have undertaken for other clients.
Start and end dates of each project provided in the Glenigan database.
For the significant projects, project descriptions in the database enabled us to apply the most
appropriate project type (each type is driven by a different underlying model) to each forecast
that was run through the LFT. Cases where a project consisted of more than one type were
broken down into multiple forecasts that were assigned specific project types to more closely
predict the labour demand. This took account of the different types of work within a single
project, e.g. mixed developments comprising housing, commercial and industrial.
For the rest of the projects, the default project type allocation as defined in the Glenigan
database was applied, except for the infrastructure projects which were individually allocated
to the most appropriate type from the available LFT infrastructure types.
Table 3: Proportion of total value related to construction
Sector
Proportion of construction
activity
Flooding
90%
Science & Research
100%
Roads
100%
Airports
100%
Ports
90%
Stations (Underground/Network rail)
80%
Mixed Rail (Track, stations, E&P etc.)
55%
Bridges
100%
WTW/WTWW
90%
Generation (Renewables - Offshore)
20%
Generation (Renewables - Onshore)
10%
Biomass
50%
Undefined Energy
40%
Nuclear Decommissioning
60%
Photovoltaics
80%
Gas Transmission/distribution
30%
General Infrastructure
100%
6
New Anglia LEP
Construction Labour Research
February 2016
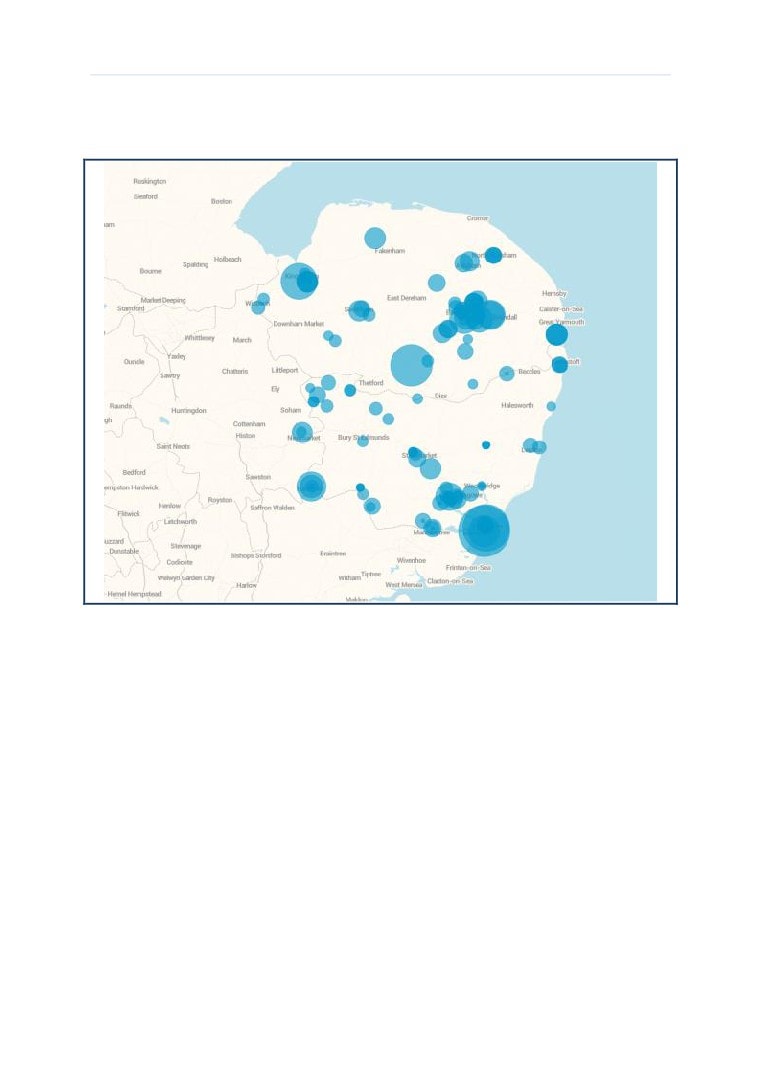
Appendix C provides a full breakdown of the significant projects and their construction values. The
significant projects’ locations can be seen in Figure 1. The radius of the markers are in proportion to
the value of the project.
Figure 1: The significant projects in Glenigan used in this analysis
Table 4 lists the top 20 significant projects, by value, taking place within the LEP in the period 2015-
2019.
The data relating to all of the projects has been stored in the version of the LFT for which the LEP will
have a licence. All the assumptions regarding the input parameters - including project duration and
values - can be updated by the LEP as and when more specific information becomes available. The
forecasts have been saved within the LFT for access by the LEP and any changes to scope (including
updates to the construction value) can readily be made.
3.2.2.
Breakdown of spend by project type
This section provides an overview of the development spend (£m - 2015 values) in the LEP broken
down by project type based on the projects included in the Glenigan database.
Table 5 shows the construction spend for each sector. It is clear that housing accounts for some 40%
of the construction spend. Infrastructure accounts for around a third of the spend and is particularly
driven by offshore wind in Norfolk which accounts for more than 60% of the infrastructure spend in
the New Anglia LEP, as can be seen in Table 6. Public non-housing projects account for almost 15% of
the spend.
7
New Anglia LEP
Construction Labour Research
February 2016
Table 4: List of 20 significant projects
Value (£m -
Number
Description
Local Authority
Start Date
End Date
Project Type
2015 values)
1
Offshore Wind Farm
Norfolk
400.0
01/04/2016
01/04/2020
Infrastructure
2
5,000 Eco Homes
Norfolk
375.0
09/10/2017
04/10/2021
New Housing
3
Offshore Wind Farm
Norfolk
360.0
01/04/2016
01/04/2019
Infrastructure
4
Minor/Major/Maintenance Works Framework
Norfolk
244.3
01/04/2015
03/04/2019
Public Non-housing
5
Wind Farm Development
Norfolk
108.0
30/04/2018
27/01/2020
Infrastructure
6
Offshore Wind Farm
Norfolk
100.0
20/08/2017
20/08/2019
Infrastructure
7
Offshore Wind Farm
Norfolk
100.0
12/06/2016
09/06/2019
Infrastructure
8
1000 Residential Units Development Partner
Norfolk
80.9
13/07/2015
08/07/2019
New Housing
9
Biomass Power Plant
Norfolk
80.0
02/03/2015
31/05/2017
Infrastructure
10
Social Infrastructure Framework
Norfolk
73.9
01/04/2015
01/04/2019
New Housing
11
910 Houses/Flats/School/Village Hall/Shop Units
Norfolk
68.3
03/03/2016
31/03/2017
New Housing
12
850 Residential Units/1 School & Commercial Units
Norfolk
63.8
29/12/2014
27/06/2016
New Housing
13
1110 Residential Units/1 School & Commercial Units
Norfolk
60.9
01/08/2016
29/07/2019
Private Commercial
14
CCGT Power Station
Norfolk
60.0
05/06/2017
05/12/2019
Infrastructure
15
Centre for Food & Health
Norfolk
55.0
04/01/2016
09/07/2018
Private Industrial
16
Solar Photovoltaic Array
Norfolk
48.0
02/02/2015
09/11/2015
Infrastructure
17
800 Residential Units & 1 School/Local Centre
Norfolk
44.6
05/10/2015
03/09/2018
Private Commercial
18
Commercial Units
Norfolk
42.6
14/09/2015
11/09/2017
Private Industrial
19
Council Office (Refurbishment)
Norfolk
32.0
04/03/2013
06/05/2016
Public Non-housing
20
Junction (Improvements)
Norfolk
30.0
11/04/2016
11/04/2017
Infrastructure
8
New Anglia LEP
Construction Labour Research
February 2016
Table 5: Construction spend per sector for the period 2015-2019
Sector
Construction spend in the
% of total -
Construction spend in the
% of total -
Construction spend in the
% of total -
period 2015-2019 (2015
Norfolk
period 2015-2019 (2015
Suffolk
period 2015-2019 (2015
New Anglia
values - £m) - Norfolk
values - £m) - Suffolk
values - £m) - New Anglia LEP
LEP
New Housing
1,272.5
36.9%
932.4
47.1%
2,204.9
40.6%
Infrastructure
1,484.4
43.1%
264.4
13.4%
1,748.8
32.2%
Public Non-residential
440.4
12.8%
321.1
16.2%
761.5
14.0%
Private Commercial
139.6
4.1%
246.1
12.4%
385.7
7.1%
Private Industrial
64.7
1.9%
165.4
8.4%
230.1
4.2%
Non-housing R&M
19.4
0.6%
45.4
2.3%
64.8
1.2%
Housing R&M
23.9
0.7%
5.5
0.3%
29.4
0.5%
Total
3,444.9
100.0%
1,980.3
100.0%
5,425.2
100.0%
9
New Anglia LEP
Construction Labour Research
February 2016
Table 6: Construction spend per infrastructure sub-sector for the period 2015-2019
Infrastructure sub-sector
Construction spend in the
% of total -
Construction spend in the
% of total -
Construction spend in the
% of total -
period 2015-2019 (2015
Norfolk
period 2015-2019 (2015
Suffolk
period 2015-2019 (2015
New Anglia
values - £m) - Norfolk
values - £m) - Suffolk
values - £m) - New Anglia LEP
LEP
Generation (Renewables
1,043.2
70.3%
67.2
25.4%
1,110.40
63.5%
- Offshore)
Undefined Energy
63.0
4.2%
80.4
30.4%
143.40
8.2%
Photovoltaics
122.6
8.3%
18.8
7.1%
141.40
8.1%
Biomass
85.8
5.8%
-
0.0%
85.80
4.9%
Roads
63.5
4.3%
15.5
5.9%
79.00
4.5%
Stations
41.9
2.8%
-
0.0%
41.90
2.4%
(Underground/Network
rail)
Ports
1.0
0.1%
37.9
14.3%
38.90
2.2%
Flooding
20.0
1.3%
5.5
2.1%
25.50
1.5%
WTW/WWTW
7.9
0.5%
11.2
4.2%
19.10
1.1%
General Infrastructure
4.1
0.3%
12.7
4.8%
16.80
1.0%
Science & Research
14.2
1.0%
-
0.0%
14.20
0.8%
Airports
14.2
1.0%
-
0.0%
14.20
0.8%
Bridges
-
0.0%
9.7
3.7%
9.70
0.6%
Generation (Renewables
2.7
0.2%
0.8
0.3%
3.50
0.2%
- Onshore)
Nuclear
-
0.0%
3.5
1.3%
3.50
0.2%
Decommissioning
Mixed Rail (Track,
-
0.0%
1.2
0.5%
1.20
0.1%
stations, E&P etc)
10
New Anglia LEP
Construction Labour Research
February 2016
Table 6: Construction spend per infrastructure sub-sector for the period 2015-2019
Infrastructure sub-sector
Construction spend in the
% of total -
Construction spend in the
% of total -
Construction spend in the
% of total -
period 2015-2019 (2015
Norfolk
period 2015-2019 (2015
Suffolk
period 2015-2019 (2015
New Anglia
values - £m) - Norfolk
values - £m) - Suffolk
values - £m) - New Anglia LEP
LEP
Gas
0.3
0.0%
-
0.0%
0.30
0.0%
Transmission/distribution
Total
1,484.4
100.0%
264.4
100.0%
1,748.8
100.0%
11
New Anglia LEP
Construction Labour Research
February 2016
3.2.3.
Producing estimates of labour demand
Based on the analysis of the Glenigan database this section presents the labour demand arising within
the LEP. Additional detail is shown in Appendix E.
The data in the Glenigan database presents a picture of the forthcoming projects. As the time horizon
extends there is less clarity on what is planned. For instance, in some cases a small number of projects
are due to complete in the 2020s. However, the small workload shown by the demand profile is highly
unlikely to reflect the total amount of work that will take place at that time. It is almost certain that
there will be additional projects that come on stream at that time that have not yet been considered.
The CSN forecasts, which consider the availability of labour, look forward five years. For consistency
we have presented the demand forecasts for the five year period 2015-19 used in the CSN model.
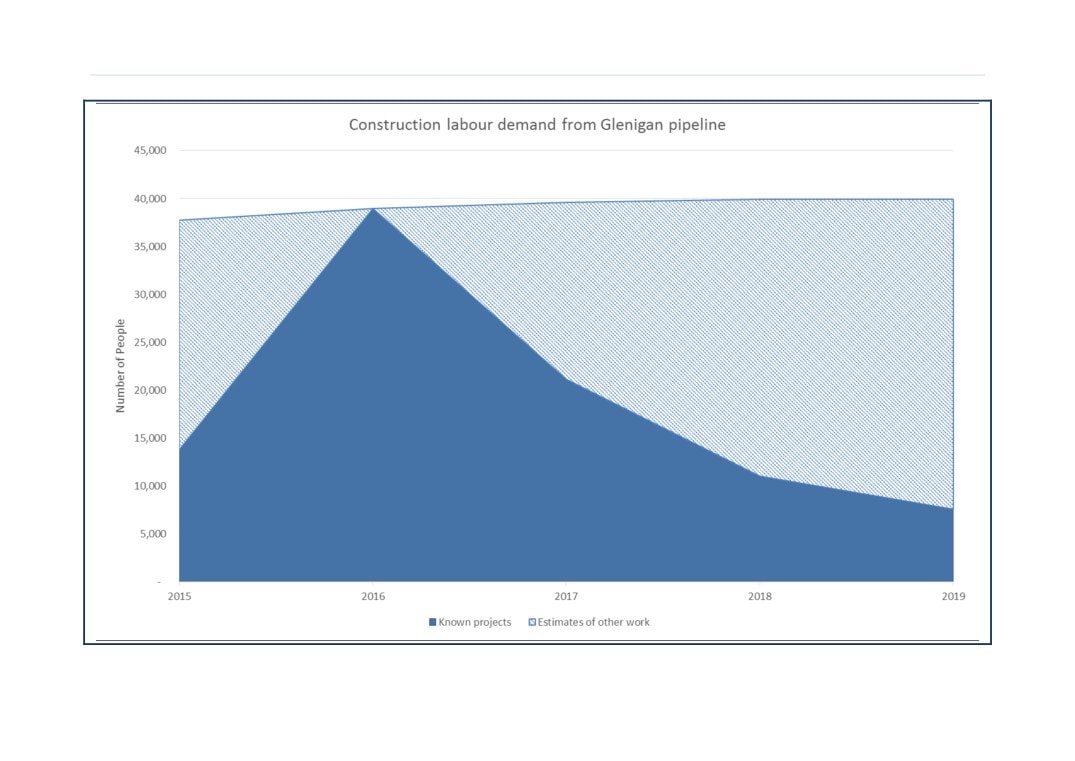
Labour demand figures have been rounded to the nearest 50. Figure 2 shows the construction labour
demand arising from the Glenigan data for the period 2015-2019 in the LEP.
It should be noted that the workforce will only peak for a relatively short period of time. The ramp up
and ramp down to that peak may be quite large. We have therefore presented the average workforce
during the year of the peak.
Table 7 shows the labour demand arising from the entire pipeline of projects, as well as the portion of
this demand within the 2015-2019 period. It also shows the peak workforce requirement of around
39,000 people occurring in 2016. As noted above the drop off, and indeed the ramp up, of projects
from an analysis of a pipeline is somewhat artificial. An approach to overcome this has been applied
to the analysis. The approach uses the assumption that the future workforce is approximately equal
to the peak. The peak has, therefore, been projected forward and backcast6 to create a more likely
scenario of the ongoing workforce. The growth rate is based on the CSN employment forecast for the
whole East of England region. The demand with an employment growth rate included is shown in
Figure 2. The shaded area shows the likely total labour demand arising from as yet undefined projects.
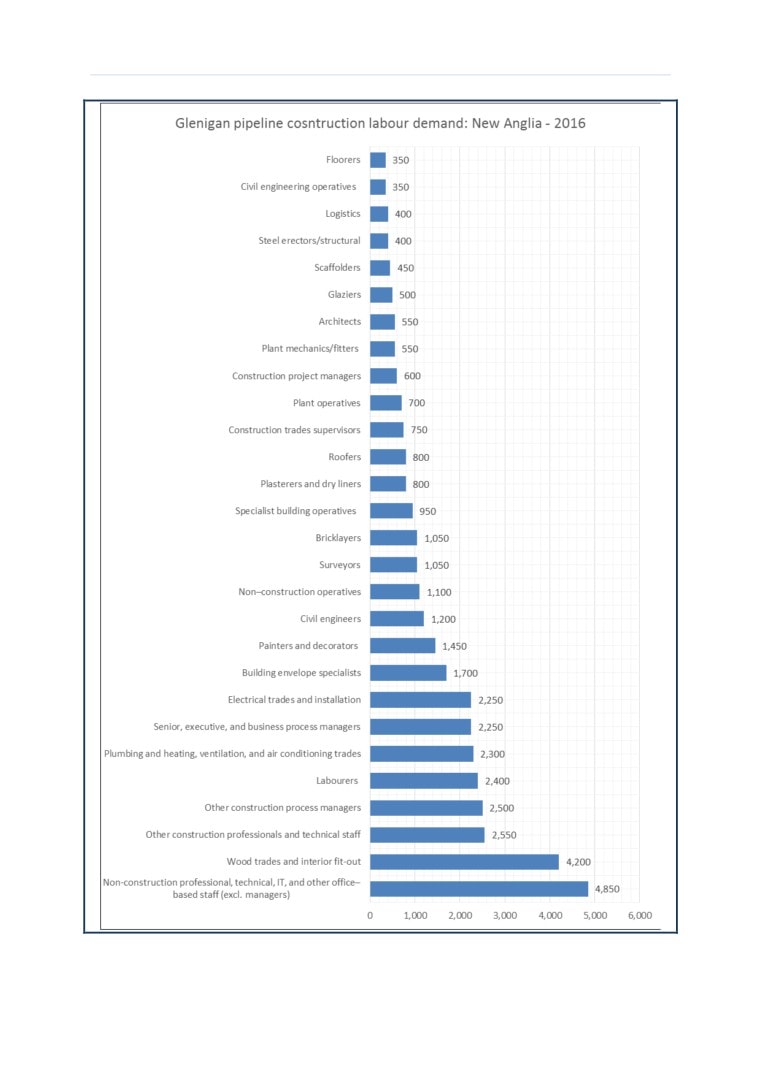
For the peak year we have shown a detailed breakdown by each of the 28 occupational groups for
which the forecast has been produced. These are shown in Figure 3. The projections of labour demand
for the trades occupations for the peak year of 2016 are as follows.
The trade occupation displaying the highest demand is “wood trades and interior fit-out”
peaking at 4,200 people;
“general labourers” follow with 2,400 people;
“plumbing and heating, ventilation and air conditioning trades” rank third with 2,300 people;
“electrical trades and installation” come next, with around 2,250 people demanded.
All other trades display a demand of less than 2,000 people each.
6 This takes account of the fact that the 2015 Glenigan figures which are tailing off and are past their peak than those in
2016.
12
New Anglia LEP
Construction Labour Research
February 2016
Table 7: Total labour demand in the LEP (excluding mine and offshore)
Area
Total Person-Years
Person-Years
% of total demand
Average workforce
2012-2025
2015-2019
in 2015-2019
during year of peak
Norfolk
62,600
57,650
92.1%
20,650
Suffolk
37,800
34,850
92.2%
18,350
New Anglia LEP area
100,400
92,500
92.1%
39,000
13
New Anglia LEP
Construction Labour Research
February 2016
Figure 2: Total Construction labour demand arising from the Glenigan data for the LEP including projected growth (excluding Sizewell C)
14
New Anglia LEP
Construction Labour Research
February 2016
Figure 3: Construction labour demand arising from the Glenigan Pipeline by occupation in the peak year
15
New Anglia LEP
Construction Labour Research
February 2016
Breakdown of labour demand by project type
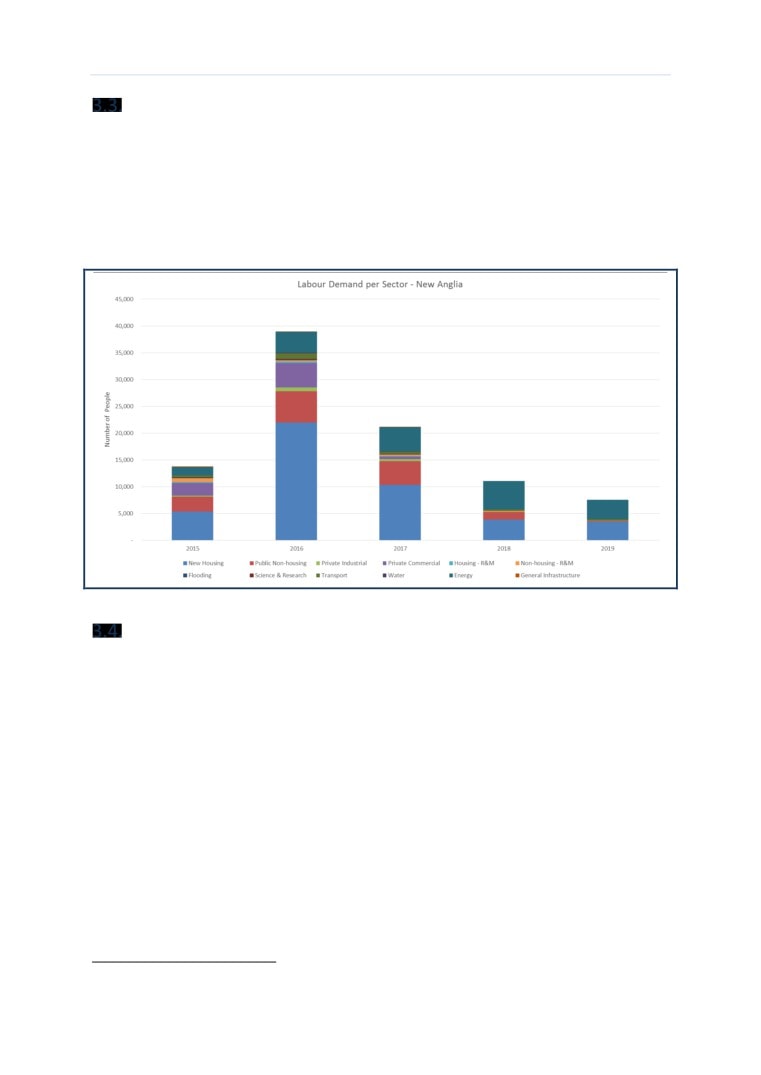
The labour demand has been calculated from the spend in each project type. In this section we have
considered the total labour demand. The peak workforce in 2016 is around 39,000. Figure 4 shows the
breakdown of labour demand by project type. For the peak year (2016) it can be seen that more than
half of the labour is generated by housing. This is due to the nature of housing work, which tends to
be more labour intensive than other types. Towards the end of the five year period there is a ramp-
up in infrastructure and particularly energy. This is driven primarily by offshore wind projects in
Norfolk.
Figure 4: Construction labour demand arising by sector and sub-sector
Sizewell C nuclear power station
The Sizewell C Nuclear New Build plant-related projects have been estimated at a total construction
value of £6bn (based on a Glenigan total project value of £12bn, which includes an engineering
construction element estimated from previous work to be 50% of the total value). The labour demand
arising from this development will account for a large additional demand in the local authorities in
proximity to Suffolk, including Norfolk and other neighbouring counties. For the purposes of this
analysis we have consulted directly with EDFE, but have relied on data that is in the public domain.
The data we have used has not been confirmed by EDFE. Stage 2 of the EDFE consultation is yet to
start and this analysis should be updated in collaboration with EDFE once that process has
commenced. The current estimated timescale for the main civils works of Sizewell C is 2021-2028 7.
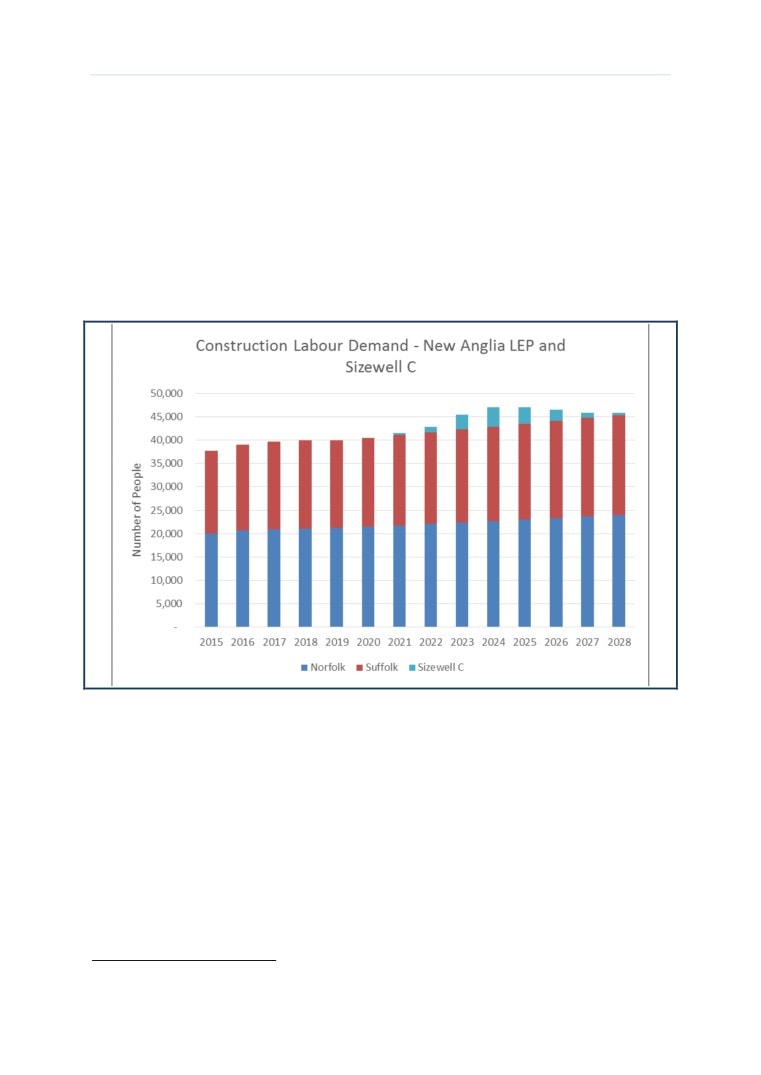
For the purposes of the demand arising from the Sizewell C work we have used the labour demand
figures produced by the Nuclear Energy Skills Alliance (NESA). The NESA analysis shows a peak
workforce of almost 4,200 construction people in 2024 for Sizewell C. This analysis is broken down by
occupation and these have been mapped to the relevant 28 occupational groups used by CITB. It
should be noted that this is an annual average construction workforce demand. It does not include
the operations or engineering construction workforce. In their consultation document, EDFE forecast
16
New Anglia LEP
Construction Labour Research
February 2016
a total monthly peak workforce of 5,600 people 8. From the data available to us, a construction
workforce of 4,200 is not inconsistent with a total workforce of 5,600.
We have aggregated the monthly demand across the New Anglia LEP into annual figures and
superimposed the demand arising from Sizewell C. For clarity we have presented the forecasts in this
section over a 14-year period to coincide with the predicted construction programme of Sizewell. This
is shown in Figure 5 with a continued employment rate projected at 2015-19 levels. At peak the
Sizewell work accounts for a workload equal to roughly 9.3% of the demand arising from the Glenigan
pipeline in the New Anglia LEP. Table 8 shows the impact of Sizewell C as a proportion of the peak
workforce from the projects in Glenigan in the Norfolk and Suffolk. This has been projected forward
assuming that the growth rate from 2015-19 continues into the next decade at the same rate. It shows
that the Sizewell C workforce accounts for up to around 9.3% of the workforce working on the
Glenigan pipeline of projects in the New Anglia LEP area.
Figure 5: Construction labour demand of the Sizewell C development compared to the rest of the demand in the
New Anglia LEP
17
New Anglia LEP
Construction Labour Research
February 2016
Table 8: Comparison of labour demand arising from Sizewell C to the New Anglia LEP
Sizewell C labour
Labour demand in
Sizewell C Labour Demand as a percentage of peak
demand (number of
the New Anglia LEP
demand (39,000 people) in the New Anglia LEP
people)
(number of people)
areas
2015
-
37,750
0.0%
2016
-
39,000
0.0%
2017
-
39,650
0.0%
2018
-
39,900
0.0%
2019
-
39,950
0.0%
2020
-
40,550
0.0%
2021
450
41,100
1.0%
2022
1,150
41,700
2.5%
2023
3,100
42,300
6.8%
2024
4,200
42,900
9.3%
2025
3,600
43,500
7.9%
2026
2,350
44,100
5.2%
2027
1,150
44,700
2.5%
2028
500
45,350
1.1%
Assessing the wider demand within New Anglia
3.5.1. Methodology and assumptions
The Glenigan database has two characteristics that prevent the results from providing the entire
labour demand profile for the area:
It does not record all smaller projects (roughly those of less than £250,000 value).
It records mainly new build projects and with only a small amount of repair and maintenance
works included.
These two issues could have an effect on the calculated labour demand and produce lower figures
than expected. We have developed a methodology to provide a complete picture of the labour
demand. The following steps are undertaken to provide an estimate of the total labour demand across
a region.
1. Only the new build projects arising from the Glenigan database were run through the LFT,
excluding any repair and maintenance work.
2. To estimate the full amount of new build work not captured in Glenigan we compared the
total Glenigan new build spend in the region (East of England) with the output estimates for
the CSN for the peak year, 2016. This allowed us to estimate the new build spend for the entire
region not included in the Glenigan database from which we could then factor the
corresponding output for the New Anglia LEP area.
18
New Anglia LEP
Construction Labour Research
February 2016
3. The non-Glenigan new build spend calculated in the previous step was assigned to different
sectors, reflecting the mix of works recorded in Glenigan for New Anglia. A separate item was
created for each construction sector (e.g. general infrastructure, housing) and assigned a
value proportional to each sector’s contribution to the pipeline spend in Glenigan͘
4. To calculate the R&M elements of work taking place within the LEP, the CSN output data was
used to calculate the ratio of R&M to new build work in the East of England. We assumed this
ratio to be constant throughout the region.
5. The LFT was used to calculate the labour demand profile based on the values of different types
of work estimated above.
6. Labour demand for 2016 was then projected forward and backcast as required throughout
the period analysed. For this process we used the construction employment growth factors
applied previously to the known projects.
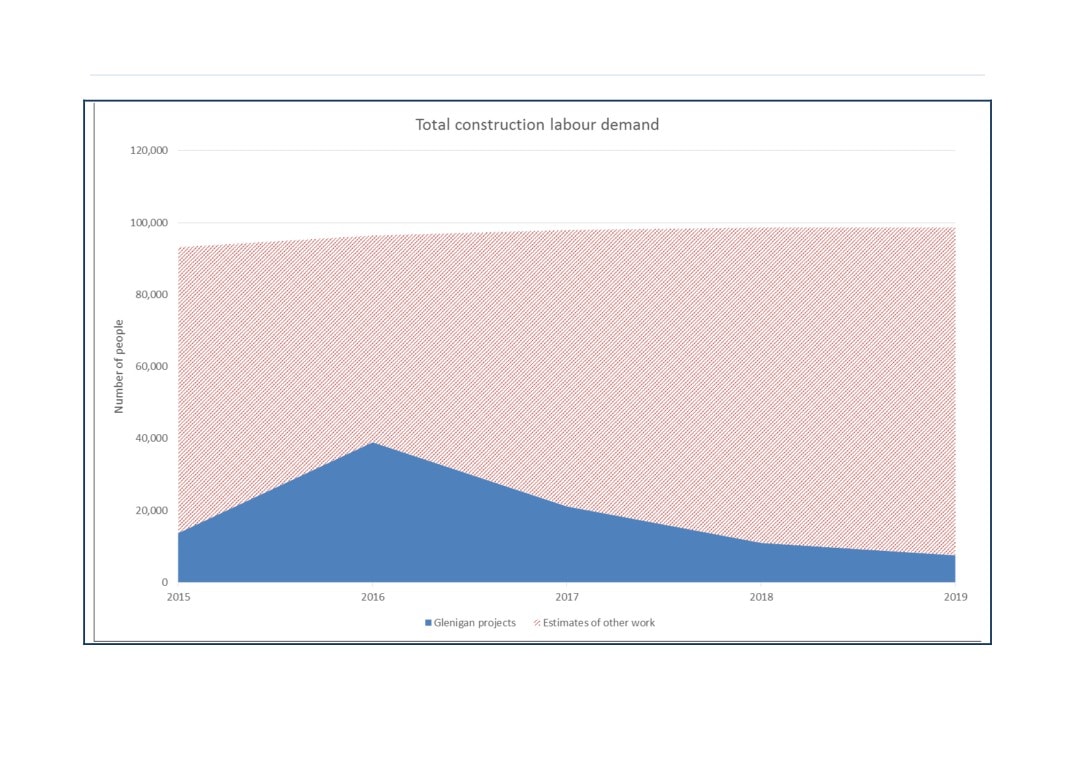
3.5.2. Updated labour demand calculations and projections
Table 7 shows the labour demand arising from the entire pipeline of projects including the allowance
we made for R&M amounting to 96,350 people in 2016, the peak year of Glenigan data, including the
allowance made for R&M. The demand is shown in Figure 6. The total labour demand rises from
93,250 people in 2015 to a peak of 98,700 people in 2019.
Table 9: Total labour demand in the New Anglia LEP area
Area
Glenigan labour
Undefined potential
Average workforce
demand
projects labour
during 2016
demand
2015-2019
2015-2019
Norfolk
57,600
202,450
51,650
Suffolk
34,850
189,950
44,650
New Anglia
92,450
392,400
96,350
19
New Anglia LEP
Construction Labour Research
February 2016
Figure 6: Total construction labour demand including estimate for R&M and projects not in the Glenigan database
20
New Anglia LEP
Construction Labour Research
February 2016
Neighbouring regions
This section provides an overview of the large projects and related developments and frameworks
that are current or are scheduled to begin within the next five years in the four counties in close
proximity to the New Anglia LEP: Essex, Cambridgeshire, Peterborough and Lincolnshire. The Mean
Value Theorem was applied twice to identify the significant projects measured by their average annual
spend in Glenigan. Table 10 presents the spending profiles of these projects. Values are given in 2015
values.
21
New Anglia LEP
Construction Labour Research
February 2016
Table 10: Significant projects in neighbouring areas
Number
Description
Local Authority
Construction
Average Annual
Start Date
End Date
Project Type
Value (£m -
Spend (£m -
2015 values)
2015 values)
1
9 Eco Towns Masterplan
Cambridge
200.0
544.8
21/07/2015
02/12/2015
New Housing
2
Road Improvement Scheme
East
1,500.0
376.0
23/11/2015
18/11/2019
Infrastructure
Cambridgeshire
3
Road Improvement Scheme
Huntingdonshire
600.0
300.8
28/11/2016
26/11/2018
Infrastructure
4
Road Improvement Scheme
Cambridge
300.0
300.8
17/10/2016
16/10/2017
Infrastructure
5
3703 Residential/Schools/Care
South Kesteven
277.7
257.9
11/11/2015
08/12/2016
Private Commercial
Home/Commercial Units
6
Residential & Commercial
Peterborough
999.0
249.6
04/04/2016
04/04/2020
New Housing
7
Water/Wastewater Integrated Main Works
Peterborough
3,600.0
239.8
01/04/2015
01/04/2030
Public Non-housing
Capital Framework
8
5,015 Residential/Commercial Units
Huntingdonshire
270.0
230.8
06/07/2015
05/09/2016
New Housing
9
Water (Maintenance)
Peterborough
900.0
224.5
24/11/2014
26/11/2018
Infrastructure
10
Roads (Framework)
Cambridge
750.0
187.4
11/04/2016
11/04/2020
Infrastructure
11
2355 Houses/Flats/Schools/Commercial Units
Cambridge
176.6
164.5
09/11/2015
05/12/2016
New Housing
12
2202 Residential & Commercial Units
Uttlesford
142.3
132.2
01/08/2014
29/08/2015
New Housing
13
Energy Park
Peterborough
360.0
120.3
24/08/2015
20/08/2018
Infrastructure
14
4,005 Residential/Commercial Units
Cambridge
500.0
105.6
29/09/2011
23/06/2016
Private Commercial
15
1505 Houses/Flats/Student
Cambridge
112.9
104.8
22/07/2015
18/08/2016
New Housing
Accommodation/Commercial Units
16
Capital Works (Framework)
Colchester
400.0
99.9
30/09/2015
30/09/2019
Public Non-housing
17
Hospital Redevelopment
Cambridge
120.0
89.4
15/07/2015
16/11/2016
Public Non-housing
18
5 Research & Development Buildings
Cambridge
67.2
88.2
30/04/2016
02/02/2017
Private Industrial
22
New Anglia LEP
Construction Labour Research
February 2016
19
Airport (Refurbishment)
Uttlesford
80.0
80.0
01/10/2014
01/10/2015
Infrastructure
20
Offshore Wind Farm
East Lindsey
400.0
80.0
02/01/2017
02/01/2022
Infrastructure
21
1038 Residential/Care
Maldon
77.9
72.3
15/07/2016
12/08/2017
New Housing
Home/School/Commercial Units
22
3200 Residential Units & Commercial Land
Huntingdonshire
600.0
72.0
16/11/2015
16/03/2024
New Housing
23
5 Warehouse & Distribution Units
Peterborough
140.0
70.2
17/08/2015
14/08/2017
Private Industrial
24
1000 Houses/Flats & 3 School/Industrial &
Maldon
75.2
69.9
28/01/2016
24/02/2017
New Housing
Local Centre
25
900 Houses/Flats
South Holland
67.5
62.7
28/08/2015
24/09/2016
New Housing
26
Solar Photovoltaic Farm
North Kesteven
48.0
62.6
13/03/2017
18/12/2017
Infrastructure
27
Hospital
Cambridge
165.0
56.6
30/03/2015
26/02/2018
Public Non-housing
28
208 Houses/Flats
Cambridge
60.0
55.9
10/08/2015
05/09/2016
New Housing
29
800 Homes & 6 Commercial Units
Uttlesford
60.3
55.7
01/06/2016
01/07/2017
Private Commercial
30
233 Residential/Commercial Units
North Kesteven
55.0
55.2
04/01/2016
02/01/2017
New Housing
(New/Conversion)
31
Housing (External Works Programme)
Harlow
55.0
54.8
01/06/2015
01/06/2016
New Housing
32
Power Station (Expansion)
South Holland
160.0
53.5
01/07/2020
28/06/2023
Infrastructure
33
18 Industrial/Office/Distribution & Storage
Braintree
28.2
53.1
06/04/2016
17/10/2016
Private Industrial
Units
34
3,500 Homes, Commercial Units & 3 Schools
Cambridge
262.8
52.5
08/11/2016
09/11/2021
Private Commercial
35
750 Houses/Flats & 1 School/1 Enterprise
Braintree
56.4
52.4
16/06/2016
14/07/2017
New Housing
Centre
36
Shopping Centre (Extension/Refurbishment)
Peterborough
30.0
51.9
14/08/2016
13/03/2017
Private Commercial
37
Junction (Improvements)
Chelmsford
30.0
51.7
08/12/2014
08/07/2015
Infrastructure
38
Trunk Road (Dualling)
Colchester
203.0
50.7
04/05/2020
04/05/2024
Infrastructure
23
New Anglia LEP
Construction Labour Research
February 2016
39
Contractors Framework Agreement
Basildon
200.0
50.1
01/09/2014
27/08/2018
New Housing
40
Bypass
Lincoln
100.0
50.1
15/02/2016
12/02/2018
Infrastructure
41
Multi Storey Car Park
Uttlesford
48.9
48.9
11/07/2016
11/07/2017
Infrastructure
42
Key Worker Accommodation
Huntingdonshire
60.0
48.0
18/01/2016
18/04/2017
New Housing
43
Industrial & Commercial Development
Castle Point
22.7
42.6
04/11/2015
16/05/2016
Private Industrial
24
New Anglia LEP
Construction Labour Research
February 2016
Summary of demand
The analysis of the labour demand arising from the development spend in the New Anglia LEP peaks
at around 39,000 people in 2016. The tail off beyond this point is not likely to represent an actual drop
off in construction activity but reflects projects that have not yet been identified. It should also be
noted that these figures only represent the developments that are included in Glenigan, which will
not necessarily capture all of the construction activity. To project forward this cliff edge in construction
activity we have produced an indication of how construction activity in the region (East of England) as
a whole is forecast to change over the next five years. This shows a constantly increasing construction
spend and activity rising to almost 40,000 by 2019. The labour demand is split in roughly equal
proportions between Norfolk and Suffolk.
In the short-term, construction activity in the area is dominated by housing, with public non-
residential and infrastructure activity also comprising significant parts of the total spend, the latter
mostly owing to offshore wind installations in Norfolk. The largest occupational group is wood trades
and interior fit out, with a large labour demand arising from non-manual occupations.
The analysis was extended to include the work planned for Sizewell C Nuclear New Build, commencing
in 2021. The demand figures from NESA were used for the analysis and superimposed on the demand
in the East of England region, assuming that for the years beyond 2019, a steady yearly increase of
1.4% will be observed in the employment, equal to the average yearly increase for the period 2015-
2019 predicted by the CSN. It shows that across the two counties the peak demand at Sizewell
accounts for up to almost 10% of the rest of the workload. Should there be any changes in timescales
to the works then the increased demand will be delayed.
By supplementing the Glenigan pipeline with the data provided by the projections of non-Glenigan
new build and R&M work, we were able to produce a labour demand analysis that represented the
wider construction work taking place within the New Anglia LEP area in the period 2015-2019
incorporating the projected growth of the sector. According to these projections, the total labour
demand will rise to a number of around 98,700 people in 2019.
25
New Anglia LEP
Construction Labour Research
February 2016
A picture of supply
When looking at the supply of workers there are two main elements to consider: the size of the current
workforce and the existing amount of training.
The first element of this section takes a view on the current employment levels for the New Anglia
LEP, how this is made up from the local authorities of Norfolk and Suffolk, and then how this relates
to overall employment across the East of England Region͘ Data from CITB’s Construction Skills Network
is used along with official Government sources.
For the second section, while training occurs at Further Education (FE) and Higher Education (HE)
levels, the focus will be on FE that takes place in the New Anglia LEP and wider East of England Region.
FE tends to be sourced and delivered in a closer proximity to home and workplace, whereas the length
of study time and specialisms for Universities for HE can give greater degrees of mobility.
The demand forecasts can then be compared against employment, training and workforce mobility to
give an indication of possible gaps and/or occupational pinch points.
Main points
Current construction workforce estimates for the East of England are just over 247,000
workers.
New nglia LEP accounts for 24% of the East’s current construction employment (approx͘
59,500 workers).
Within the LEP construction employment is fairly evenly spread between the counties of
Norfolk and Suffolk (25,700 in Norfolk and 23,400 in Suffolk).
Construction businesses are also fairly evenly split between Norfolk and Suffolk with 3,885 in
Norfolk and 3,485 in Suffolk, and the size profile of these employers is the same across both
counties with the overwhelming majority (over 93%) being micro sized companies (0-9
employees) in both.
There were just under 5,600 Construction and Building Services Engineering learning aims
delivered in the LEP area, accounting for 6.5% of the total number of learning aims in
2012/139.
Twenty-eight training providers delivered construction relevant FE courses within the LEP
area, with the six main providers delivering almost two-thirds (64%) of all FE Construction and
Building Services Engineering learning.
9 Note: a leaner can have multiple learning aims depending upon the nature of the course learning.
26
New Anglia LEP
Construction Labour Research
February 2016
Existing workforce
Construction employment across the UK suffered significant declines during the recent recession, and
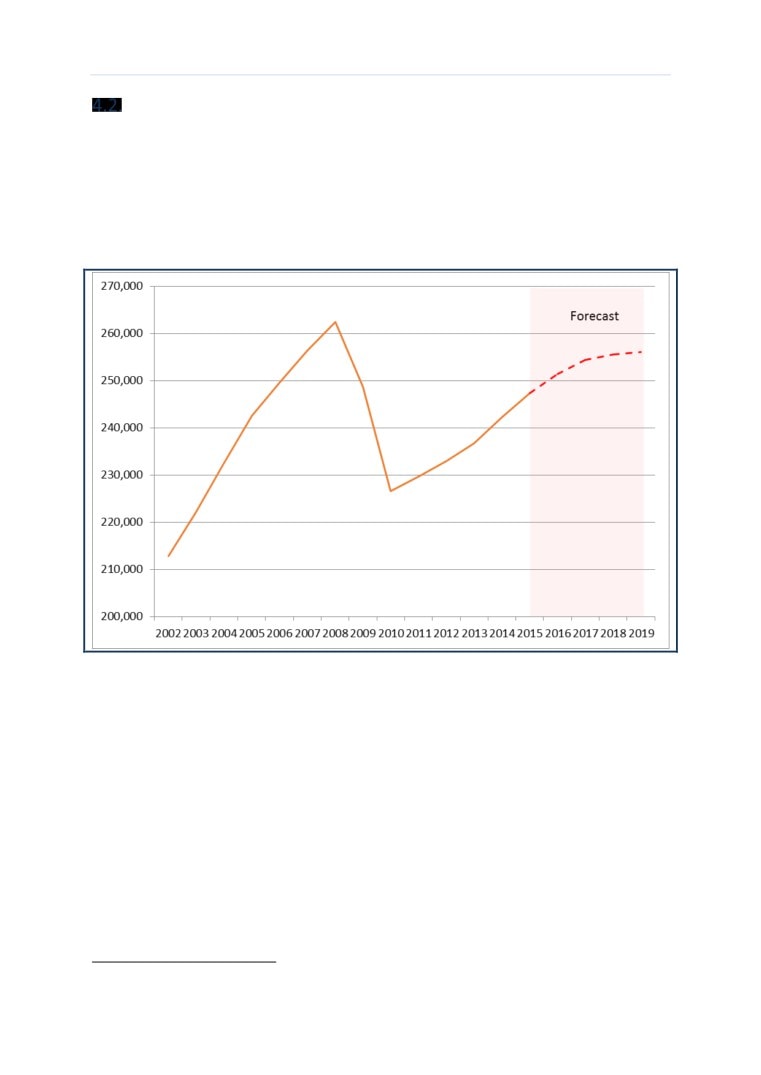
the East was no exception as shown in Figure 7 below. Employment in the region increased steadily
from just under 213,000 in 2002 to over 262,000 2008. The recession saw a steep fall in this figure to
a low of 226,600 workers two years later in 2010 before beginning to recover. By 2014 the number of
construction workers in the region had climbed to over 242,250, and the current CSN forecast is for
continued employment growth to just over 256,000 in 2019, although this will still be below its 2008
peak.
Figure 7: Construction employment in the East of England: 2002-2019 (Source: Experian & CITB)
An analysis of the Annual Population Survey10 gives an indication of the share of Eastern England’s
construction workforce located in the LEP. The latest data shows that the LEP area accounts for 24%
of regional construction employment, Table 11 below shows what this means for total employment
at occupational and industry level in the LEP region.
10 ONS/NOMIS (2015) Annual Population Survey workplace analysis by industry Jan-14 to Dec-14.
27
New Anglia LEP
Construction Labour Research
February 2016
Table 11: Construction occupational breakdown, 2015 (Source Experian & CITB)
New Anglia
East of
Occupation
LEP
England
Senior, executive, and business process managers
3,370
14,050
Construction project managers
1,100
4,590
Other construction process managers
3,990
16,610
Non-construction professional, technical, IT, and other office-based staff
8,450
35,200
Construction trades supervisors
1,380
5,730
Wood trades and interior fit-out
5,970
24,870
Bricklayers
1,940
8,090
Building envelope specialists
2,470
10,280
Painters and decorators
2,450
10,210
Plasterers
1,340
5,590
Roofers
940
3,920
Floorers
860
3,580
Glaziers
680
2,830
Specialist building operatives nec*
970
4,050
Scaffolders
650
2,700
Plant operatives
850
3,550
Plant mechanics/fitters
670
2,780
Steel erectors/structural fabrication
460
1,920
Labourers nec*
2,850
11,890
Electrical trades and installation
4,650
19,360
Plumbing and HVAC Trades
3,800
15,820
Logistics
720
3,020
Civil engineering operatives nec*
260
1,100
Non-construction operatives
390
1,620
Civil engineers
1,760
7,350
Other construction professionals and technical staff
3,930
16,380
Architects
1,280
5,330
Surveyors
1,190
4,950
Total
59,380
247,370
*nec - not elsewhere classified
Sub-regional analysis shows that in the New Anglia LEP area the construction workforce is more or
less evenly split between Norfolk and Suffolk (52% and 48% respectively), although there is
considerable difference in the levels of self-employment between Norfolk and Suffolk with over half
28
New Anglia LEP
Construction Labour Research
February 2016
the construction workforce in Norfolk being self-employed (51%) while just over one-third (35%) of
the Suffolk workforce is self-employed.
Employer Structure
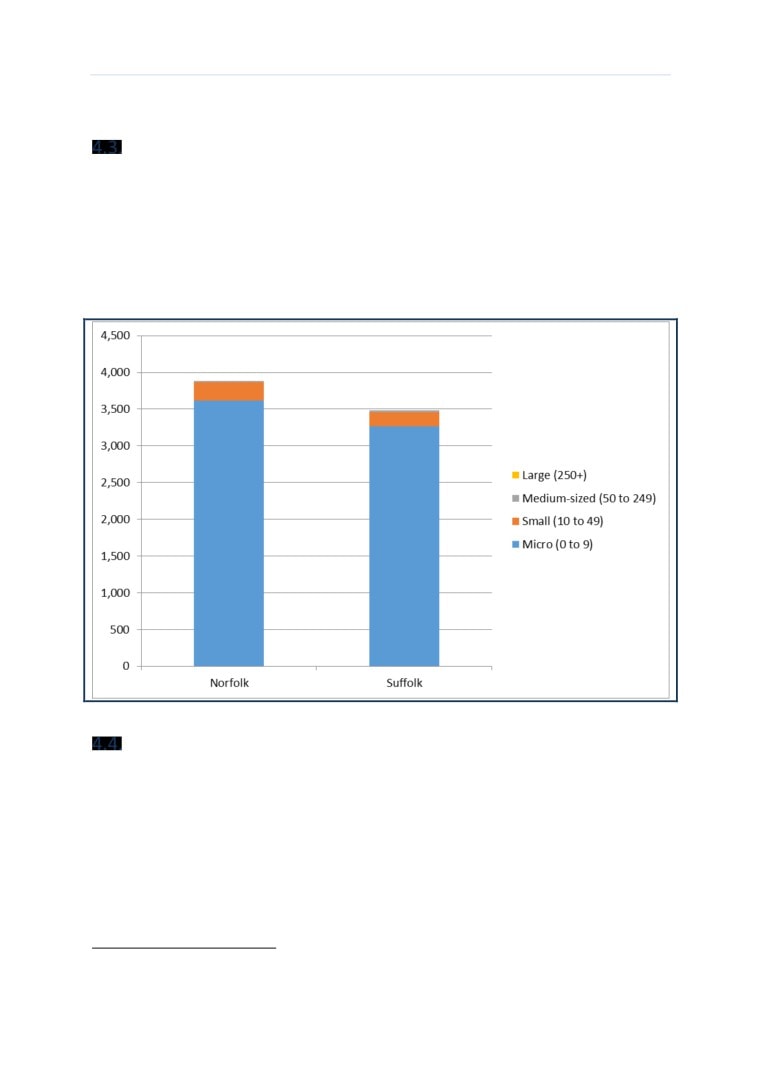
Analysis of construction firms reveals that just under a quarter (23%) of all construction firms within
Eastern England are located in the LEP area. As with employment, the number of employers are fairly
evenly split between Norfolk and Suffolk (53% and 47% respectively).
Overall the pattern of firm size is similar in each county, as shown in Figure 8, with just over 93% of
firms being micro (employing fewer than 10 people). There are five large employers (with more than
250 employees) in the New Anglia LEP area, although the numbers are too small to identify them any
further than this.
Figure 8: Construction firms by size, 2014 (Source: ONS/NOMIS)
Training provision
In terms of delivering skills to the construction workforce, further education providers play a
significant role in equipping people with vocational skills for all sectors of UK business, and for
construction in particular.
Data available at local authority level produced by the Skills Funding Agency11 shows that in Further
Education learner volumes, Norfolk and Suffolk accounted for just under 69,840 learners which
represents 25% of total provision in the East of England (all learners, all sectors).
11 Skills Funding Agency (2014) Overall FE and Skills Participation by Level and Age and by Region, Local Education Authority
and Local Authority (2005/06 to 2013/14) - Learner Volumes.
29
New Anglia LEP
Construction Labour Research
February 2016
Although the number of learners can be identified, it is more difficult to identify training as this is
reported by learning aims, and not the number of learners; ‘learners’ generally refers to the number
of individuals who are funded in each year, while the term ‘learning aims’ refers to the number of
discreet pieces of learning that are funded. It is possible for an individual to complete multiple learning
aims in each year, with each aim having some level of funding against it.
There are two main categories of learning aims relevant to the Construction Sector, Construction and
Building Services Engineering; together they accounted for almost 5,600 learning aims delivered in the
LEP area (Norfolk 2,980 and 6%; Suffolk 2,600 and 7%)12. This represents just over 6.5% of the total
number of learning aims across all sectors, and gives an indication of how construction training fits
within the overall FE provision which is lower than the 8% share that construction has for total
employment in the New Anglia LEP area.
Data from the Skills Funding Agency13 identified 28 training providers delivering FE and skills
Construction and Building Services Engineering learning at all levels across the LEP area, with the six
main providers being responsible for almost two-thirds of construction training, these are:
Peopleplus (was A4E LTD)
City College, Norwich
West Suffolk College
The College of West Anglia
Lowestoft College
National Construction College, CITB
Six further providers (Easton and Otley College, Suffolk New College, Great Yarmouth College, Norfolk
Training Services Ltd, JTL, and Norfolk County Council) deliver training volumes of around 100 - 400
aims per year along with a wider number that deliver learning aim volumes of less than 50 aims per
year. Although not identified in the figures, there will also be providers delivering training at very low
volumes such as less than 10 learning aims per year.
Note the training will cover full and part time further education, apprenticeships and on-site
assessment for qualifications such as National Vocational Qualifications (NVQs) and QCF Diplomas and
Certificates.
Data available from the Skills Funding Agency do not allow identification of course level detail,
however the websites of the main training providers (links in Appendix G) indicate that there is a range
of courses on offer that would relate to the main occupations, while also covering some of the
technical and higher level skills that would be relevant to work currently underway in the LEP and
future planned projects.
12 NOMIS - 2012/13, recognised sectors, all levels, all ages
13 Skills Funding Agency (2014): 2012/13 FE and Skills learning aims by delivery in each Local Authority by Provider and level
These learning aims include Apprenticeships, Workplace Learning, Community Learning and Education and Training
provision taken at General Further Education Colleges (including Tertiary), Sixth Form Colleges, Specialist Colleges and
External Institutions.
30
New Anglia LEP
Construction Labour Research
February 2016
Mobility of the workforce
The construction workforce is highly mobile, with workers tending to move from project to project
which may mean working in other counties or regions (or even countries) from where they usually
live. To measure the extent of this movement of workers, CITB commissioned research (Workforce
Mobility and Skills in the UK Construction Sector 2015) to provide a reliable evidence base of the
nature of the construction workforce in the UK concerning its qualification levels and the extent of
occupational and geographic mobility to offer insight into where skills gaps might emerge as a result
of occupational/geographic movement. The research provides data at a regional level so that future
training interventions and the supply of job opportunities for local people can be understood.
Main points
More than a quarter of East of England construction workers have worked in the construction
industry for over 20 years (27%) and a total of more than half have worked in the industry for
at least 10 years (52%).
At the time of the research just over half of all construction workers in the East of England
were working in the same region/nation in which they were living in when they started their
construction career (55%).
The average (mean) distance from workers’ current residence (taking into account temporary
residences) to their current site was 27 miles (22 miles is the UK average).
Three quarters of all East of England construction workers are confident that when they finish
their current job their next job will allow them to travel to work from their permanent home
on a daily basis (76%).
Overall two-fifths of all construction workers have only worked on one project type (40%).
Amongst construction workers under the age of 60 in the East of England, well over a third
(38%) believe they will definitely want to be working in the construction sector in five years’
time, a further third (33%) believe it is very likely they will, and 10% believe it is quite likely
they will. In total over four-fifths of workers in the region aged under 60 believe that it is likely
they will still be working in construction in five years’ time͘
Work history
More than a quarter of East of England construction workers have worked in the construction industry
for over 20 years (27%) and a total of more than half have worked in the industry for at least 10 years
(52%).
The most likely reason for employees working in the East of England region is because their employers
sent them there (50% of all workers), this compares to just 36% for the UK as a whole, suggesting a
greater reliance on workers from other regions than may be typical in other parts of the UK. Just over
two-fifths (43%) of workers in the East state that they work in the region because they grew up there,
this compares to 55% across the whole of the UK.
In terms of the regions/nations in which workers’ current employer operates, around two-thirds (67%)
of workers in the East of England reported that their employer operated within the region they were
currently working in (the second lowest figure in the UK after the South East at 65%), while 27%
operated in London, 23% in the South East and 16% in the East Midlands, as shown in Appendix H.
These figures suggest the workforce in the East is more transitory that might be expected in other
regions.
31
New Anglia LEP
Construction Labour Research
February 2016
Worker origins
Workers were asked which region/nation they were living in just before they got their first job in
construction in the UK. Overall just over half of all construction workers in the East of England were
working in the same region/nation in which they were living in when they started their construction
career (55%) the same as for the South East and slightly higher than London at 50%. Workers currently
based in the East of England, therefore, are among the least likely to have remained in the same
region/nation in which they were based for their first construction job.
In addition, only half of the construction workers in the East of England (50%) have remained in the
same region/nation as they did their first qualification/training in. This is the lowest proportion of all
the regions/nations in the UK, meaning that workers in the East are the most mobile. Among other
regions/nations, the figure ranges from 55% of workers in the South East remaining in the area where
they took their first qualification to 96% in Northern Ireland.
Travel to site
Almost two-thirds (63%) of construction workers in the East of England have their current residence
in the region, with 37% travelling into the region for work from another region/nation in which their
current residence is based. Only the South East had a higher figure for inward travel to work with 42%
of workers living outside the region. At the time of the survey 12% of construction workers in the East
had travelled into the region from the East Midlands, and a further 12% had travelled in from London.
Workers in the East were asked to indicate the furthest distance they have worked from their
permanent or current home in the last 12 months. Figure 9 shows that 1 in 8 construction workers
have worked no more than 20 miles away (12%) and a further third have worked between 21 and 50
miles away (34%). This leaves more than half that have worked more than 50 miles away from their
permanent home (52%), with more than a quarter that have worked between 51 and 100 miles away
(29%). Just under a quarter of construction workers in the East that have worked more than 100 miles
away (23%) which is about average for the UK.
32
New Anglia LEP
Construction Labour Research
February 2016
40%
35%
30%
25%
20%
15%
10%
5%
0%
0-20 miles
21-50 miles
51-100 miles
100+ miles
Figure 9: Furthest distance worked in past 12 months (CITB, 2015)
Site duration and change
In order to get a measure of workplace stability, workers were asked to indicate how long in total they
expect to work at that specific site during this phase.
Three in ten construction workers in the East of England (30%) do not expect to work on that site for
more than a month, including 7% that only expect to be there for about a week or less. About 4 in 10
anticipated being on site for more than a month, but less than a year (39%), while one in eight expects
to stay on that site for a year or longer (13%). In just under 1 in 5 cases (18%) workers did not know
how much longer they could expect to be on site, indicating that a significant minority of temporary
workers are living with a certain amount of uncertainty and insecurity.
Three quarters of all construction workers in the East of England are confident that when they finish
this job they will get a job that allows them to travel from their permanent home to work on a daily
basis (70%).
Sub-sector and sector mobility
All workers were asked which of six types of construction work (New Housing, Housing Repair and
Maintenance, Commercial, Private Industrial, Public Non-Housing, or Infrastructure) they have spent
periods of at least three months at a time working in (Table 12).
Overall two fifths of all construction workers have only worked on one project type (40%), compared
with a fifth in 2012 (19%), which again suggests a pattern of increased stability in the sector.
33
New Anglia LEP
Construction Labour Research
February 2016
Table 12: Type of projects spent significant periods on (CITB, 2015)
EE 2015
EE 2012
UK 2015
%
%
%
New housing
77
80
83
Housing repair and maintenance including
36
47
36
extensions/loft conversions
Commercial work such as shops, office, pubs etc
39
61
35
Private industrial work such as factories, warehousing,
36
57
30
mechanical engineering, land reclamation
Public non-housing work such as schools, sports
39
68
33
facilities, landscaping
Infrastructure building projects, such as
road/rail/airport, sewerage/water treatment, power
23
35
21
stations
ONE TYPE ONLY
40
19
48
TWO TYPES
18
13
14
THREE TYPES
11
15
11
FOUR TYPES
10
16
8
FIVE TYPES
8
20
9
SIX TYPES
11
15
9
Leaving the sector
In order to assess the potential outflow from the sector in the next five years (based on workers’
preferences), all workers were asked how likely it is that in 5 years’ time they will still want to be
working in construction. Excluding those aged 60 and over (as those over 60 may be assumed to be
considering retirement in the next five years): 38% believe they will definitely want to be working in
the construction sector, 33% believe it is very likely they will want to be working in the construction
sector and 10% believe it is quite likely they will want to be working in the construction sector, a total
of 81%. Only 5% think that they will not want to be working in the construction sector in five years’
time which is less than in 2012 (18%).
Overall the findings from the Mobility survey indicate that the East of England has one of the most
mobile construction workforces in the UK. There is evidence of a high degree of movement between
neighbouring regions, (specifically nearly one-quarter of the workforce is from either the East
Midlands or London).
34
New Anglia LEP
Construction Labour Research
February 2016
Demand against supply
Main points
Before looking at demand against supply, it should be noted that the Glenigan dataset used to produce
the demand view is based on projects that are picked up at various stages of the planning process. As
such there will be projects in the pipeline that may not go ahead or be subject to delay; additionally
there will be newer projects that will be added to the list. In this respect the view is essentially a
snapshot of what potential work could look like.
When looking forward, there will be less visibility on future projects, especially for work that requires
shorter planning times. Research carried out by CITB on behalf of UKCG (Figure 10, unpublished)
showed that the lead time from planning to work starting on site varied by the type of work and value.
Large scale infrastructure and commercial projects took the longest time whereas lower value work
in general along with work in the industrial sector was able to get on site quickest.
Figure 10: Average number of weeks from planning to work on site, UK 2010-2013 (Source: UKCG/Glenigan)
There will also be work carried out that does not require planning permission, for example household
repair and maintenance (R&M) work, and this can account for a significant share of work in the
construction sector. Current estimates for R&M work in the East of England indicate that it accounts
for 48% of yearly construction output in the region14 well above the UK average of 39%.
Also in looking at demand against supply, while different types of projects can be categorised by their
type of build, such as housing, commercial and industrial, the workforce skills required are less easy
to categorise in the same way as some occupations will be able to apply their skills across a number
of different sectors. For example, evidence from the 2015 Mobility research15 shows that occupations
such as plasterers and banksmen/bankspersons are most likely to have only worked on one project
14 CITB(2015) Construction Skills Network - East of England
15 CITB(2015) Workforce Mobility and Skills in the UK Construction Sector - East of England
35
New Anglia LEP
Construction Labour Research
February 2016
type, while bricklayers, site managers, dryliners, and scaffolders are more likely to have worked on a
wide range of building projects.
In general, as discussed in the Mobility section, construction workers in the East of England are
amongst the most mobile in the country, which suggests that the supply of workers for future projects
will be supplemented by workers from outside the area.
Gap Analysis
At peak activity which is forecast to occur in August 2016, there would be an estimated monthly
demand of over 47,500 workers; for the whole of 2016 and 2017 there would be average monthly
demands of 39,000 workers and 21,150 workers respectively. As Table 13 shows, peak demand and
then the average yearly demand figures based on the work identified would account for a significant
share of the current workforce employed within the LEP.
Area
Peak Demand (Aug 2016)
2016 Average Demand
(% of 2015 employment)
(% of 2015 employment)
New Anglia LEP
80%
66%
Table 13: Demand as a % of 2015 employment (Source: CITB/WLC)
The demand details covered in Section 3 show that work across the LEP will require involvement from
the full range of construction occupations across the timeline. Analysis of the occupational groups
used in the CSN, which can be compared to estimates of current employment allows examination of
both yearly demand and peak demand (as highlighted in Table 14).
36
New Anglia LEP
Construction Labour Research
February 2016
Table 14: Occupational breakdown of demand for New Anglia LEP (Source CITB/WLC)
DEMAND
PEAK
Average 2016
(Aug 2016)
Occupations
Senior, executive, and business process managers
81%
67%
Construction Project Managers
67%
55%
Other construction process managers
77%
63%
Non-construction professional, technical, IT, and other office-based staff
(excl. managers)
70%
57%
Construction Trades Supervisors
67%
55%
Wood trades and interior fit-out
86%
70%
Bricklayers
59%
53%
Building envelope specialists
78%
70%
Painters and decorators
70%
59%
Plasterers and dry Liners
85%
61%
Roofers
104%
83%
Floorers
42%
41%
Glaziers
107%
72%
Specialist building operatives not elsewhere classified (nec*)
122%
100%
Scaffolders
90%
71%
Plant operatives
100%
82%
Plant mechanics/fitters
97%
80%
Steel erectors/structural
86%
90%
Labourers nec*
103%
84%
Electrical trades and installation
62%
48%
Plumbing and heating, ventilation, and air conditioning trades
73%
60%
Logistics
66%
54%
Civil engineering operatives not elsewhere classified
170%
140%
Non-construction operatives
344%
281%
Civil engineers
82%
67%
Other construction professionals and technical staff
79%
65%
Architects
51%
42%
Surveyors
108%
88%
Total
80%
66%
This analysis shows that there are some possible disparities where demand either outstrips or matches
the current employment estimates for a number of occupations. These are:
37
New Anglia LEP
Construction Labour Research
February 2016
Non-construction operatives.16
Civil engineering operatives not elsewhere classified (nec).17
Specialist building operatives nec.18
Surveyors.
Glaziers.
Roofers.
Labourers nec.
Plant operatives.
For each of these occupations, peak demand exceeds current employment and average employment
in 2015 and 2016 is more than 20 percentage points higher than the average for all occupations for
either or both years.
Of these occupations the main risks look to be around the future supply of:
Non-construction operatives.
Civil engineering operative not elsewhere classified.
Specialist building operatives not elsewhere classified.
All of these will all be in high demand, based on both their share of forecasted employment, and the
absolute numbers required.
It is interesting to note that the analysis forecasts potential shortfalls across a wide range of
occupations based on their skillsets, qualification levels and those traditionally working across other
sectors. The following discussion categorises the occupations between those which are construction
specific and those which also work in other sectors.
5.2.1.
Construction specific occupations
The category of Civil engineering operatives nec covers occupations that include road construction,
rail construction and maintenance, and quarry workers. Within these areas they cover higher
qualification occupations up to degree level, as such there can be at least three years of education
and training before becoming qualified. It is, therefore, highly likely that the short-term demand
increase identified would require workers to be drawn into the LEP area.
While the skill requirement for Labourers nec (which are all elementary construction occupations)
may not be as high as trades such as carpentry, roofing and the like, some may see it as a way of
gaining construction experience. The risk here is the number required and the amount and availability
of training that would be needed for them to work safely on construction sites, however this is likely
to be focused on the number of candidates from within the LEP area that are willing to take up
labouring roles.
16 General occupation title that covers: Metal making and treating process operatives, Process operatives nec*, Metal
working machine operatives, Water and sewerage plant operatives, Assemblers (vehicles and metal goods), Routine
inspectors and testers, Assemblers and routine operatives nec, Elementary security occupations, Cleaners and domestics,
Street cleaners, Gardeners and landscape gardeners, Caretakers, Security guards and related occupations, Protective
service associate professionals
17 General occupation title that covers: Road construction operatives, Rail construction and maintenance operatives,
Quarry workers and related operatives
18 General occupation title that covers: Construction operatives nec, Construction and building trades nec Industrial
cleaning process occupations, Other skilled trades nec
38
New Anglia LEP
Construction Labour Research
February 2016
The demand for Surveyors is certainly linked to an increasing demand for higher level skills that sits
across construction in general. As well as a degree there is a requirement for two to three years of
further training to become a fully qualified surveyor, so the only way that demand in this occupation
can be met is by recruiting workers from outside the region. Given their integral nature to every part
of the construction process, especially at the commencement of construction activities, supply of
skilled workers in this occupation will need consideration.
Both Glaziers and Roofers account for relatively few workers. While the overall demand in these
occupations is relatively small when compared to other trades, in comparison to base employment it
represents a significant recruitment risk. In addition, owing to their niche nature, training
opportunities for these occupations tend to be lower than other trades.
Specialist building operatives nec covers a range of occupations that have specialised and niche skills
predominately used for repair and refurbishment, this type of work tends to be more labour intensive
and consequently they are in high demand throughout the forecast period. Dependent upon the type
of specialism required the current training provision within the LEP may be able to train some of the
demand, but there may be a necessity to export from other regions.
5.2.2.
Cross-sector occupations
As skills in these occupations can be used in other sectors, the degree to which demand can be met
will be influenced by factors other than construction demand.
Non-construction operatives tend to provide support roles and do not rely on construction specific
skills, therefore employment in this group can be subject to general market conditions. Although
there is a significant increase in percentage terms, the impact would need to be examined in more
detail against wider workforce/job projections.
Plant Operatives move between construction and other sectors such as manufacturing and
wholesale/distribution. Appendix G suggests that there is only one sizable provider of plant training
in the region, so there may need to be some reliance on recruitment from outside the region.
In regards to how demand fits with existing training provision, Appendix G highlights that the five main
colleges across the LEP cover a wide range of construction training and qualifications. However it
should be noted that although construction work will generate a training demand, other factors such
as the requirement to have a qualification in relation to a competence card (Construction Skills
(CPCS)
the-cpcs/) and delivering training to people leaving school, will also have a bearing on what training is
required.
As noted earlier, there will be other work carried out in the LEP area that does not require planning
permission, which will not have been captured in the demand analysis. With the level of demand
identified taking up most of the workforce, and given the mobility factors outlined above, it is very
likely that workers will need to be drawn in from outside the LEP to meet demand.
Long term construction employment forecast
The Construction Skills Network provides a forecast for construction employment by region and
occupation for the next five years. In numbers terms the East of England’s total employment is
predicted to increase by almost 14,000 in the five years to 2020, from just over 237,700 in 2015 to just
under 251,700 in 2020.
39
New Anglia LEP
Construction Labour Research
February 2016
Given that 24% of construction workers in the East of England are based in the New Anglia LEP area,
it is possible to use the CSN forecast for the region to estimate the changes to the LEP workforce over
the next five years. The LEP construction workforce would be expected to increase by around 3,300
- 3,400 workers between 2015 and 2020.
The Annual Recruitment Requirement (ARR) is a gross requirement that takes into account workforce
flows into and out of construction, due to factors such as movements between industries, migration,
sickness, and retirement. It provides an indication of the number of new employees that would need
to be recruited into construction each year in order to realise forecast output.
The East of England’s RR for 2016-2020 is 3,900. This is higher than the overall increase in the
construction workforce due to the negative effect of people leaving the industry. It represents 1.6%
of base 2016 employment, similar to the UK average of 1.7%.
The ARR for the New Anglia area would be expected to be in the region of 900-950 additional recruits
per year (in addition to the workforce flows and movement in and out of the industry outlined above).
The occupations most in demand over the 2016-2020 forecast period will be:
Electrical trades and installers - 165 ARR
Labourers nec - 120 ARR
Painters and Decorators - 100 ARR
There is some cross-over between the short term requirements outlined by the Glenigan data and
these longer term forecasts, in that both predict a demand for Labourers nec. In addition, recruitment
into the following occupations will be needed:
Electrical trades and installers - these are generally associated with the final fit-out phase of most
construction projects once the main building work has been completed. Training provision within
these trades is generally plentiful and geared towards both vocational and certification of operatives;
as such it is not anticipated that this relatively high ARR should cause undue problems for the industry
within the LEP.
Likewise Painters and Decorators are most in demand at the end of building projects. As one of the
main four construction trades, training is generally readily available at FE colleges and private training
providers across the country. It is also one of the few construction occupations to have relatively high
demand from female applicants, so again there should be no shortage of supply across the LEP for this
occupation.
40
New Anglia LEP
Construction Labour Research
February 2016
Conclusions and recommendations
Summary of Concluding Remarks
This section makes recommendations drawn from the demand and supply analysis and the
requirement for any additional construction based provision that should be considered as part of the
wider New Anglia Construction Action Plan.
The analysis of the labour demand arising from project spend in the New Anglia LEP peaks at
around 39,000 people in 2016.
The tail off beyond this point is not likely to represent an actual drop off in construction
activity but reflects projects that have not yet been identified. To project forward this cliff
edge in construction activity we have produced an indication of how construction activity in
the region (East Anglia) as a whole is forecast to change over the next five years. This shows a
constantly increasing construction spend and activity rising to almost 40,000 by the end of the
decade. These figures only represent the developments that are included in Glenigan, which
will not necessarily capture all of the construction activity.
There will be significant construction activity across the repair and maintenance sector that is
not captured as part of this detailed analysis but will impact demand. Equally ‘unknown’
projects that sit below the £250,000 value are not captured in the pipeline analysis but should
potentially be considered as part of future demand. The scenario analysis produced at section
3.5 of this report demonstrates that the average construction workforce in New Anglia could
rise to 96,350 in 2016.
The labour demand is split in roughly equal proportions between Norfolk and Suffolk.
In the short-term, construction activity in the area is dominated by housing, (for the peak year,
2016, more than 50% of the labour requirement is housing related) with public non-residential
and infrastructure activity also comprising significant parts of the total spend, the latter mostly
owing to offshore wind installations in Norfolk.
The largest occupational group is wood trades and interior fit out, with a large labour demand
arising from non-manual occupations.
The analysis was extended to include the work planned for Sizewell C Nuclear New Build,
commencing in 2021. The demand figures from NESA were used for the analysis and
superimposed on the demand in the East of England region, assuming that for the years
beyond 2019, a steady yearly increase of 0.9% will be observed in the employment, equal to
the average yearly increase for the period 2015-2019 predicted by the CITB Construction Skills
Network.
It shows that across the two counties the peak demand at Sizewell accounts for up to almost
10% of the rest of the workload. Should there be any changes in timescales to the works then
the increased demand will be delayed.
Current construction workforce estimates for the East of England are just over 247,000
workers.
New Anglia LEP accounts for 24% of the East’s current construction employment (approx͘
59,500 workers).
The recession impacted the East of England region significantly regarding its construction
workforce (note this is measured by region and not LEP area) reaching a low in 2010 before
recovery commenced, though it has still not reached its 2008 peak.
41
New Anglia LEP
Construction Labour Research
February 2016
There is significant construction based opportunity in neighbouring LEP areas including Essex,
Peterborough, Cambridgeshire and Lincolnshire. This heightens the risk of construction
workers based in New Anglia commuting to other LEP areas for more attractive opportunities.
Within the LEP construction employment is fairly evenly spread between the counties of
Norfolk and Suffolk (25,700 in Norfolk and 23,400 in Suffolk).
Construction businesses are also fairly evenly split between Norfolk and Suffolk with 3,885 in
Norfolk and 3,485 in Suffolk, and the size profile of these employers is the same across both
counties with the overwhelming majority (over 93%) being micro sized companies (0-9
employees) in both.
There were just under 5,600 Construction and Building Services Engineering learning aims
delivered in the LEP area, accounting for 6.5% of the total number of learning aims in
2012/1319.
Twenty-eight training providers delivered construction relevant FE courses within the LEP
area, with the six main providers delivering almost two-thirds (64%) of all FE Construction and
Building Services Engineering learning.
55% of all construction workers in the East of England were working in the same region where
their career started.
63% of construction workers in the East of England also live in the region with 37% travelling
in from other areas.
When comparing demand with supply potential gaps exist in non-construction operatives, civil
engineering operatives, specialist building operatives and also surveyors, glaziers, roofers,
labourers and plant operatives are occupations to monitor.
Recommendations
Given the demand profile of projects within the pipeline in the New Anglia area and the pull
that major projects will have on the pool of available suitability qualified labour there is a clear
need for a dedicated Construction Action Plan underpinned by an Investment Plan that will
enable the skills challenges to be acted on a regularly updated evidence base that will inform
decision making. Feedback from stakeholders states that they want a partnership between
the business community, client side and education providers.
Whilst the major project at Sizewell will have a significant impact there is considerable
opportunity that sits outside of the project particularly in the housing sector, and this
represents a real opportunity for the LEP to support business and education providers through
a well-developed partnership approach as described in the dedicated Construction Action Plan
above.
A number of risks need to be managed and mitigated, particularly regarding the peak demand
levels next year. These include ensuring the local labour force can benefit from the
opportunities materialising, ensuring skills gaps are addressed through training interventions
in both the short and longer term and that curriculum across the area is well planned. Further
strong links need to be formed between employers and educational providers at both HE and
FE level to co-develop and co-design modules to support specialist learning relating directly to
delivery. Whilst it is not possible to assess the exact skills gaps and shortages relating to
unknown projects and repair & maintenance, the scenario produced suggests that New
19 Note: a leaner can have multiple learning aims depending upon the nature of the course learning.
42
New Anglia LEP
Construction Labour Research
February 2016
Anglia will experience significant activity in this area and this heightens the need for a
flexible and mobile workforce.
Occupations highlighted as having pinch-points should form part of an early action plan to
assess what short-term interventions can be activated to address these concerns and identify
funding that can be utilised to pump-prime short term training interventions.
Image and recruitment into the industry remains a constant issue. Given the demand profile
for the LEP area it is vital that stakeholders work together to create a campaign to promote
the construction industry and clear career pathways for all members of society to pursue a
construction based career. This includes apprentices, graduates, the long term unemployed,
adult returners and new entrants, regardless of ethnicity or gender.
Commission regularly updated Labour Market Intelligence (LMI) to provide an evidence base
that supports decision making and demonstrates to tomorrow’s construction workers both
the opportunities in construction in the pipeline and the future vision. Labour Market
intelligence should be updated as least yearly.
Explore the opportunity to create a Shared Apprenticeship Scheme across the LEP area that
can benefit from employer collaboration and the range of projects on the horizon.
Promote innovation through initiatives developed between employers and universities to
understand the impact of technological change in the sector, particularly in relation to major
projects.
Explore, with commissioning clients, how procurement good practice can drive employment
and skills opportunities and influence the behaviour of suppliers to achieve greater social
value.
43
New Anglia LEP - Construction Labour Research
Technical Appendices
Client: New Anglia LEP
Author: Sandra Lilley, Doug
Forbes and Martin Turner
Approved by: CITB
Date: 12/02/16
New Anglia LEP
Construction Labour Research
February 2016
Table of contents
TABLE OF CONTENTS
I
APPENDIX A. METHODOLOGICAL NOTE ABOUT THE LFT
1
APPENDIX B. OCCUPATIONAL DEFINITIONS
3
APPENDIX C. SIGNIFICANT GLENIGAN PROJECTS AND CORRESPONDING
LOCAL AUTHORITIES
10
APPENDIX D. GLENIGAN PROJECTS REMOVED AND THEIR
CORRESPONDING LOCAL AUTHORITIES
18
APPENDIX E. CONSTRUCTION LABOUR DEMAND FOR EACH
OCCUPATIONAL GROUP
22
APPENDIX F. CONSTRUCTION LABOUR DEMAND PER LOCAL AUTHORITY
IN THE LEP
25
F.1.
NORFOLK
26
F.2.
SUFFOLK
28
APPENDIX G. TRAINING PROVIDER OVERVIEW
30
APPENDIX H. REGION/NATION EMPLOYER OPERATES IN, COMPARED
WITH REGION/NATION WORKING IN CURRENTLY
48
i
New Anglia LEP
Construction Labour Research
February 2016
Appendix A. Methodological note about the LFT
The Labour Forecasting Tool (LFT) was used to develop a profile of estimated labour requirements in
the LEP area. The tool creates a bottom up approach to skills forecasting by aggregating the
employment from individual projects to create an area-specific profile. The Labour Forecasting Tool
can predict labour requirements (i.e. number of operatives and managers) on a month-by-month and
trade-by-trade basis given no more than the type of project, its value or gross floor area where
appropriate, its location and its start and end dates. The LFT produces an indication of the total
construction labour demand arising for that project. The labour for the project may or may not stem
from within the immediate vicinity and in some cases (eg professionals) be based in another part of
the country.
The projects analysed were assigned the most appropriate project model in the LFT’s database͘ For
the scope of this analysis, the following models were used:
Housing
Public Non-residential
Private Commercial
Private Industrial
Housing R&M
Non-housing R&M
Airports
Biomass
Bridges
Flooding
Gas Transmission/distribution
General Infrastructure
Generation (Renewables - Offshore)
Generation (Renewables - Onshore)
Mixed Rail (Track, stations, E&P etc)
Nuclear Decommissioning
Photovoltaics
Ports
Roads
Science & Research
Stations (Underground/Network rail)
Undefined Energy
WTW/WWTW
1
New Anglia LEP
Construction Labour Research
February 2016
Construction employment is broken down into 28 occupation groups20.
The labour demand is shown in two ways:
1. Total Person Years - the total person years for each occupation required for the project. This
output takes no account of the project duration which has been given in the original data. For
instance if the total person years were 50, this means that if the project lasts for one year
there would be 50 people employed for one year; if it lasted for two years then there would
be an average of 25 people employed each year.
2. Peak workforce - this is the highest number of people involved with the construction process
throughout the whole development. The month for which the peak occurs is also provided. It
should be noted that the peak labour demand refers to the current “snapshot” of the
scheduled development spend. It is prudent to expect that, should the investment in future
years follow the same pattern, the peak demand figures are likely to be similar for future
years, assuming the mix of projects remains consistent.
20 The employment profile is disaggregated by 28 occupational groups within the LFT. Details of these groups are given in
Appendix B.
2
New Anglia LEP
Construction Labour Research
February 2016
Appendix B. Occupational definitions
Reference is made in this report to a range of occupational aggregates for construction occupations.
This appendix contains details of the 166 individual occupations which are aggregated into 28
occupational aggregates.
3
New Anglia LEP
Construction Labour Research
February 2016
Appendix Table B-1: Detailed breakdown of construction occupation groups
Occupations included within construction occupational aggregates (Four-digit codes refer to Office for
National Statistics Standard Occupational Classification Codes).
1 Senior, executive, and business process managers)
(1115) Chief executives and senior officials
(1131) Financial managers and directors
(1132) Marketing and sales directors
(1133) Purchasing managers and directors
(1135) Human resource managers and directors
(1251) Property, housing and estate managers
(1136) Information technology and telecommunications directors
(2150) Research and development managers
(1162) Managers and directors in storage and warehousing
(1259) Managers and proprietors in other services nec
(1139) Functional managers and directors nec
(2133) IT specialist managers
(2134) IT project and programme managers
(3538) Financial accounts managers
(3545) Sales accounts and business development managers
2 Construction project managers
(2436) Construction project managers and related professionals
3 Other construction process managers
(1121) Production managers and directors in manufacturing
(1122) Production managers and directors in construction
(1161) Managers and directors in transport and distribution
(1255) Waste disposal and environmental services managers
(3567) Health and safety officers
(3550) Conservation and environmental associate professionals
4 Non-construction professional, technical, IT, and other office-based staff (excl. managers)
4
New Anglia LEP
Construction Labour Research
February 2016
(3131) IT operations technicians
(3132) IT user support technicians
(3534) Finance and investment analysts and advisers
(3535) Taxation experts
(3537) Financial and accounting technicians
(3563) Vocational and industrial trainers and instructors
(3539) Business and related associate professionals nec
(3520) Legal associate professionals
(3565) Inspectors of standards and regulations
(2136) Programmers and software development professionals
(2139) Information technology and telecommunications professionals nec
(3544) Estate agents and auctioneers
(2413) Solicitors
(2419) Legal professionals nec
(2421) Chartered and certified accountants
(2424) Business and financial project management professionals
(2423) Management consultants and business analysts
(4216) Receptionists
(4217) Typists and related keyboard occupations
(3542) Business sales executives
(4122) Book-keepers, payroll managers and wages clerks
(4131) Records clerks and assistants
(4133) Stock control clerks and assistants
(7213) Telephonists
(7214) Communication operators
(4215) Personal assistants and other secretaries
(7111) Sales and retail assistants
(7113) Telephone salespersons
(3541) Buyers and procurement officers
(3562) Human resources and industrial relations officers
(4121) Credit controllers
(4214) Company secretaries
(7129) Sales related occupations nec
(7211) Call and contact centre occupations
(7219) Customer service occupations nec
(9219) Elementary administration occupations nec
(2111) Chemical scientists
(2112) Biological scientists and biochemists
5
New Anglia LEP
Construction Labour Research
February 2016
(2113) Physical scientists
(3111) Laboratory technicians
(3421) Graphic designers
(2463) Environmental health professionals
(2135) IT business analysts, architects and systems designers
(2141) Conservation professionals
(2142) Environment professionals
(2425) Actuaries, economists and statisticians
(2426) Business and related research professionals
(4124) Finance officers
(4129) Financial administrative occupations nec
(4138) Human resources administrative occupations
(4151) Sales administrators
(4159) Other administrative occupations nec
(4162) Office supervisors
(7130) Sales supervisors
(7220) Customer service managers and supervisors
(4161) Office managers
5 Construction Trades Supervisors
(5250) Skilled metal, electrical and electronic trades supervisors
(5330) Construction and building trades supervisors
6 Wood trades and interior fit-out
(5315) Carpenters and joiners
(8121) Paper and wood machine operatives
(5442) Furniture makers and other craft woodworkers
(5319) Construction and building trades nec (25%)
7 Bricklayers
(5312) Bricklayers and masons
8 Building envelope specialists
(5319) Construction and building trades nec (50%)
9 Painters and decorators
(5323) Painters and decorators
(5319) Construction and building trades nec (5%)
10 Plasterers
(5321) Plasterers
11 Roofers
(5313) Roofers, roof tilers and slaters
6
New Anglia LEP
Construction Labour Research
February 2016
12 Floorers
(5322) Floorers and wall tillers
13 Glaziers
(5316) Glaziers, window fabricators and fitters
(5319) Construction and building trades nec (5%)
14 Specialist building operatives not elsewhere classified (nec)
(8149) Construction operatives nec (100%)
(5319) Construction and building trades nec (5%)
(9132) Industrial cleaning process occupations
(5449) Other skilled trades nec
15 Scaffolders
(8141) Scaffolders, stagers and riggers
16 Plant operatives
(8221) Crane drivers
(8129) Plant and machine operatives nec
(8222) Fork-lift truck drivers
(8229) Mobile machine drivers and operatives nec
17 Plant mechanics/fitters
(5223) Metal working production and maintenance fitters
(5224) Precision instrument makers and repairers
(5231) Vehicle technicians, mechanics and electricians
(9139) Elementary process plant occupations nec
(5222) Tool makers, tool fitters and markers-out
(5232) Vehicle body builders and repairers
18 Steel erectors/structural fabrication
(5311) Steel erectors
(5215) Welding trades
(5214) Metal plate workers, and riveters
(5319) Construction and building trades nec (5%)
(5211) Smiths and forge workers
(5221) Metal machining setters and setter-operators
19 Labourers nec
(9120) Elementary construction occupations (100%)
20 Electrical trades and installation
(5241) Electricians and electrical fitters
(5249) Electrical and electronic trades nec
(5242) Telecommunications engineers
7
New Anglia LEP
Construction Labour Research
February 2016
21 Plumbing and heating, ventilation, and air conditioning trades
(5314) Plumbers and heating and ventilating engineers
(5216) Pipe fitters
(5319) Construction and building trades nec (5%)
(5225) Air-conditioning and refrigeration engineers
22 Logistics
(8211) Large goods vehicle drivers
(8212) Van drivers
(9260) Elementary storage occupations
(3541) Buyers and purchasing officers (50%) 3541
(4134) Transport and distribution clerks and assistants
23 Civil engineering operatives not elsewhere classified (nec)
(8142) Road construction operatives
(8143) Rail construction and maintenance operatives
(8123) Quarry workers and related operatives
24 Non-construction operatives
(8117) Metal making and treating process operatives
(8119) Process operatives nec
(8125) Metal working machine operatives
(8126) Water and sewerage plant operatives
(8132) Assemblers (vehicles and metal goods)
(8133) Routine inspectors and testers
(8139) Assemblers and routine operatives nec
(9249) Elementary security occupations nec
(9233) Cleaners and domestics
(9232) Street cleaners
(5113) Gardeners and landscape gardeners
(6232) Caretakers
(9241) Security guards and related occupations
(3319) Protective service associate professionals nec
25 Civil engineers
(2121) Civil engineers
26 Other construction professionals and technical staff
8
New Anglia LEP
Construction Labour Research
February 2016
(2122) Mechanical engineers
(2123) Electrical engineers
(2126) Design and development engineers
(2127) Production and process engineers
(2461) Quality control and planning engineers
(2129) Engineering professionals nec
(3112) Electrical and electronics technicians
(3113) Engineering technicians
(3114) Building and civil engineering technicians
(3119) Science, engineering and production technicians nec
(3121) Architectural and town planning technicians
(3122) Draughtspersons
(3115) Quality assurance technicians
(2432) Town planning officers
(2124) Electronics engineers
(2435) Chartered architectural technologists
(3531) Estimators, valuers and assessors
(3116) Planning, process and production technicians
27 Architects
(2431) Architects
28 Surveyors
(2433) Quantity surveyors
(2434) Chartered surveyors
9
New Anglia LEP
Construction Labour Research
February 2016
Appendix C. Significant Glenigan projects and corresponding local
authorities
10
New Anglia LEP
Construction Labour Research
February 2016
Value (£m -
Number
Description
Local Authority
Start Date
End Date
Project Type
2015 values)
1
Offshore Wind Farm
Norfolk
400.0
01/04/2016
01/04/2020
Infrastructure
2
5,000 Eco Homes
Norfolk
375.0
09/10/2017
04/10/2021
New Housing
3
Offshore Wind Farm
Norfolk
360.0
01/04/2016
01/04/2019
Infrastructure
4
Minor/Major/Maintenance Works Framework
Norfolk
244.3
01/04/2015
03/04/2019
Public Non-housing
5
Wind Farm Development
Norfolk
108.0
30/04/2018
27/01/2020
Infrastructure
6
Offshore Wind Farm
Norfolk
100.0
20/08/2017
20/08/2019
Infrastructure
7
Offshore Wind Farm
Norfolk
100.0
12/06/2016
09/06/2019
Infrastructure
8
1000 Residential Units Development Partner
Norfolk
80.9
13/07/2015
08/07/2019
New Housing
9
Biomass Power Plant
Norfolk
80.0
02/03/2015
31/05/2017
Infrastructure
10
Social Infrastructure Framework
Norfolk
73.9
01/04/2015
01/04/2019
New Housing
11
910 Houses/Flats/School/Village Hall/Shop Units
Norfolk
68.3
03/03/2016
31/03/2017
New Housing
12
850 Residential Units/1 School & Commercial Units
Norfolk
63.8
29/12/2014
27/06/2016
New Housing
13
1110 Residential Units/1 School & Commercial Units
Norfolk
60.9
01/08/2016
29/07/2019
Private Commercial
14
CCGT Power Station
Norfolk
60.0
05/06/2017
05/12/2019
Infrastructure
15
Centre for Food & Health
Norfolk
55.0
04/01/2016
09/07/2018
Private Industrial
16
Solar Photovoltaic Array
Norfolk
48.0
02/02/2015
09/11/2015
Infrastructure
17
800 Residential Units & 1 School/Local Centre
Norfolk
44.6
05/10/2015
03/09/2018
Private Commercial
18
Commercial Units
Norfolk
42.6
14/09/2015
11/09/2017
Private Industrial
19
Council Office (Refurbishment)
Norfolk
32.0
04/03/2013
06/05/2016
Public Non-housing
20
Junction (Improvements)
Norfolk
30.0
11/04/2016
11/04/2017
Infrastructure
21
Junction (Improvements)
Norfolk
30.0
11/04/2016
11/04/2017
Infrastructure
22
390 Residential Units
Norfolk
29.3
08/02/2016
08/02/2020
Private Commercial
11
New Anglia LEP
Construction Labour Research
February 2016
Value (£m -
Number
Description
Local Authority
Start Date
End Date
Project Type
2015 values)
23
Student Accommodation
Norfolk
27.5
27/04/2015
15/08/2016
New Housing
24
270 Houses/70 Flats & Industrial Units
Norfolk
25.5
11/02/2016
10/03/2017
New Housing
25
176 Houses & 1 Employment Development
Norfolk
24.5
24/11/2014
24/11/2017
New Housing
26
Solar Farm
Norfolk
20.8
24/08/2015
21/08/2017
Infrastructure
27
437 Apartments & Commercial Units
Norfolk
20.0
01/05/2016
01/05/2018
New Housing
28
300 Residential & Commercial Developments
Norfolk
19.7
26/10/2015
24/07/2017
Private Commercial
29
322 Houses & 13 Flats
Norfolk
19.6
02/09/2013
02/11/2015
New Housing
30
300 Residential Units
Norfolk
17.6
13/10/2014
07/11/2016
Private Commercial
31
75960 Solar Photovoltaic Panels
Norfolk
16.9
23/11/2015
29/08/2016
Infrastructure
32
275 Residential Units
Norfolk
16.2
23/11/2015
18/12/2017
Private Commercial
33
Care Village Development
Norfolk
15.0
29/09/2014
15/01/2016
Private Commercial
34
34 Plant Rooms
Norfolk
15.0
30/07/2014
30/12/2015
Private Commercial
35
244 Houses & 6 Flats
Norfolk
14.8
04/04/2016
02/04/2018
New Housing
36
Animal Sheds
Norfolk
14.0
18/02/2016
30/08/2016
Private Commercial
37
115 Houses & 62 Flats
Norfolk
13.3
13/05/2016
10/06/2017
New Housing
38
172 Residential Units
Norfolk
12.9
16/05/2016
13/06/2017
New Housing
39
112 Houses & 29 Flats/25 Bungalows
Norfolk
12.5
20/06/2016
17/07/2017
New Housing
40
165 Houses
Norfolk
12.4
20/07/2016
17/08/2017
New Housing
41
100 Houses & 65 Flats
Norfolk
12.4
31/07/2016
28/08/2017
New Housing
42
Solar Farm
Norfolk
12.0
16/02/2015
14/12/2015
Infrastructure
43
16 Supermarket & Commercial Units
Norfolk
11.0
07/04/2015
30/10/2015
Private Commercial
44
Student Accommodation & Commercial Units
Norfolk
10.0
23/06/2014
10/08/2015
New Housing
12
New Anglia LEP
Construction Labour Research
February 2016
Value (£m -
Number
Description
Local Authority
Start Date
End Date
Project Type
2015 values)
45
132 Houses
Norfolk
9.9
04/04/2016
15/05/2017
New Housing
46
126 Residential Units
Norfolk
9.5
12/09/2015
09/10/2016
New Housing
47
Shop
Norfolk
9.0
20/10/2014
18/09/2015
Private Commercial
48
66 Flats
Norfolk
9.0
27/07/2015
25/07/2016
New Housing
49
120 Houses & Flats
Norfolk
9.0
27/07/2015
22/08/2016
New Housing
50
109 Houses & 8 Flats
Norfolk
8. 8
12/02/2016
11/03/2017
New Housing
51
115 Residential Units
Norfolk
7.1
22/12/2014
25/09/2015
New Housing
52
Multi Storey Car Park/Office/Cafe Building
Norfolk
7.0
05/01/2015
21/09/2015
Private Commercial
53
College Skills Building (Extension)
Norfolk
6.5
05/01/2015
05/09/2015
Public Non-housing
54
Solar Farm
Norfolk
6.4
07/09/2015
07/03/2016
Infrastructure
55
Nursery
Norfolk
6.2
20/03/2016
17/10/2016
Private Commercial
56
School Building
Norfolk
6.2
06/05/2015
28/01/2016
Public Non-housing
57
2 Retail Units (Extension/Alterations)
Norfolk
5.4
06/07/2015
01/02/2016
Private Commercial
58
Multi Storey Car Park
Norfolk
4.9
17/08/2015
21/03/2016
Infrastructure
59
2 Animal Buildings
Norfolk
4.3
27/01/2016
08/08/2016
Private Commercial
60
18920 Solar Panels
Norfolk
4.2
15/08/2016
15/02/2017
Infrastructure
61
Solar Farm
Norfolk
4.0
15/08/2016
15/02/2017
Infrastructure
62
853 Residential/School/Visitor Centre/Commercial Units
Suffolk
150.0
04/01/2016
29/12/2025
New Housing
63
Residential Units/Care Home/School/Local Centre
Suffolk
144.3
02/09/2015
02/04/2019
Private Commercial
64
Construction Related Framework
Suffolk
135.9
01/06/2015
01/06/2019
Public Non-housing
65
Warehouse
Suffolk
120.8
07/12/2015
07/12/2017
Private Industrial
66
Distribution Unit
Suffolk
100.0
27/07/2015
22/05/2017
Private Industrial
13
New Anglia LEP
Construction Labour Research
February 2016
Value (£m -
Number
Description
Local Authority
Start Date
End Date
Project Type
2015 values)
67
Gas Fired Power Station
Suffolk
80.0
26/09/2016
27/05/2019
Infrastructure
68
1152 Residential/Commercial Units
Suffolk
64.4
07/10/2015
07/10/2018
Private Commercial
69
500 Residential Units & 1 Local Centre
Suffolk
60.0
23/12/2015
19/01/2017
New Housing
70
Container Port
Suffolk
45.0
14/04/2014
11/04/2016
Private Industrial
71
8 Cinema/Restaurants & Gym (Extension/Refurb)
Suffolk
35.0
02/11/2015
13/06/2016
Private Commercial
72
Offshore Wind Farm
Suffolk
33.6
06/04/2015
06/04/2017
Infrastructure
73
375 Residential Units & 2 School/Community Units
Suffolk
28.3
03/02/2016
02/03/2017
New Housing
74
School
Suffolk
27.5
31/08/2015
28/02/2017
Public Non-housing
75
320 Residential Units & Employment/Retail Units
Suffolk
24.0
29/05/2016
26/06/2017
New Housing
76
150 Houses & 150 Flats/1 Changing Rooms
Suffolk
22.6
11/04/2016
06/04/2020
New Housing
77
270 Houses/6 Flats & 1 Convenience Store
Suffolk
20.8
06/01/2016
02/02/2017
New Housing
78
227 Houses & 39 Flats
Suffolk
20.0
11/12/2015
07/01/2017
New Housing
79
Supermarket & Petrol Filling Station
Suffolk
19.0
08/12/2014
04/04/2016
Private Commercial
80
227 Residential Units
Suffolk
17.0
18/01/2016
18/01/2018
New Housing
81
Relief Road
Suffolk
15.00
30/11/2015
30/11/2016
Infrastructure
82
190 Houses
Suffolk
14.3
02/03/2016
30/03/2017
New Housing
83
Dry Fuel Store
Suffolk
14.0
13/01/2014
07/09/2015
Private Industrial
84
185 Residential Units
Suffolk
13.9
12/08/2016
09/09/2017
New Housing
85
48 Flats & 7 Commercial Units
Suffolk
13.1
03/10/2016
01/05/2017
Private Commercial
86
191 Houses & 24 Flats/Commercial Units
Suffolk
12.9
25/02/2016
25/01/2018
New Housing
87
138 Houses & 30 Flats/2 Bungalows
Suffolk
12.8
14/12/2015
09/01/2017
New Housing
88
166 Houses
Suffolk
12.5
20/10/2014
16/11/2015
New Housing
14
New Anglia LEP
Construction Labour Research
February 2016
Value (£m -
Number
Description
Local Authority
Start Date
End Date
Project Type
2015 values)
89
137 Houses/17 Flats/12 Bungalows
Suffolk
12.5
29/08/2015
25/09/2016
New Housing
90
200 Houses
Suffolk
12.3
11/11/2015
11/09/2017
New Housing
91
155 Residential Units & 1 Care Home
Suffolk
11.7
25/11/2015
05/01/2017
New Housing
92
190 Houses/Flats
Suffolk
11.7
29/07/2015
29/03/2017
New Housing
93
190 Residential Units
Suffolk
11.7
10/08/2015
05/06/2017
Private Commercial
94
281 Residential Units
Suffolk
11.5
16/06/2014
13/06/2016
New Housing
95
150 Houses & Employment Units
Suffolk
11.3
03/03/2016
03/03/2017
New Housing
96
125 Houses/14 Flats/5 Bungalows & 4 Business Units
Suffolk
11.1
10/08/2016
07/09/2017
New Housing
97
123 Houses & 24 Bungalows
Suffolk
11.0
22/01/2016
18/02/2017
New Housing
98
77 Houses
Suffolk
10.7
01/07/2014
29/12/2015
New Housing
99
138 Houses & 1 Community Centre
Suffolk
10.4
07/02/2016
06/03/2017
New Housing
100
Wetland Habitat Works
Suffolk
10.0
10/08/2015
25/04/2016
Public Non-housing
101
5 Industrial Units (Alterations)
Suffolk
10.0
03/11/2014
03/11/2015
Private Industrial
102
Leisure/Pier Complex (Extension/Refurb)
Suffolk
10.0
07/03/2016
07/07/2017
Public Non-housing
103
132 Houses
Suffolk
9.9
06/01/2016
02/02/2017
New Housing
104
100 Houses/22 Flats & 1 Community Centre
Suffolk
9.2
21/08/2016
18/09/2017
New Housing
105
113 Houses & 7 Bungalows
Suffolk
9.0
06/09/2015
03/10/2016
New Housing
106
140 Homes/Office/Light Industry
Suffolk
8.7
07/09/2015
05/06/2017
New Housing
107
87 Houses & 20 Flats
Suffolk
8.0
08/10/2015
04/11/2016
New Housing
108
124 Residential Units
Suffolk
7.8
18/03/2016
18/10/2017
Private Commercial
109
Medical/Dental Centre
Suffolk
7.5
22/06/2015
17/10/2016
Public Non-housing
110
School
Suffolk
7.2
08/02/2016
08/02/2017
Public Non-housing
15
New Anglia LEP
Construction Labour Research
February 2016
Value (£m -
Number
Description
Local Authority
Start Date
End Date
Project Type
2015 values)
111
School
Suffolk
7.2
08/02/2016
08/02/2017
Public Non-housing
112
School
Suffolk
7.2
08/02/2016
08/02/2017
Public Non-housing
113
School
Suffolk
7.2
08/02/2016
08/02/2017
Public Non-housing
114
School
Suffolk
7.2
08/02/2016
08/02/2017
Public Non-housing
115
School
Suffolk
7.2
08/02/2016
08/02/2017
Public Non-housing
116
14 Flats/1 Restaurant/1 Industrial Unit/1 Shop & 1 Museum
Suffolk
7.0
17/08/2015
14/11/2016
New Housing
117
Office Building
Suffolk
6.3
11/11/2015
15/08/2016
Private Commercial
118
Office Block
Suffolk
6.3
15/08/2016
15/05/2017
Private Commercial
119
School (Extension)
Suffolk
6.0
28/09/2015
20/06/2016
Public Non-housing
120
Bridge
Suffolk
6.0
28/03/2016
28/12/2016
Infrastructure
121
2 Hotels
Suffolk
6.0
07/09/2015
07/09/2016
Private Commercial
122
13 Lodges/2 Hotels & 2 Energy Centre/Workshop Units
Suffolk
6.0
04/07/2016
31/07/2017
New Housing
123
78 Houses
Suffolk
5.9
30/12/2015
26/01/2017
New Housing
124
50 Houses & 27 Flats
Suffolk
5.8
28/04/2016
26/05/2017
New Housing
125
Hospital Services Department
Suffolk
5.6
06/05/2016
08/02/2017
Public Non-housing
126
4 Light Industrial/Warehouse Units
Suffolk
5.5
26/04/2016
06/11/2016
Private Industrial
127
72 Beach Huts
Suffolk
5.4
04/10/2015
31/10/2016
New Housing
128
Supermarket
Suffolk
5.1
05/10/2015
03/10/2016
Private Commercial
129
Cold Store Building
Suffolk
5.1
21/03/2016
01/10/2016
Private Industrial
130
School
Suffolk
5.0
19/06/2014
17/07/2015
Public Non-housing
131
Industrial Warehouse/Distribution Centre & Office
Suffolk
5.0
04/11/2015
16/05/2016
Private Industrial
132
Hospital (Extension)
Suffolk
4.2
23/03/2015
18/01/2016
Public Non-housing
16
New Anglia LEP
Construction Labour Research
February 2016
Value (£m -
Number
Description
Local Authority
Start Date
End Date
Project Type
2015 values)
133
Shopping Centre (Refurbishment/Extension)
Suffolk
4.0
11/05/2015
12/10/2015
Private Commercial
134
Storage Building
Suffolk
3.9
27/10/2015
08/05/2016
Private Industrial
135
Poultry Building
Suffolk
3.7
03/05/2016
13/11/2016
Private Commercial
17
New Anglia LEP
Construction Labour Research
February 2016
Appendix D. Glenigan projects removed and their corresponding local
authorities
18
New Anglia LEP
Construction Labour Research
February 2016
Value (£m -
Reason for
Local
Number
Description
2015
Start Date
End Date
Project Type
omission
Authority
values)
1
Glasshouses (Extension)
Norfolk
-
29/06/2015
09/02/2016
Private Industrial
Missing value
2
180 Houses
Norfolk
13.50
-
-
New Housing
Missing date(s)
3
170 Houses
Norfolk
12.75
-
-
New Housing
Missing date(s)
4
140 Houses/Bungalows/Flats
Norfolk
10.50
-
-
New Housing
Missing date(s)
5
5 Community/Church/Day Care/Creche/Museum/Commercial
Norfolk
6.50
-
-
Public Non-housing
Missing date(s)
Units (Extension/Alteration
6
School (New/Refurb.)
Norfolk
5.00
-
-
Public Non-housing
Missing date(s)
7
33 Residential Units
Norfolk
2.48
-
-
Private Commercial
Missing date(s)
8
17 Houses & 10 Flats
Norfolk
2.03
-
-
New Housing
Missing date(s)
9
26 Residential Units
Norfolk
1.90
-
-
New Housing
Missing date(s)
10
10 Houses & 6 Flats
Norfolk
1.20
-
-
New Housing
Missing date(s)
11
Railway Track Works
Norfolk
1.00
-
-
Infrastructure
Missing date(s)
12
Air Livery Development
Norfolk
1.00
-
-
Private Industrial
Missing date(s)
13
Medical Centre
Norfolk
1.00
-
-
Public Non-housing
Missing date(s)
14
11 Houses (New/Conversion)
Norfolk
0.83
-
-
New Housing
Missing date(s)
15
8 Flats, 3 Houses & 1 Commercial Unit
Norfolk
0.77
-
-
New Housing
Missing date(s)
16
Hotel Function Room (Extension)
Norfolk
0.75
-
-
Private Commercial
Missing date(s)
17
Leisure Centre (Extension/Refurbishment)
Norfolk
0.50
-
-
Public Non-housing
Missing date(s)
18
Anaerobic Digestion Development
Norfolk
0.50
-
-
Infrastructure
Missing date(s)
19
Restaurant & Take Away
Norfolk
0.46
-
-
Private Commercial
Missing date(s)
20
Training Building (Extension)
Norfolk
0.37
-
-
Public Non-housing
Missing date(s)
21
Storage Building
Norfolk
0.26
-
-
Private Industrial
Missing date(s)
22
Consultants Framework
Norfolk
3.62
27/10/2014
27/09/2018
New Housing
Consultancy
19
New Anglia LEP
Construction Labour Research
February 2016
Value (£m -
Reason for
Local
Number
Description
2015
Start Date
End Date
Project Type
omission
Authority
values)
23
Architectural & Design Services
Norfolk
2.1
04/01/2016
04/10/2016
Public Non-housing
Consultancy
24
600 New Homes
Norfolk
80.00
05/10/2015
02/09/2020
New Housing
Duplicate
25
600 Dwellings
Norfolk
80.00
05/10/2015
08/10/2018
New Housing
Duplicate
26
81 Flats/5 Town Houses & 1 Office (New/Extension)
Norfolk
4.35
18/10/2015
14/11/2016
New Housing
Duplicate
27
24 Luxury Houses & 4 Houses
Norfolk
1.60
28/05/2013
31/07/2015
New Housing
Duplicate
28
24 Luxury Houses & 4 Houses
Norfolk
2.10
14/07/2014
10/08/2015
New Housing
Duplicate
29
10 Flats & 1 Retail Unit
Norfolk
0.55
06/12/2015
02/01/2017
New Housing
Duplicate
30
81 Flats/5 Town Houses & 1 Office (New/Extension)
Norfolk
4.35
09/10/2015
05/11/2016
New Housing
Duplicate
31
130 Residential Units
Norfolk
9.75
14/08/2016
11/09/2017
New Housing
Duplicate
32
3 College Buildings (Redevelopment)
Suffolk
9.35
-
-
Public Non-housing
Missing date(s)
33
Supermarket
Suffolk
5.00
-
-
Private Commercial
Missing date(s)
34
Innovation Centre
Suffolk
5.00
-
-
Private Industrial
Missing date(s)
35
Employee Facility
Suffolk
4.50
-
-
Public Non-housing
Missing date(s)
36
2 Industrial Units (New/Extension)
Suffolk
4.12
-
-
Private Industrial
Missing date(s)
37
2 Plastic Bottle Manufacturing/Storage Plants
Suffolk
3.20
-
-
Private Industrial
Missing date(s)
38
Industrial Workshop/Research Facility & Office
Suffolk
1.75
-
-
Private Industrial
Missing date(s)
39
2 Industrial Units
Suffolk
1.60
-
-
Private Industrial
Missing date(s)
40
25 Houses (New/Conversion)
Suffolk
1.50
-
-
New Housing
Missing date(s)
41
School Classrooms/Sports Hall (Extension)
Suffolk
1.20
-
-
Public Non-housing
Missing date(s)
42
Swimming Pool (Refurbishment)
Suffolk
1.00
-
-
Public Non-housing
Missing date(s)
43
Motel
Suffolk
0.84
-
-
Private Commercial
Missing date(s)
44
Footbridge (Upgrade)
Suffolk
0.75
-
-
Infrastructure
Missing date(s)
45
Sea Defence Works
Suffolk
0.50
-
-
Public Non-housing
Missing date(s)
20
New Anglia LEP
Construction Labour Research
February 2016
Value (£m -
Reason for
Local
Number
Description
2015
Start Date
End Date
Project Type
omission
Authority
values)
46
Church (Extension)
Suffolk
0.50
-
-
Public Non-housing
Missing date(s)
47
2 Commercial Units (New/Refurbishment)
Suffolk
0.48
-
-
Private Commercial
Missing date(s)
48
Demolition (Refurb)
Suffolk
0.40
-
-
Public Non-housing
Missing date(s)
49
Hotel/Public House Bedrooms (Extension)
Suffolk
0.30
-
-
Private Commercial
Missing date(s)
50
Horticultural Nursery (Restoration)
Suffolk
0.25
-
-
Public Non-housing
Missing date(s)
51
School
Suffolk
27.46
04/01/2016
27/09/2016
Public Non-housing
Duplicate
52
150 Houses & 150 Flats/1 Changing Rooms
Suffolk
22.58
27/07/2016
24/08/2017
New Housing
Duplicate
53
Military Base (Refurb)
Suffolk
16.50
13/10/2014
13/02/2020
Public Non-housing
Duplicate
54
Waste Transfer Station
Suffolk
2.41
28/02/2016
06/12/2016
Infrastructure
Duplicate
55
Waste Transfer Station
Suffolk
2.41
05/03/2016
12/12/2016
Infrastructure
Duplicate
56
Office Block
Suffolk
1.11
02/11/2015
25/01/2016
Private Commercial
Duplicate
57
100 Houses/22 Flats & 1 Community Centre
Suffolk
9.23
21/08/2016
18/09/2017
New Housing
Duplicate
58
School Classbase (Extension)
Suffolk
0.33
11/05/2016
12/01/2017
Public Non-housing
Duplicate
21
New Anglia LEP
Construction Labour Research
February 2016
Appendix E. Construction labour demand for each occupational group
22
New Anglia LEP
Construction Labour Research
February 2016
Occupation
Total construction labour demand arising from the development spend in the LEP
Average workforce during year of peak
Peak workforce
Senior, executive, and business process managers
2,250
2,750
Construction project managers
600
750
Other construction process managers
2,500
3,050
Non-construction professional, technical, IT, and other
4,850
5,900
office-based staff (excl. managers)
Construction trades supervisors
750
950
Wood trades and interior fit-out
4,200
5,150
Bricklayers
1,050
1,350
Building envelope specialists
1,700
2,200
Painters and decorators
1,450
2,200
Plasterers and dry liners
800
1,200
Roofers
800
1,050
Floorers
350
600
Glaziers
500
750
Specialist building operatives not elsewhere classified (nec*)
950
1,200
Scaffolders
450
600
Plant operatives
700
850
Plant mechanics/fitters
550
650
Steel erectors/structural
400
600
Labourers nec*
2,400
2,950
Electrical trades and installation
2,250
3,000
23
New Anglia LEP
Construction Labour Research
February 2016
Occupation
Total construction labour demand arising from the development spend in the LEP
Average workforce during year of peak
Peak workforce
Plumbing and heating, ventilation, and air conditioning
2,300
2,800
trades
Logistics
400
450
Civil engineering operatives not elsewhere classified (nec*)
350
450
Non-construction operatives
1,100
1,350
Civil engineers
1,200
1,450
Other construction professionals and technical staff
2,550
3,100
Architects
550
650
Surveyors
1,050
1,300
Total
39,000
47,550
24
New Anglia LEP
Construction Labour Research
February 2016
Appendix F. Construction labour demand per local authority in the LEP
25
New Anglia LEP
Construction Labour Research
February 2016
F.1. Norfolk
26
New Anglia LEP
Construction Labour Research
February 2016
27
New Anglia LEP
Construction Labour Research
February 2016
F.2. Suffolk
28
New Anglia LEP
Construction Labour Research
February 2016
29
New Anglia LEP
Construction Labour Research
February 2016
Appendix G. Training provider overview
30
New Anglia LEP
Construction Labour Research
February 2016
Provider
Website
Apprenticeships/
Vocational Courses
Higher/Further Education
Short duration
Traineeships/New Entrants
City College of
Apprenticeships
C&G Level 3 Diploma in
BTEC HND in Construction
Norwich
Bricklaying
Plumbing
and the Built Environment
Plumbing
BTEC Level 3 Diploma in
(one year top-up form City
Carpentry
Construction and the Built
College BTEC HNC)
Electrotechnical
Environment
BTEC HNC in Construction and
Vehicle Maintenance & Repair
Level 2 Plumbing Certificate
the Built Environment
Level 2 Diploma in
Maintenance Operations
Level 2 Diploma oin
Electrotechnical Technology
Level 2 Craft Diploma in Site
Carpentry/ Bench Joinery
Level 1 Diploma in Plumbing
Studies
Level 1 Access to Building
Services Engineering
Certificate
Level 1 Certificate in Building
Craft Occupations
Level 1 Craft Diploma in
Bricklaying
Level 1 Craft Diploma in
Carpentry and Joinery
Level 1 Diploma in Electrical
Installations
31
New Anglia LEP
Construction Labour Research
February 2016
College of West
Apprenticeships
Brickwork - Level 2 (Diploma)
BTEC HNC Diploma in
Training for Work
Anglia
Brickwork (Trowel
Brickwork - Level 3 (Diploma)
Mechanical Engineering -
Unvented Hot Water Storage
Occupations in Construction) -
Carpentry and Joinery - Level
Level 4
Systems
Apprenticeship (Intermediate)
2 (Diploma)
Diploma in Construction
Water Regulations/Bylaws
- Level 2
Carpentry and Joinery - Level
(HNC) - Level 4
CSCS Card - Level 1 Award
Brickwork - (Trowel
3 (Diploma)
HNC in Civil Engineering -
Health & Safety in the
Occupations in Construction)
Construction - Level 1 -
Level 4 (Day Attendance)
Construction Environment
Apprenticeship (Advanced) -
Extended Certificate - Anglian
CSCS Card - Level 1 Award
Level 3
Water Alliances
Health & Safety in the
Carpentry (Wood Occupations
Construction - Level 3
Construction Environment
in Construction) -
(Extended Diploma)
Introduction in CNC
Apprenticeship (Advanced) -
Construction Skills - Brickwork
Programming
Level 3
- Level 1
Introduction to Brickwork -
Carpentry (Wood Occupations
Construction Skills - Brickwork
Part-time
in Construction) -
- Level 1
Introduction to Plastering -
Apprenticeship (Intermediate)
Construction Skills - Carpentry
Part-time
- Level 2
and Joinery - Level 1
Construction Plastering -
Construction Skills - Carpentry
Apprenticeship (Intermediate)
and Joinery - Level 1
- Level 2
Construction Skills - Painting
Decorative Operations
and Decorating - Level 1
(Painting and Decorating) -
Construction Skills - Plastering
Apprenticeship (Intermediate)
- Level 1
- Level 2
Construction Skills - Plumbing
Plumbing - Apprenticeship
- Level 1
(Advanced) - Level 3
Construction Skills - Plumbing
Plumbing - Apprenticeship
- Level 1
(Intermediate) - Level 2
Diploma in Construction
(HNC) - Level 4
Electrical Installation - Level 2
Electrical Installation - Level 2
Entry to Construction - Entry
Level
Entry to Construction - Entry
Level
Painting and Decorating -
Level 2 (Diploma)
Plastering - Level 2 (Diploma)
Plumbing Studies - Level 2
Plumbing Studies - Level 2
32
New Anglia LEP
Construction Labour Research
February 2016
Provider
Website
Apprenticeships/
Vocational Courses
Higher/Further Education
Short duration
Traineeships/New Entrants
Easton & Otley
• Level 1 in Construction
Building Craft Occupations
• Diploma in Construction
Basic Brickwork Skills (Short
College
(Students 14-16 Construction)
(Multi-Skills)
(Part-time courses
courses Construction)
• Level 1 Building Craft
Carpentry & Joinery
Construction)
Bricklaying Techniques (Short
occupations (Construction)
Certificate in Engineering
• Diploma in Construction
courses Construction)
(Students 14-16 Construction)
(Electrical)
(Part-time courses
Construction Plant Certificate
• Level 2 BTEC in Construction
Electrotechnical Technology
Construction)
(Short courses Construction)
(Students 14-16 Construction)
Electrotechnical Technology
External Rendering (Short
Plastering
courses Construction)
Plastering (Fibrous)
Internal Plastering Part 1 (an
Plastering (Solid)
Introduction) (Short courses
Plumbing
Construction)
Site Carpentry
Internal Plastering Part 2 (a
Trowel Trades (Bricklaying)
continuation) (Short courses
Construction)
Plastering an Introduction
(Short courses Construction)
33
New Anglia LEP
Construction Labour Research
February 2016
Construction
Apprenticeship in Glass
NVQ Level 2 Diploma in
Introduction to Brickwork
Training Specialists
Related Distribution and
Plastering
Evening Course
Ltd
Warehousing
NVQ Level 3 Diploma in
Introduction to Carpentry and
Apprenticeship in Fabrication
Painting
Joinery
of Glass Supporting Structures
Diploma in Plumbing level 2
Introduction to Painting and
Apprenticeship in Domestic
Diploma in Brickwork level 3
Decorating
Fascia, Soffit and Bargeboard
Diploma in Site Carpentry/
Introduction to Plastering
Installation
Bench Joinery level 2/3
Diploma in Brickwork - Level
Apprenticeship in Curtain
Diploma in Painting and
2/3 (evening)
Wall Installation Level 2 NVQ
Decorating level2/ 3
Mobile Tower Scaffolding
Certificate
Course
Apprenticeship in Glazing
Portable Power Tools Course
Level 2 NVQ Certificate
Asbestos Awareness Course
Apprenticeship in
Fenestration Installation Level
2 NVQ Diploma
Apprenticeship in Plumbing
Level 2 NVQ Diploma
Apprenticeship in Site
Supervision Level 3 NVQ
Diploma
Apprenticeship in Shopfitting
- Bench Joinery NVQ Level 2
Certificate
Apprenticeship in Bench
Joinery (Architectural Joinery)
Apprenticeship in Site
Carpentry NVQ Level 2
Diploma
Apprenticeship in Shopfitting
- Site Carpentry NVQ Level 2
Certificate
Apprenticeship in General
Construction NVQ Level 2
Diploma
Apprenticeship in Brickwork
NVQ Level 2 Diploma
Apprenticeship in
Maintenance NVQ Level 2
Diploma
34
New Anglia LEP
Construction Labour Research
February 2016
Provider
Website
Apprenticeships/
Vocational Courses
Higher/Further Education
Short duration
Traineeships/New Entrants
Apprenticeship in Fitted
Interiors NVQ Level 2
Certificate
Apprenticeship in Shopfitting
- Site Carpentry NVQ Level 2
Certificate
Apprenticeship in Plastering
NVQ Level 2 Diploma
Apprenticeship in Painting
and Decorating NVQ Level 2
Diploma
Falcon Crane Hire
Saddle and Luffing jib tower
Ltd
cranes courses
35
New Anglia LEP
Construction Labour Research
February 2016
Provider
Website
Apprenticeships/
Vocational Courses
Higher/Further Education
Short duration
Traineeships/New Entrants
Fast Lane Training
Qualifications Offered
Lorry Loader (HYAB)
Services
City & Guilds - 6159 Winter
Fork Lifts
Service Operations
Tractor with Flail
City & Guilds - 6156 Street
Self-propelled Surface
works
Dressing Chipping Spreader
Scottish Qualifications
Brush Cutters
Authority SQA - Street Works
6150 - 01 Low Risk
Refresher
6150 - 02 Medium Risk
Equipment Operators
6150 - 03 High Risk
Registration Scheme (EORS)
6150 - 04 Top man for High
Lantra - 12D Traffic
Risk
Management
6150 - 05 Standby Rescue
City & Guilds 6150 - Confined
Team Member
Space
6150 - 06 Management &
Drivers - Certificate of
Supervision
Professional Competence
Drivers Regulations
Excavation Operations
Driver Awareness
Modular Paving Construction
LOLER
Laying Kerbs & Channels
Towing
Shallow Drainage Installation
Fire Safety
Drainage Construction
Manual Handling
Flexible Pavement
Spill Kit
Construction
Abrasive Wheels - Cut Off
Concrete Operations
Saw
Telescopic Material Handler
Ride on Roller
Dumper
360 Excavators
180 Loader Excavator
Mobile Elevated Work
Platform
36
New Anglia LEP
Construction Labour Research
February 2016
Provider
Website
Apprenticeships/
Vocational Courses
Higher/Further Education
Short duration
Traineeships/New Entrants
Great Yarmouth
Traineeships Construction
Construction & Engineering
PAT (Portable Appliance
College
and Manufacturing
17th Edition Wiring
Testing)
Technologies
Regulations
Period Inspection and Test
Apprenticeship Advanced
Auto-Cad Level 1
- Plumbing Level 3
Level Apprenticeships
Auto-Cad Level 2
- Water Regulations
Electrical Installation Level 3
Certificate in Marine
(Unvented Hot Water) Level 3
Engineering Manufacturing
Construction Systems Level 2
- Welding Evening 3268-02
Level 3
Diploma in Bench Joinery
Level 2
Fabrication and Welding Level
Level 2
- Welding Evening 3268-10
3
Diploma in Bricklaying Level 1
(MMA) Level 1
Management (Learner) Level
Diploma in Bricklaying Level 2
- Welding Evening 3268-12
3
Diploma in Engineering Level
(TIG) Level 1
Plumbing Level 3
3
- Welding Evening 3268-13
Intermediate Level
Diploma in Engineering
(MIG) Level 1
Apprenticeships
Maintenance Level 2
Engineering Maintenance
Diploma in Engineering
Level 2
Maintenance Level 3
Engineering Manufacturing
Diploma in Engineering
Level 2
Welding Level 2
Plumbing Level 2
Diploma in Mechanical
Engineering Level 3
Diploma in Site Carpentry
Level 2
Electrical Installation Level 3
37
New Anglia LEP
Construction Labour Research
February 2016
Provider
Website
Apprenticeships/
Vocational Courses
Higher/Further Education
Short duration
Traineeships/New Entrants
Quinto Crane &
CPA and contract lifting
Plant Ltd
Demolition - Specialists in
controlled, manual and
mechanical demolition.
Dismantling - Dismantle
structures for reclamation
and/or reuse.
Partial demolition &
separating structures
Temporary support & façade
retention - installing
temporary works systems
such as Mabey Hire, Leada
Acrow and other leading
support systems.
Strip out works - Our teams
carry out non-structural soft
strip works.
Site clearance - We do more
than just clear buildings and
structures, we also clear the
surrounding land.
Asbestos removal - removal
and disposal of asbestos
containing materials.
Crushing & screening - We
crush and screen material
arising from demolition to be
retained on site or removed
for re-use.
RG Carter
38
New Anglia LEP
Construction Labour Research
February 2016
Provider
Website
Apprenticeships/
Vocational Courses
Higher/Further Education
Short duration
Traineeships/New Entrants
Aurelia Ltd
Aurelia Certification It meets
the requirements of the
Health & Safety at Work Act
and can be carried out either
on site or at our training
centre. It is ideal for
operators who work on one
site only such as factories,
warehouses, transfer stations,
landfill sites, gravel pits and
quarries etc
Construction Plant
Competence Scheme Red
CPCS Trained Operator Card
Blue CPCS Competent
Operator Card
Train to Gain Experienced
Worker Practical Assessed
Route (EWPAR)
Heart of
Diploma in Basic Construction
Diploma in Bench Joinery,
Worcestershire
Skills, Level 1
Level 2
College - Redditch
Diploma in Bricklaying (QCF),
Diploma in Bench Joinery,
Campus
Level 1
Level 3
Diploma in Carpentry &
Diploma in Brickwork, Level 2
Joinery (QCF), Level 1
Diploma in Plastering, Level 2
Diploma in Plastering (QCF),
Diploma in Site Carpentry,
Level 1
Level 2
Diploma in Site Carpentry,
Level 3
39
New Anglia LEP
Construction Labour Research
February 2016
Provider
Website
Apprenticeships/
Vocational Courses
Higher/Further Education
Short duration
Traineeships/New Entrants
Lowestoft College
Basic Construction Skills -
Brickwork Skills - Levels 1, 2
Unniversity of Suffolk
Certificate in Environmental
Level 1
and 3
FdSc/BSc (Hons) Construction
Technologies - City & Guilds
Level 1College
Carpentry and Joinery
Management
2399
CoursesPlumbing Studies
(Bench)- Levels 2 and 3
HNC Construction and the
17th Edition of BS:7671 IEE
Painting and Decorating -
Carpentry and Joinery (Site) -
Built Environment (Building
Wiring Regulations
Level 1
Levels 2 and 3
Services Engineering)
(Amendment 1)
Carpentry and Joinery (Site) -
Certificate in the Initial
HNC Mechanical Engineering
Bespoke Electrical Training
Level 1
Verification and Periodic
Programme specification FdSc
2396-01 Level 4 Award in the
Carpentry and Joinery
Inspection of Electrical
Civil Engineering
Design & Verification of
(Bench)- Level 1
Installations
Electrical Installations
Brickwork Skills - Levels 1
Painting and Decorating -
CAD Computer Aided Design -
Levels 2 and 3
Level 2
Electrical Installation - Level
CAD Computer Aided Design -
2College CoursesElectrical
Level 3
Installation - Level 3
Certificate in the Initial
Plumbing Studies -
Verification and Periodic
Level 2College
Inspection of Electrical
CoursesPlumbing Studies -
Installations
Level 3College
CNC Programming
CoursesPortable Appliance
Energy Skills - Level 2
Testing (PAT)
Introduction to Motor Vehicle
Electrical Engineering Skills -
Technology - Entry Level 3
NVQ Level 2
Diploma
Engineering Machining Skills -
Light Vehicle Maintenance -
NVQ Level 2
Diploma Level 1
Engineering Mechanical
Light Vehicle Maintenance
Maintenance Skills - NVQ
and Repair Principles -
Level 2
Diploma Level
Engineering Mechanical -
Portable Appliance Testing
NVQ Level 3
(PAT)
Engineering Electrical - BTEC
Solid Works 3D
Level 3
Welding and Fabrication Skills
- Level 1
Welding and Fabrication Skills
- Level 2
Welding and Fabrication Skills
- Level 2 (Award)
40
New Anglia LEP
Construction Labour Research
February 2016
Provider
Website
Apprenticeships/
Vocational Courses
Higher/Further Education
Short duration
Traineeships/New Entrants
Otley College
Level 1 Building Craft
Level 2 Electrotechnical
Short courses
Occupations (Multi-Skills)
Technology
Basic Brickwork Skills
Level 1 Carpentry & Joinery
Level 2 Plastering
Bricklaying Techniques
Level 1 Certificate in
Level 2 Plumbing
Construction Plant Certificate
Engineering (Electrical)
Level 2 Site Carpentry
External Rendering
Level 1 Plastering
Level 2 Trowel Trades
Internal Plastering Part 1 (an
Level 1 Plumbing
(Bricklaying)
Introduction)
Level 1 Trowel Trades
Level 3 Electrotechnical
Internal Plastering Part 2 (a
(Bricklaying)
Technology
continuation)
Students
Level 3 Plastering (Fibrous)
Plastering an Introduction
Level 1 Level 1 in Construction
Level 3 Plastering (Solid)
Level 1 Level 1 Building Craft
Level 3 Site Carpentry
occupations (Construction)
Level 3 Trowel Trades
Level 2 Level 2 BTEC in
(Bricklaying)
Construction
Suffolk New College
Plumbing and Heating
CSkills Awards Level 3
FdSc Civil Engineering
Apprenticeship Level 2
Diploma in Bricklaying
BSc (Hons) Civil Engineering
General Engineering
CSkills Awards Level 1
(progression route)
Apprenticeship Level 3
Diploma in Bricklaying
Certificate in Education
Electrical Installation
CSkills Awards Level 2
(CertEd)
Apprenticeship Level 3
Diploma in Bricklaying
Professional Graduate
CSkills Awards Level 1
Certificate in Education
Diploma in Carpentry &
(PGCE)
Joinery
CSkills Awards Level 2
Diploma in Site Carpentry
CSkills Awards Level 3
Diploma in Site Carpentry
CSkills Awards Level 1
Diploma in Painting &
Decorating
CSkills Awards Level 2
Diploma in Painting &
Decorating
CSkills Awards Level 3
Diploma in Painting &
Decorating
41
New Anglia LEP
Construction Labour Research
February 2016
Provider
Website
Apprenticeships/
Vocational Courses
Higher/Further Education
Short duration
Traineeships/New Entrants
West Suffolk College
Wood Occupations (Site
Bricklaying Diploma Level 1
FdSc Construction
OFL 50 Training
Carpentry) - Advanced
Carpentry and Joinery
Management
Multi Appliance Training
Apprenticeship
Diploma Level 1
BSC Construction
Carpentry and Joinery
Wood Occupations (Bench
Bricklaying Diploma Level 2
Management
Diploma Level 2 Evening Part
Joinery) - Advanced
Construction Skills Diploma
HNC Building Services
Time
Apprenticeship
Level 1
Engineering
Painting and Decorating
Trowel Occupations -
Painting and Decorating
Diploma Level 2 Evening
Advanced Apprenticeship e
Diploma Level 1
Unvented Hot Water Systems
Installing Electrotechnical
Construction and the Built
Systems and Equipment -
Environment Extended
Advanced Apprenticeship
Diploma Level 3
Wood Occupations (Site
Plastering Diploma Level 2
Carpentry) - Intermediate
Maintenance Operations
Apprenticeship
Diploma Level 2
Wood Occupations (Bench
Joinery) - Intermediate
Apprenticeship
Trowel Occupations -
Intermediate Apprenticeship
Decorative Finishing and
Industrial Painting
Occupations - Intermediate
Apprenticeship
Plastering - Intermediate
Apprenticeship
Fenestration Installation -
Intermediate Apprenticeship
Glazing - Intermediate
Apprenticeship
Local Environmental Services
Skills - Intermediate
Apprenticeship
Maintenance Operations -
Level 2
42
New Anglia LEP
Construction Labour Research
February 2016
Eastern Region Roof
Liquid Roofing Apprenticeship
3 day Tile Craft Training
Training Group
(SAP)
Course
Single Ply Apprenticeship
5 day Slate and Tile Craft
(SAP)
Training Course
Heritage Apprenticeship(SAP)
Felt Roof Training Course
Diploma Slate and Tile
Manual Handling and Health
Apprenticeship
& Safety
Abrasive Wheels.
Asbestos Awareness (UKATA)
Level 2 - Non-Licensed
working with CM’s
(Removal)
Asbestos Awareness (UKATA)
Level 3
Construction Design
Management (CDM)
Face Fit Testing. (correctly
fitting face masks)
Health and Safety Awareness
in Roof Work.
Hoist Training.
Institute of Roofing
Management & Technician
Course.
IOSH Directing Safely, IOSH
Managing Safely and IOSH
Working Safely.
Ladder Safety.
NEBOSH Construction.
NEBOSH Fire.
Risk Assessments & Method
Statements.
Safety Harness and Lanyards.
Scaffold Inspections.
Site Supervisors Safety
Training Scheme (CITB -
SSSTS)Site Managers Safety
Training Scheme (CITB -SSSTS)
Working Safely on a Roof.
CITB One Day H&S for Green
43
New Anglia LEP
Construction Labour Research
February 2016
Provider
Website
Apprenticeships/
Vocational Courses
Higher/Further Education
Short duration
Traineeships/New Entrants
CSCS renewals.
Norfolk Training
Slinger/Banksman
Services
Reversing Banksman Training
Manual Handling Training
Tail Lift Safe Operation
Training
44
New Anglia LEP
Construction Labour Research
February 2016
Construction
Specialist Apprenticeships
Plant Maintenance courses
Leadership and Management
Directors’ Role for Health and
Industry Training
courses
CPCS Category Plant Courses
training:-
Safety
Board
Interior Systems - Suspended
Crawler Crane CPCS Code A02
Building Information
Site Safety for Shopfitters and
Ceiling Fixing and Partition
Tower Crane CPCS Code A04
Modelling (BIM)
Interior Contractors
Fixing
Forward Tipping Dumpers -
Business Improvement in
Directors Role for Health and
Interior Systems
Wheeled CPCS Code A09
Construction: Understanding
Safety
Drylining
Excavator 180° Wheeled CPCS
the Market and Selling
Health and Safety Awareness
Floor Covering
Code A10/A12
Business Improvement in
Site Environmental
Plant Apprenticeships courses
Telescopic Handler CPCS Code
Construction: Finance,
Awareness Training Scheme
Plant Maintenance
A17
Costing and Pricing
Site Safety Plus Accredited
Plant Operation - Civil
Wheeled Loading Shovel CPCS
Business Improvement in
Courses
Engineering Plant and
Code A21
Construction: Business
Site Supervisors’ Safety
Construction Plant
Wastemaster Operator
Analysis and Planning
Training Scheme
Crane Operation
Training CPCS Code A21
Construction ILM Level 3
Site Supervisors’ Safety
Demolition Plant Operation
Ride On Road Roller CPCS
Certificate in Leadership and
Training Scheme Refresher
Roofing Apprenticeships
Code A31
Management Practice
Site Management Safety
courses
Lorry Loader CPCS Code A36
Construction ILM Level 3
Training Scheme (SMSTS)
Built-up Felt Roofing
Slinger/Signaller CPCS Code
Award in Leadership and
Site Management Safety
Roof Sheeting and Cladding
A40
Management Practice
Training Scheme (SMSTS)
Roof Slating and Tiling
Dump Truck Articulated
Fairness, Inclusion and
Refresher
Access Apprenticeships
Chassis CPCS Code A56
Respect: Operatives in
Site Environmental
courses
Mini Excavator CPCS Code
Construction
Awareness Training Scheme
Apprenticeships
A58
Fairness, Inclusion and
(SEATS)
Built-up Felt Roofing
Excavator 360° Tracked CPCS
Respect: Supervisors and Line
Temporary Works Co-
Civil Engineering Technician
Code A59
Managers in Construction
ordinator
Construction Operative
Lifting with Excavators CPCS
Fairness, Inclusion and
Temporary Works Supervisor
Crane Operation
Code A59C
Respect: Senior Managers and
Directors’ Role for Health and
Demolition Plant Operation
Mobile Crane CPCS Code A60
Directors in Construction
Safety
Drylining
Appointed Person (Lifting
Level 3/4 NVQ Diploma in
Site Safety for Shopfitters and
Floor Covering
Operations) CPCS Code A61
Construction Site Supervision
Interior Contractors
Formwork
Crane Supervisor CPCS Code
Management and Leadership
Health and Safety Awareness
General Construction
A62
Diagnostic Programme
•NEBOSH National Certificate
Highway Maintenance
Pedestrian Operated Tower
Strategy
in Construction Health and
Interior Systems
Crane CPCS Code A63
Teaching and Instruction Skills
Safety
Interior Systems Suspended
Plant and Vehicle Marshaller
Inspiring and Coaching your
•NEBOSH National Certificate
Ceiling Fixing and Partition
CPCS Code A73
Apprentice
in the Management of Health
Fixing
Portable Appliance Testing
Level 3 Award in Education
and Well-being
Lightning Conductor Engineer
(PAT) - City & Guilds
and Training (QCF)
•NEBOSH National General
Plant Maintenance
Certificate
Level 3 Award in Education
Certificate in Occupational
Plant Operation - Civil
Welding Techniques
and Training (QCF) Initial
Health and Safety
45
New Anglia LEP
Construction Labour Research
February 2016
Engineering Plant and
Test and Inspection - includes
Assessment
Trailer Mounted Concrete
Construction Plant
the Thorough Examination of
Understanding and
Pumps
Pre-cast Operative
Plant
Motivating your Apprentice
Trailer Mounted Concrete
Roof Sheeting and Cladding
Track and Undercarriage
Understanding the Role of the
Pump/Pressurised Systems
Roof Slating and Tiling
Inspection
Work Based Recorder
Trailer Mounted Concrete
Scaffolding
Loading and Movement of
TUCA
Pump/Pressurised Systems
Sprayed Concrete Tunnelling
Trailers and Mobile Towable
Confined Space Training
Refresher
Steeplejacking
Units
Advanced Technical Rescues
Assessments
Tunnel Operative
Trailer/Mobile Towable Units
from Confined Spaces
CPCS Loco Assessment (5
Steel Fixing
- Maintenance and Inspection
Confined Spaces Entry with
days)
Lightning Conductor
Take Control - Vehicle
Escape Breathing Apparatus
CPCS Loco Assessment
Engineering
Marshalling
Self-Contained Breathing
(Training and Programme)
Scaffolding
Plant Electrical (AC)
Apparatus (SCBA)
On-Site Assessment - Training
Steeplejacking
Plant Electrical (DC)
Self-Contained Breathing
Scaffolding and Access
Tunnelling Apprenticeships
Plant Hydraulics
Apparatus (SCBA) with Snatch
CISRS Operative Training
courses
Electro-Hydraulics
Rescue
Scheme (COTS)
Sprayed Concrete Tunnelling
Supervision and Management
Scaffolding Part 1: Tube and
Apprenticeship
of Work in Confined Spaces
Fitting or System Scaffold
Tunnel Operative
Sprayed Concrete Lining
Scaffolding Part 2: Tube and
Apprenticeship
Sprayed Concrete Lining
Fitting or System Scaffold
Construction Operative
(SCL): Waterproof Membrane
Advanced Scaffolding
Apprenticeship
Awareness
Level 2 CISRS Skills Match
Pre-cast Operative
Sprayed Concrete Lining
SVQ/NVQ Level 3 Practical
Apprenticeship
(SCL):Concrete Technology for
Assessment: Tube and Fitting
Operatives
including CISRS Practical Skills
Sprayed Concrete Lining
Assessment
(SCL): Inspector's Course
TG20 - Principal Changes
Sprayed Concrete Lining
Basic Scaffolding Inspection
(SCL): Training and
Training Scheme -SITS
Assessment
Advanced Scaffolding
Inspection Training Scheme -
SITS
Two-day System Scaffold
Product Training Scheme
Scaffolding Supervisor
PASMA Mobile Towers
Experienced Worker Practical
Assessment Route (EWPAR)
Scaffolding
Basic Access System Erector
46
New Anglia LEP
Construction Labour Research
February 2016
Provider
Website
Apprenticeships/
Vocational Courses
Higher/Further Education
Short duration
Traineeships/New Entrants
Assessments
47
New Anglia LEP
Construction Labour Research
February 2016
Appendix H. Region/nation employer operates
in, compared with region/nation
working in currently
Region/nation currently working in
EM
EE
GL
NE
NW
NI
SC
SE
SW
WA
WM
YH
Region/nation employer
operates in
%
%
%
%
%
%
%
%
%
%
%
%
East Midlands
83
16
8
13
3
2
4
12
8
7
24
11
East of England
12
67
15
11
2
1
4
19
8
7
9
6
London
10
27
84
13
4
1
5
27
12
7
9
6
North East
9
9
8
93
3
1
4
6
7
7
8
15
North West
11
9
8
14
93
1
4
6
7
11
11
10
Northern Ireland
3
3
3
2
1
99
3
2
1
3
2
1
Scotland
6
4
6
9
1
2
97
2
4
4
5
4
South East
13
23
27
12
3
*
4
65
21
7
11
6
South West
9
5
7
10
3
*
4
18
83
10
15
5
Wales
6
5
5
8
3
*
4
3
10
96
14
4
West Midlands
21
9
8
12
6
*
4
7
12
9
92
8
Yorkshire and the Humber
15
10
7
19
4
1
5
6
8
8
8
88
Republic of Ireland
1
2
3
*
*
2
1
1
1
2
2
*
Other parts of Europe
*
*
*
1
0
0
0
0
*
0
1
0
Outside Europe
*
1
0
*
0
0
0
0
*
0
*
0
Other / Unsure
1
3
2
3
2
*
1
3
1
*
1
3
Unweighted bases
410
366
452
427
435
274
463
439
494
290
352
369
Source: Workforce Mobility and Skills in the UK Construction Sector 2015, East of England Report. BMG Research on behalf
of CITB
Base: All respondents,
*denotes less than 0.5%
48