Life Sciences & Bio-Economy
Sector Data Pack
Version Final
Contents
Page
-
Introduction to the Sector Data Pack
3
-
Introduction to and Definition of the Life Sciences & Bio-Economy Sector
3
-
Key Findings from the Data Analysis
5
-
The Life Sciences & Bio-Economy Sector in New Anglia
6
o GVA
7
o Employment
11
o Businesses
30
o Wages
35
o Apprenticeships
37
o Vacancies
39
-
Appendices
o Appendix 1
45
o Appendix 2
46
2
Introduction to the Sector Data Pack
The role of the Sector Data Pack is to bring together the latest socio-economic and labour market data and present both an up-to-date, and
future view, of the sector and any underlying issues within the area that could impact upon it. Information and feedback collected from
stakeholder consultation (through workshops, meetings, and survey) is also presented and summarised (where available and applicable).
The Data Pack sits below the Sector Skills Plan, with the key findings from the data analysis helping to inform the priorities developed in the
plan. In most instances data has been analysed and presented down to local authority level. In some instances, and even where local authority
data is available, it has not been presented in the data pack due to issues of unreliability and small sample sizes. This is particularly the case
with data from the Annual Population Survey and the Annual Survey of Hours and Earnings.
Throughout the Data Pack findings are also presented for the Local Enterprise Partnership (LEP) areas of Greater Cambridge and Greater
Peterborough (GCGP), Hertfordshire, and South East LEP (SELEP). These comparator areas were agreed in consultation with the AgriFood
Tech sector group and New Anglia LEP officers.
Introduction to and Definition of the Life Sciences & Bio-Economy
Sector
The official Life Sciences definition as set out in the UK Life Sciences Strategy1 is seen as being too narrow for New Anglia as it only focuses
on human health and does not include many other industries which use biology and related life sciences. The New Anglia the life sciences
sector needs to be seen as part of the wider bio-economy so it encompasses all the major areas using biological sciences locally.
The science economy in New Anglia is a diverse sector, from long established sub-sectors e.g. human health with steady but moderate growth
as well as newer, smaller, but faster growing sub-sectors such as industrial and synthetic biotechnology. This is the approach taken by the East
of England Science and Innovation Audit, a Bio-economy review for BIS in 2016, the EU’s Bio-economy programmes and at NRP.
In the UK the life sciences sector is dominated by human health and, whilst New Anglia has a presence in this market, the critical mass of UK
investment in health research is in London and the Midlands, with only relatively few companies in New Anglia. Norfolk and Suffolk do though
have one significant advantage in human health research, based on its stable and relatively elderly population. This makes it ideally suited to
the long term study of conditions normally associated with ageing and the linked rapid growth markets.
1 BIS (2011), Strategy for UK Life Sciences
3
New Anglia has nationally/internationally important critical mass in the wider bio-economy, the sector which uses biology (and other sciences)
to develop innovations in dietary health, agriculture, marine sciences and equine health. There are exciting new developments from the life
sciences research base in areas such as soil health and organisms which affect agriculture as well as the environment and human health.
The New Anglia Life Sciences and Bio-economy sector is therefore defined as:
-
Human life sciences including pharmaceuticals, medical devices and technology;
-
Agritech, food and the microbiome (gut, soil and rhizosphere);
-
Bioinformatics;
-
Equine cluster centred on Newmarket;
-
Marine Sciences centred on CEFAS;
-
Industrial bio-economy including bio-energy.
The Standard Industrial Classification codes that have been used to capture this activity have been drawn from the Association of the British
Pharmaceutical Industry report ‘The economic contribution of the UK Life Sciences industry’ (March 2017), prepared by
PricewaterhouseCoopers LLP, and are presented in detail in appendix 1.
4
Key Findings from the Data Analysis:
-
The Life Sciences & Bio-Economy sector in New Anglia was worth approximately £1.6bn in 2015
-
This £1.6bn equates to 4.5 per cent of New Anglia’s economy total value, slightly less than LEP comparators and nationally
-
25,100 people were employed in the sector in 2015, nearly 4 per cent of the total workforce, which again is slightly below LEP
comparator areas and nationally
-
There are currently approximately 4,055 Life Sciences & Bio-Economy sector businesses in New Anglia, making up nearly 6 per cent of
all businesses
-
Growth in employment and business numbers however has been strong locally, with rates above those seen across the New Anglia
economy as a whole
-
New Anglia’s Life Sciences sector is particularly geared towards the sub sector of Medical Technology Manufacture when compared to
other areas
-
However, it is employment in Life Sciences Research that has experienced the strongest growth between 2010 and 2015, with
employment in that sub sector standing at 11,700 in 2015
-
New Anglia’s Life Sciences & Bio-Economy sector location quotient (0.9) is currently below that of its main comparator areas, but it has
increased since 2010 (0.7)
-
Increases in employment in the sector in New Anglia have been driven by growth in both full-time and part-time employment
-
Apprenticeship numbers are dominated by Health & Social Care with very little in the way of apprenticeships that better fit the sector
definition (such as Laboratory and Science Technicians)
5
Life Sciences & Bio-Economy
Sector in New Anglia
6
Life Science & Bio-Economy sector’s contribution to the
local economy
4,055
5.6%
£1.6bn
4.5%
25,100
3.7%
GVA
Employment
Businesses
Sources: Business Register and Employment Survey, UK Business
Counts (both Office for National Statistics); GVA calculation based on
GVA per employee findings from the PwC report ‘The economic
contribution of the UK Life Sciences industry’ (March 2017) - see
appendix 2 for full details
7
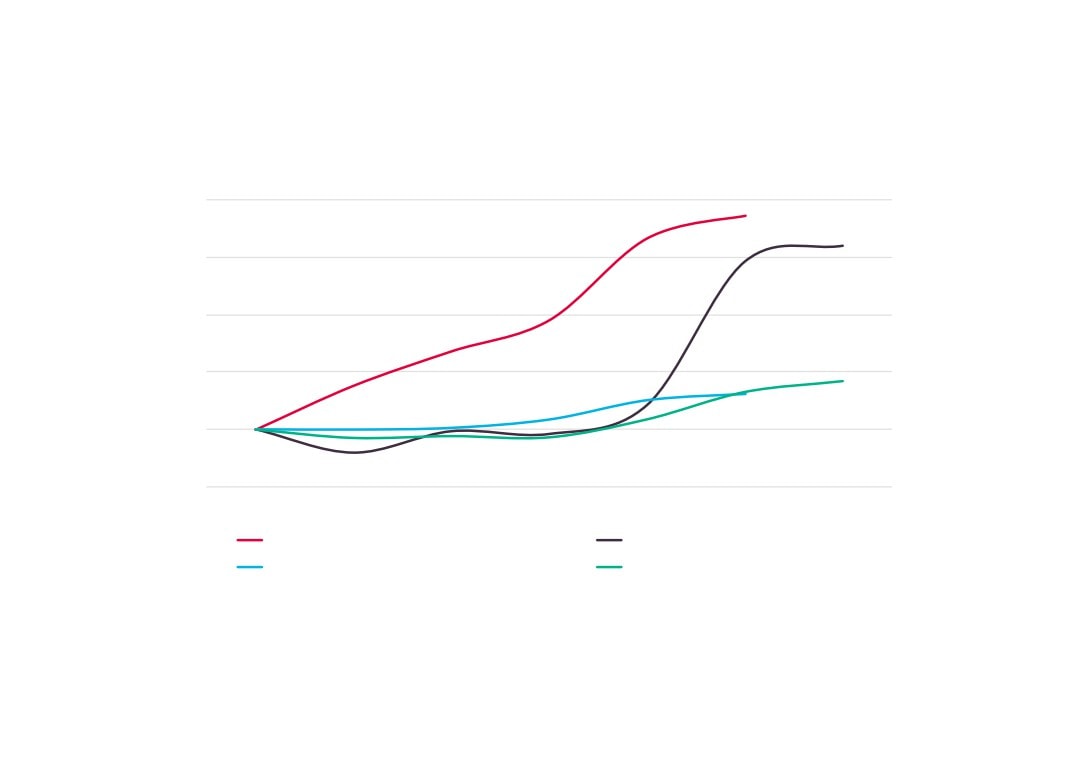
Life Science & Bio-Tech sector’s contribution to growth in the local economy
(2010=100)
140
130
120
110
100
90
2010
2011
2012
2013
2014
2015
2016
Life Sciences & Bio-Tech Employment
Life Sciences & Bio-Tech Business
Total Employment
Total Business
Sources: Business Register and Employment Survey, UK Business Counts; all Office for National Statistics
8
Life Sciences sector GVA (£m) across comparator areas, 2015
New Anglia LEP
£1.6bn
Norfolk
£0.84bn
Suffolk
£0.76bn
GCGP LEP
£2.8bn
Hertfordshire LEP
£2.1bn
South East LEP
£4.7bn
Source: Calculation based on PwC report findings of GVA per employee
9
Proportion of total GVA produced by Life
Sciences sector across comparator areas, 2015
New Anglia LEP
4.5%
Norfolk
4.5%
Suffolk
4.5%
GCGP LEP
7.4%
Hertfordshire LEP
6.1%
South East LEP
5.5%
East of England
5.7%
England
5.0%
Source: Calculation based on PwC report findings of GVA per employee
10
New Anglia
25,100
Employment in the Life Sciences
sector across comparator areas, 2015
Norfolk
13,200
Source: Business Register and Employment
Survey, Office for National Statistics
Suffolk
11,900
GCGP LEP
44,300
Hertfordshire LEP
31,300
South East LEP
74,900
11
Proportion of employment provided by the Life
Sciences sector across comparator areas, 2015
New Anglia
3.7%
Norfolk
3.7%
Suffolk
3.8%
GCGP LEP
6.6%
Hertfordshire LEP
7.4%
South East LEP
4.7%
East of England
4.8%
England
4.4%
Source: Business Register and Employment Survey, Office for National Statistics
12
Employment in the Life Sciences sector across New Anglia, 2015
3,500
6%
3,000
5%
2,500
4%
2,000
3%
1,500
2%
1,000
1%
500
0
0%
Life Sciences Employment
% Life Sciences Employment
Source: Business Register and Employment Survey, Office for National Statistics
13
Change in Life Sciences sector employment across
comparator areas, 2010 - 2015
New Anglia
37%
Norfolk
33%
Suffolk
42%
GCGP LEP
20%
Hertfordshire LEP
9%
South East LEP
29%
East of England
16%
England
18%
Source: Business Register and Employment Survey, Office for National Statistics
14
Change in Life Sciences sector employment
across New Anglia, 2010 - 2015
Babergh
11%
Breckland
10%
Broadland
49%
Forest Heath
55%
Great Yarmouth
10%
Ipswich
58%
King`s Lynn and West Norfolk
92%
Mid Suffolk
53%
North Norfolk
13%
Norwich
43%
South Norfolk
27%
St Edmundsbury
55%
Suffolk Coastal
21%
Waveney
56%
Source: Business Register and Employment Survey,
Office for National Statistics
15
Split in Life Sciences sector employment by component across
comparator areas, 2015
New Anglia LEP
5%
48%
46%
GCGP LEP
10%
33%
57%
Hertfordshire LEP
20%
37%
43%
South East LEP
6%
43%
52%
East of England
10%
41%
50%
England
10%
43%
47%
Pharmaceutical development and manufacture Medical Technology Manufacture Life Sciences Research
Source: Business Register and Employment Survey, Office for National Statistics
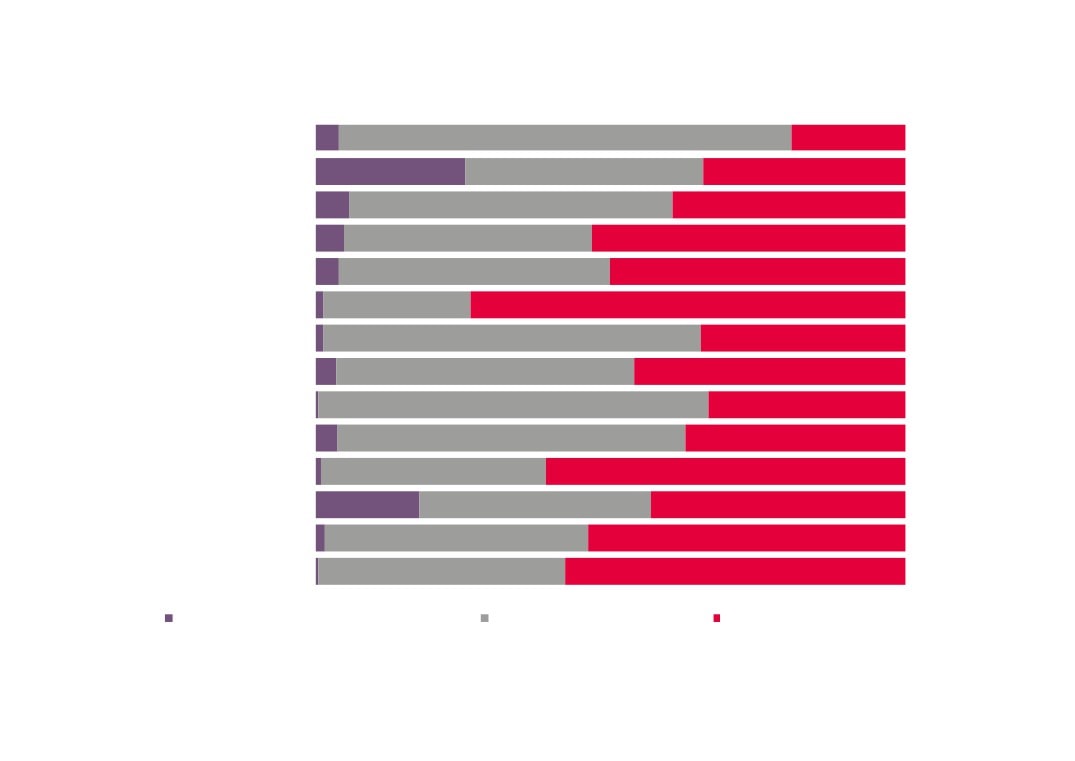
16
Split in Life Sciences sector employment by component across New Anglia, 2015
Babergh
4%
77%
19%
Breckland
25%
40%
34%
Broadland
5%
55%
39%
Forest Heath
5%
42%
53%
Great Yarmouth
4%
46%
50%
Ipswich
25%
74%
King`s Lynn and West Norfolk
64%
35%
Mid Suffolk
3%
51%
46%
North Norfolk
66%
34%
Norwich
4%
59%
37%
South Norfolk
38%
61%
St Edmundsbury
17%
39%
43%
Suffolk Coastal
45%
54%
Waveney
42%
58%
Pharmaceutical development and manufacture
Medical Technology Manufacture
Life Sciences Research
Source: Business Register and Employment Survey, Office for National Statistics
17
Change in Life Sciences sector employment by
component, New Anglia
1,300
1,900
1,600
Pharmaceutical development and manufacture
1,500
1,700
1,300
9,800
10,500
11,500
Medical Technology Manufacture
10,700
11,100
12,100
7,200
7,400
7,700
Life Sciences Research
9,700
11,600
11,700
2010
2011
2012
2013
2014
2015
Source: Business Register and Employment Survey, Office for National Statistics
18
Change in Life Sciences sector employment by component across comparator areas,
2010 - 2015
-40%
-20%
0%
20%
40%
60%
80%
New Anglia
Norfolk
Suffolk
GCGP LEP
Hertfordshire LEP
South East LEP
East of England
England
Pharmaceutical development and manufacture Medical Technology Manufacture Life Sciences Research
Source: Business Register and Employment Survey, Office for National Statistics
19
Top 5 Life Sciences sub sectors, 2015
% of total Life
Change in
Industry Sector Code
Industry Sector Name
Employment Sciences sector
employment 2010 -
employment
2015
86900
Other human health activities
7,800
31%
141%
82990
Other business support service activities nec
4,900
19%
144%
22290
Manufacture of other plastic products
2,400
9%
48%
72190
Other research and experimental development on natural sciences and
2,100
8%
5%
74909
Other professional, scientific and technical activities (not including envi
1,600
6%
-13%
Source: Business Register and Employment
Survey, Office for National Statistics
20
Top growth Life Sciences sub sectors with 100 employees or more
% of total Life
Change in
Industry Sector Code
Industry Sector Name
Employment Sciences sector
employment
employment
2010 - 2015
21100
Manufacture of basic pharmaceutical products
!
1%
1260%
82990
Other business support service activities nec
4,900
19%
144%
86900
Other human health activities
7,800
31%
141%
72110
Research and experimental development on biotechnology
100
1%
72%
22290
Manufacture of other plastic products
2,400
9%
48%
20140
Manufacture of other organic basic chemicals
100
0%
36%
33130
Repair of electronic and optical equipment
200
1%
21%
72190
Other research and experimental development on natural sciences and engineering
2,100
8%
5%
Source: Business Register and Employment Survey, Office for National Statistics
21
Life Science sector location quotients across
comparator areas, 2015
0.9
New Anglia
Location quotients (LQs) are a
0.7
useful way of showing a sectors
importance to the local economy
relative to the national picture. The
analysis presented here uses
0.8
Norfolk
employment with an LQ above 1
0.7
showing a higher concentration than
0.9
nationally, and an LQ of below than
Suffolk
1 a lower concentration.
0.7
2015
2010
1.5
GCGP LEP
1.5
1.2
Hertfordshire LEP
1.4
1.1
South East LEP
0.3
1.1
East of England
1.1
Source: Business Register and Employment Survey, Office
for National Statistics
22
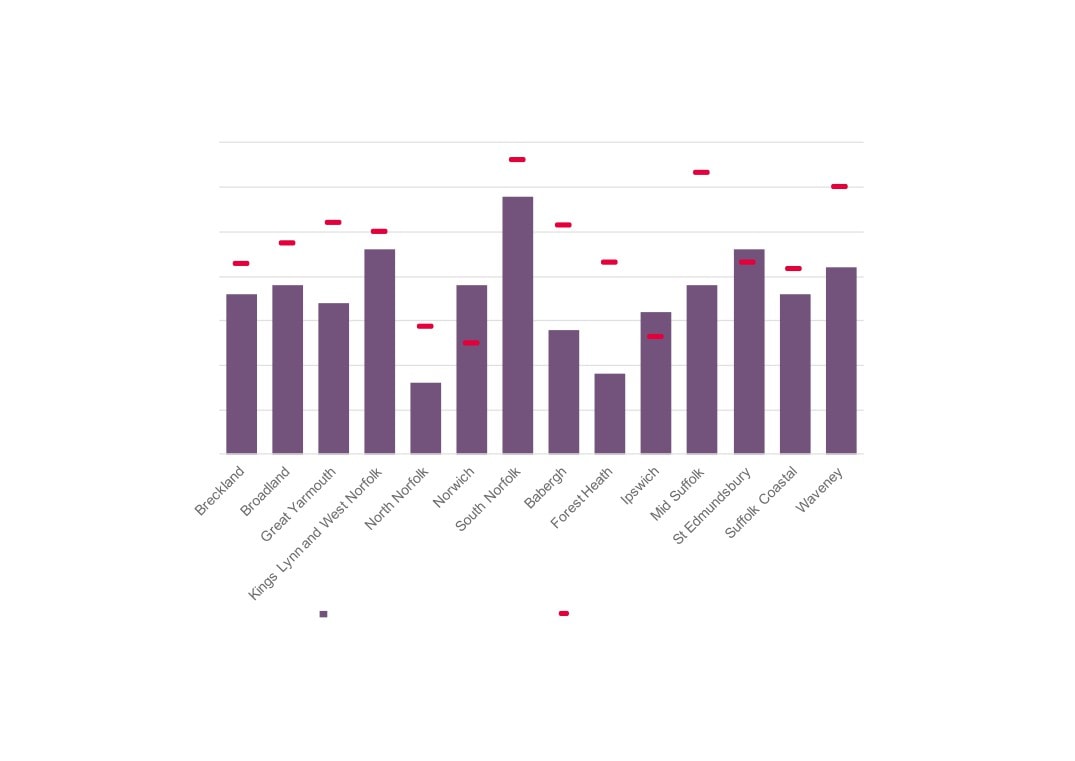
Life Sciences sector location quotients
across New Anglia, 2015
1.0
Babergh
1.1
0.8
Breckland
1.0
0.9
Broadland
0.7
2015
0.9
Forest Heath
0.6
2010
1.0
Great Yarmouth
1.0
0.5
Ipswich
0.4
1.0
King`s Lynn and West Norfolk
0.6
1.2
Mid Suffolk
0.9
0.5
North Norfolk
0.6
0.5
Norwich
0.4
1.3
South Norfolk
1.2
0.8
St Edmundsbury
0.7
0.8
Suffolk Coastal
0.8
1.2
Waveney
0.8
Source: Business Register and Employment Survey, Office for National Statistics
23
Life Science sub sectors with location quotients (LQs) above 1
% of total Energy
Industry Sector Code
Industry Sector Name
Employment
sector
LQ
employment
21100
Manufacture of basic pharmaceutical products
!
!
2.9
26600
Manufacture of irradiation, electromedical and electrotherapeutic equipment
300
1%
2.8
33130
Repair of electronic and optical equipment
200
1%
2.1
22290
Manufacture of other plastic products
2,400
9%
2.0
32990
Other manufacturing nec
1,000
4%
2.0
26110
Manufacture of electronic components
300
1%
1.1
28290
Manufacture of other general-purpose machinery nec
700
3%
1.1
27900
Manufacture of other electrical equipment
300
1%
1.1
Source: Business Register and Employment Survey 2015, Office for National Statistics
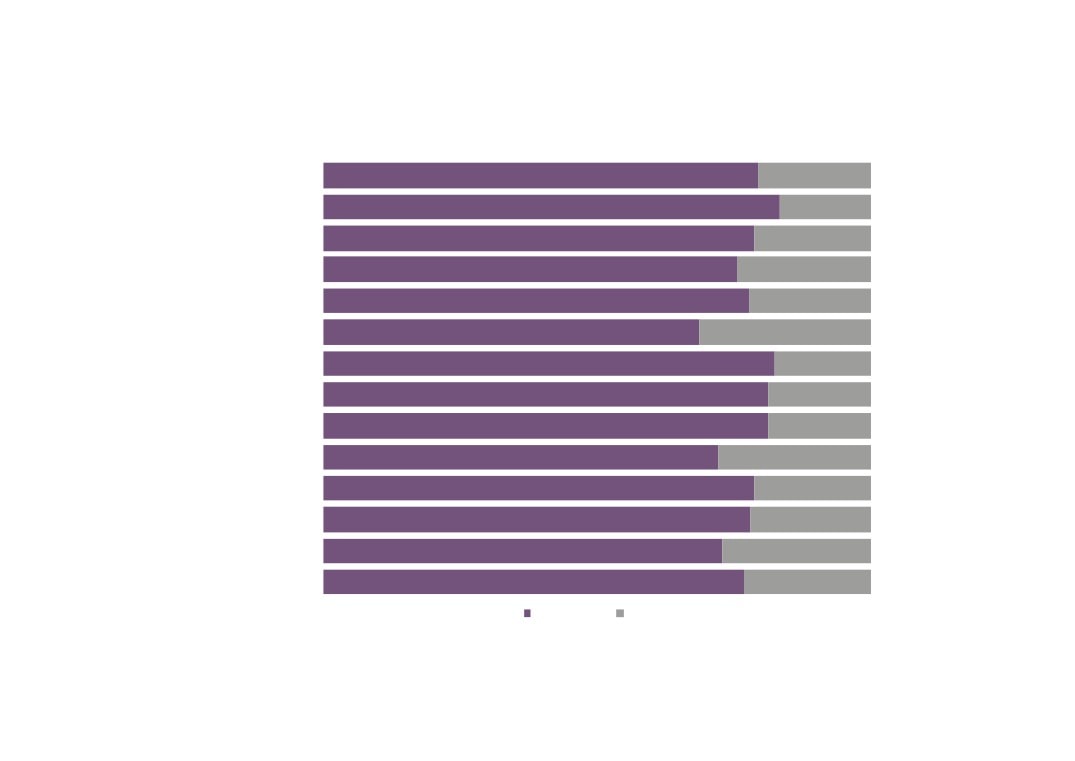
24
Life Sciences sector employment by full-time / part-time split
across comparator areas, 2015
New Anglia
78%
22%
Norfolk
79%
21%
Suffolk
76%
24%
GCGP LEP
84%
16%
Hertfordshire LEP
84%
16%
South East LEP
77%
23%
East of England
82%
18%
England
79%
21%
Full-time
Part-time
Source: Business Register and Employment Survey, Office for National Statistics
25
Life Sciences sector employment by full-time / part-time split
across New Anglia, 2015
Babergh
79%
21%
Breckland
83%
17%
Broadland
79%
21%
Forest Heath
75%
25%
Great Yarmouth
78%
22%
Ipswich
69%
31%
King`s Lynn and West Norfolk
82%
18%
Mid Suffolk
81%
19%
North Norfolk
81%
19%
Norwich
72%
28%
South Norfolk
79%
21%
St Edmundsbury
78%
22%
Suffolk Coastal
73%
27%
Waveney
77%
23%
Full-time
Part-time
Source: Business Register and Employment Survey, Office for National Statistics
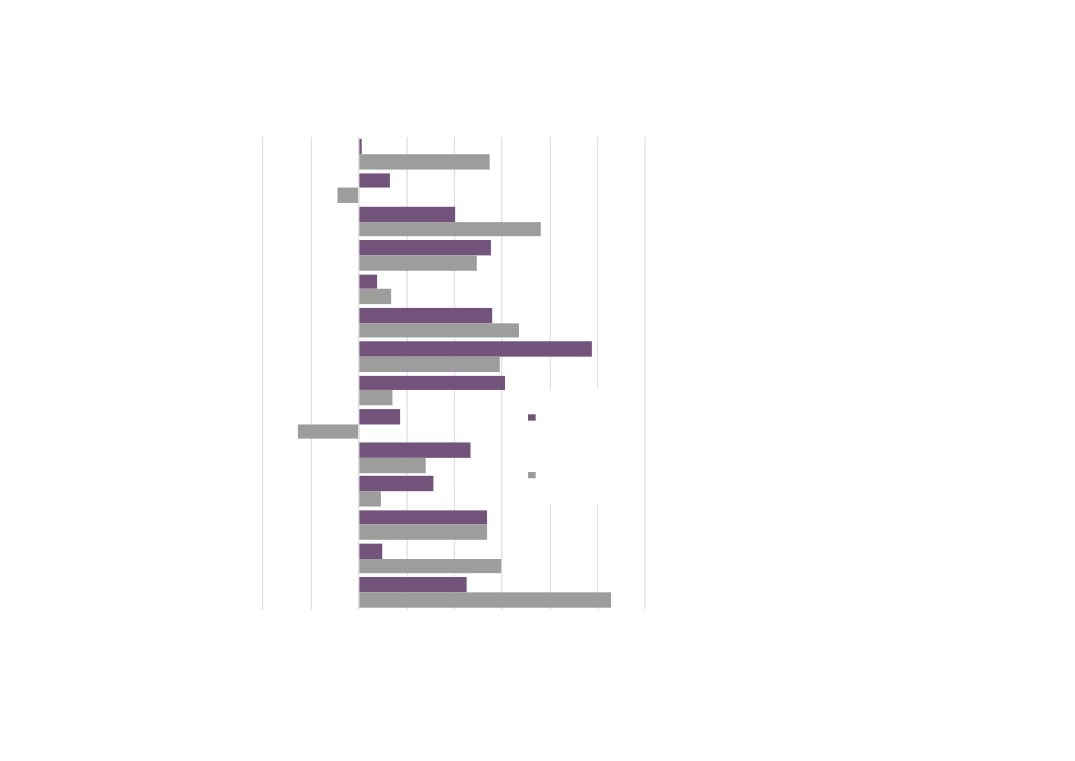
26
Change in Life Sciences sector full-time and part-time
employment across comparator areas, 2010-2015
36%
New Anglia
36%
0%
0%
34%
Norfolk
19%
37%
Suffolk
56%
0%
0%
25%
GCGP LEP
-4%
6%
Hertfordshire LEP
21%
28%
South East LEP
39%
0%
0%
18%
Full-time
East of England
4%
0%
0%
Part-time
17%
England
12%
Source: Business Register and Employment Survey, Office for National Statistics
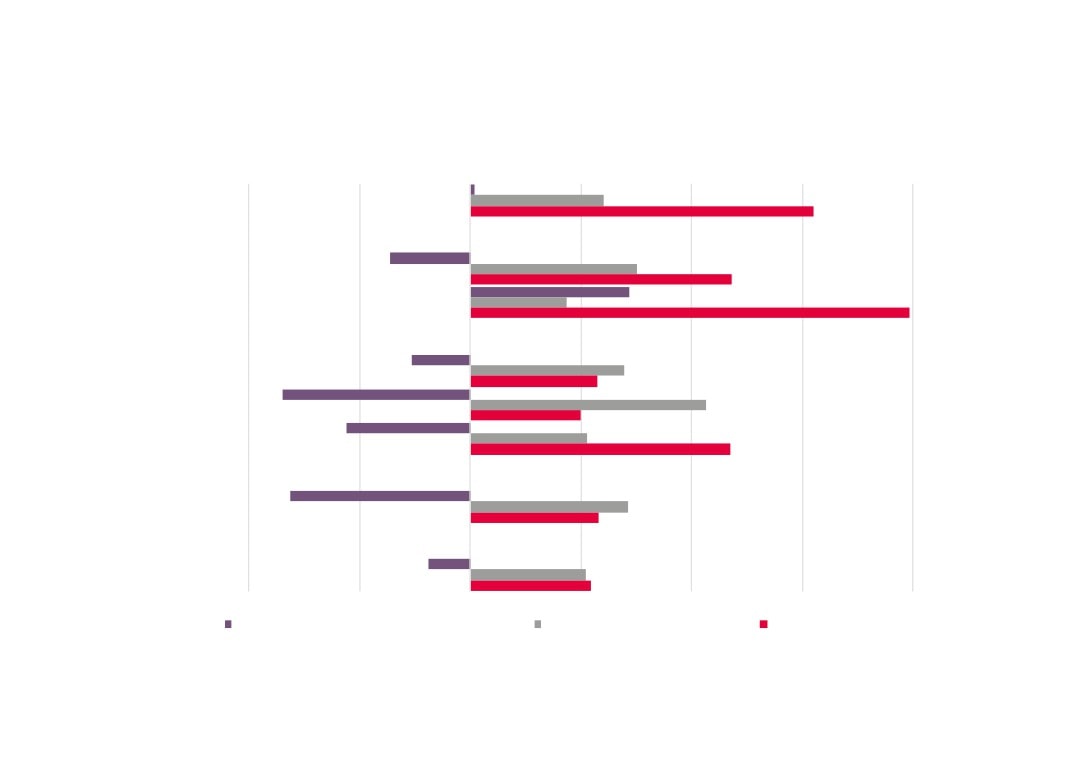
27
-40%
-20%
0%
20%
40%
60%
80%
100%
120%
Babergh
Breckland
Change in Life Sciences
Broadland
sector full-time and part-
Forest Heath
time employment across
Great Yarmouth
New Anglia, 2010-2015
Ipswich
King`s Lynn and West Norfolk
Mid Suffolk
Full-time
North Norfolk
Norwich
Part-time
South Norfolk
St Edmundsbury
Source: Business Register and Employment
Suffolk Coastal
Survey, Office for National Statistics
Waveney
28
Self Employment in the Life Sciences & Bio-Economy Sector
Awaiting content from New Anglia LEP
29
Life Science sector business numbers across comparator areas, 2016
21
New Anglia
4,055
Number of Business
Units per 10,000
Population
25
Norfolk
2,205
Number of Business Units
25
Suffolk
1,825
32
GCGP LEP
4,565
38
Hertfordshire LEP
4,385
28
South East LEP
11,470
31
East of England
Source: UK Business Counts, and Sub-national
Population Estimates, Office for National Statistics
32
England
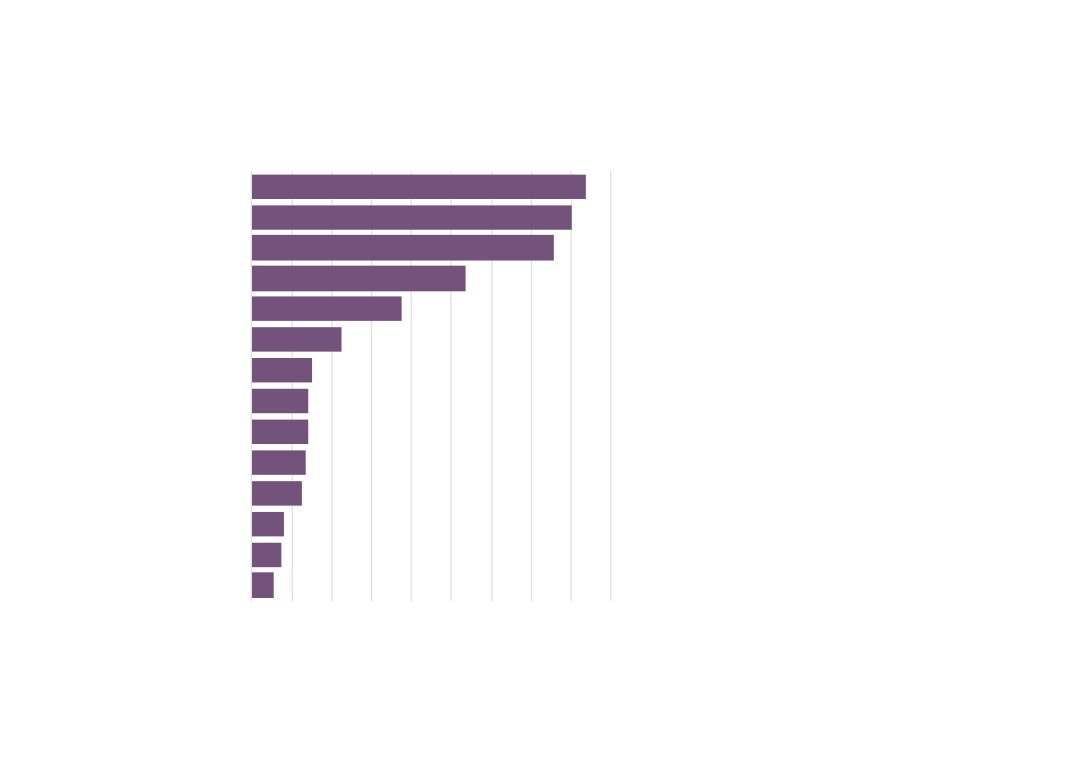
30
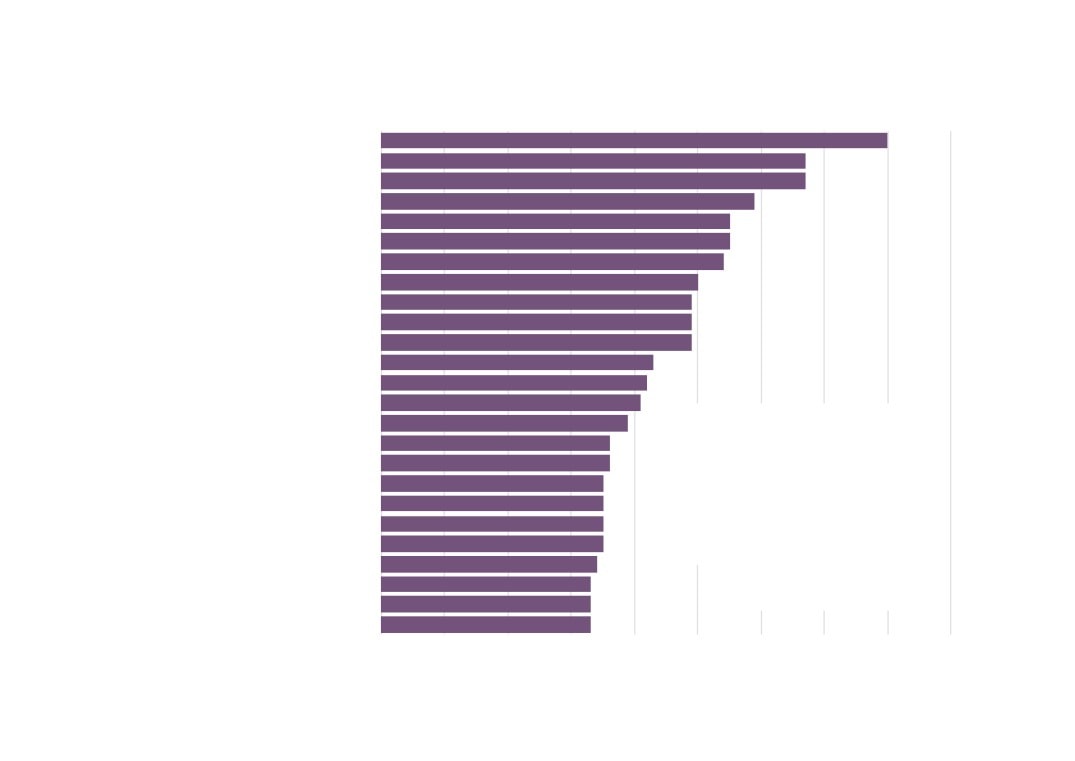
Life Science sector business unit numbers
across New Anglia, 2016
Forest Heath
165
Babergh
230
North Norfolk
235
Waveney
245
Ipswich
250
Great Yarmouth
255
Mid Suffolk
265
St Edmundsbury
305
Breckland
310
King`s Lynn and West Norfolk
315
Broadland
330
Suffolk Coastal
340
Norwich
345
South Norfolk
390
Source: UK Business Counts, Office for National Statistics
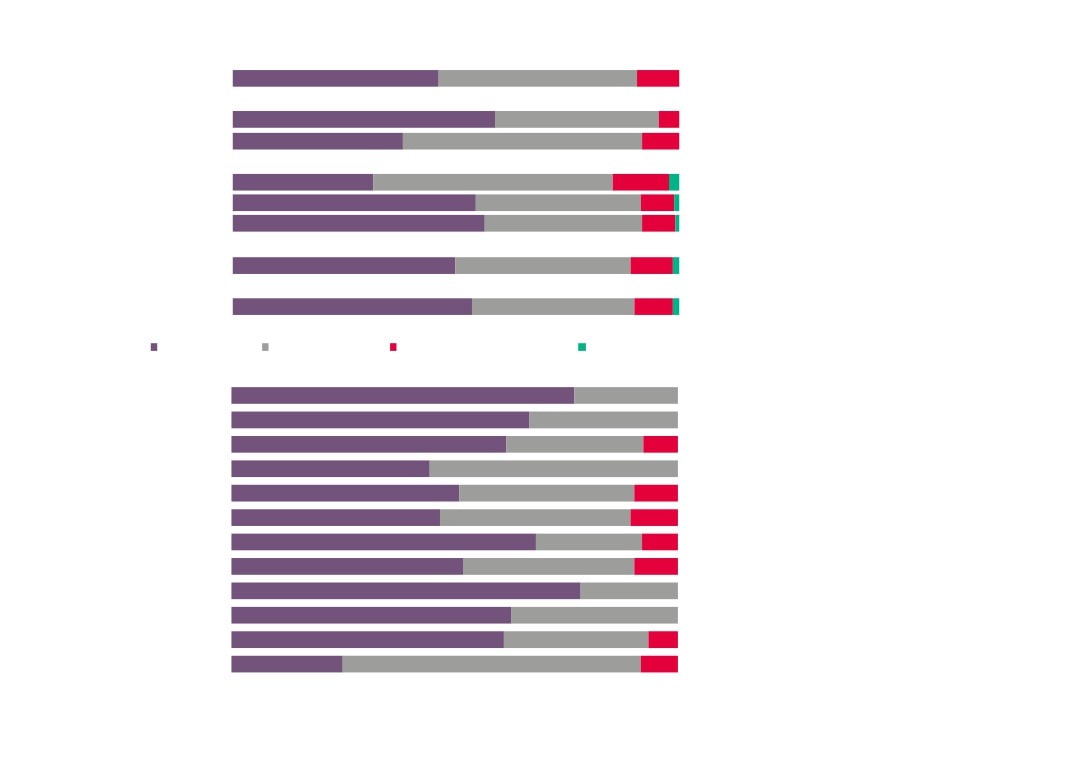
31
80%
100%
New Anglia
89%
9%
2%
Norfolk
92%
7%
1%
Suffolk
88%
11%
2%
Life Science sector business
GCGP LEP
86%
11%
3%
Hertfordshire LEP
91%
7%
1%
numbers by size across
South East LEP
91%
7%
1%
comparator areas, 2016
East of England
90%
8%
2%
England
91%
7%
2%
No. of employees
Micro (0 to 9)
Small (10 to 49)
Medium-sized (50 to 249)
Large (250+)
Source: UK Business Counts, Office for
National Statistics
80%
100%
Babergh
95%
5%
Breckland
93%
7%
Broadland
92%
6%
2%
Forest Heath
89%
11%
Great Yarmouth
90%
8%
2%
Life Science sector business
Ipswich
89%
9%
2%
numbers by size across New
King`s Lynn and West Norfolk
94%
5%
2%
Anglia, 2016
Mid Suffolk
90%
8%
2%
North Norfolk
96%
4%
Norwich
93%
7%
South Norfolk
92%
6%
1%
St Edmundsbury
85%
13%
2%
32
Change in Life Science business units across
comparator areas, 2010 - 2016
New Anglia
32%
Norfolk
37%
Suffolk
26%
GCGP LEP
28%
Hertfordshire LEP
40%
South East LEP
40%
East of England
43%
England
56%
Source: UK Business Counts, Office for National Statistics
33
Babergh
15%
Change in Life
Science business units
Breckland
38%
across New Anglia,
Broadland
32%
2010 - 2016
Forest Heath
27%
Great Yarmouth
76%
Mid Suffolk
10%
North Norfolk
34%
Norwich
35%
South Norfolk
37%
St Edmundsbury
30%
Sources: UK Business Counts, Office for
Suffolk Coastal
36%
National Statistics
Waveney
17%
34
Life Science sector wages (selected occupations) - Median gross
annual pay all employees (UK)
£35,012
(2111) Chemical scientists
(12%)
£31,170
£35,041
(2112) Biological scientists and biochemists
(1%)
£34,524
£19,429
(3111) Laboratory technicians
(0%)
£19,421
£25,660
(1%)
(3119) Science, engineering and production technicians n.e.c.
£25,507
£19,697
2016
(3217) Pharmaceutical technicians
(2%)
£19,234
2014
£25,117
(5224) Precision instrument makers and repairers
(-15%)
£29,606
Figures in brackets
£24,954
denote percentage
(8114) Chemical and related process operatives
(5%)
change between 2014
£23,756
and 2016
Source: Annual Survey of Hours and Earnings, Office for National Statistics
35
Life Science sector wages (selected occupations) - Median gross
annual pay full time employees (UK)
£35,321
(2111) Chemical scientists
(8%)
£32,827
£36,845
(-3%)
(2112) Biological scientists and biochemists
£38,095
£20,716
(-5%)
(3111) Laboratory technicians
Figures in brackets
£21,850
denote percentage
change between 2014
£26,276
(3119) Science, engineering and production technicians n.e.c.
(-1%)
and 2016
£26,526
2016
£21,769
(3217) Pharmaceutical technicians
(4%)
2014
£20,883
£25,171
(5224) Precision instrument makers and repairers
(-16%)
£30,034
£25,342
(8114) Chemical and related process operatives
(1%)
£25,120
Source: Annual Survey of Hours and Earnings, Office for National Statistics
36
Life Sciences & Bio-Economy Sectors Apprenticeships
2011/12
2012/13
2013/14
2014/15
Health Assistant Practitioner
-
-
-
90
Health Allied Health Profession Support
5
10
6
5
Health and Social Care
2,045
2,010
2,255
2,680
Health Clinical Healthcare Support
70
110
110
95
Health Dental Nursing
75
110
65
95
Health Healthcare Support Services
25
15
15
40
Health Informatics
-
-
5
15
Health Maternity and Paediatric Support
5
5
10
7
Health Optical Retail
5
5
6
20
Health Pathology Support
5
5
5
5
Health Perioperative Support
5
15
15
9
Health Pharmacy Services
35
35
45
60
Laboratory and Science Technicians
5
20
8
8
Total
2,280
2,340
2,545
3,129
Source: Skills Funding Agency Data Cube
37
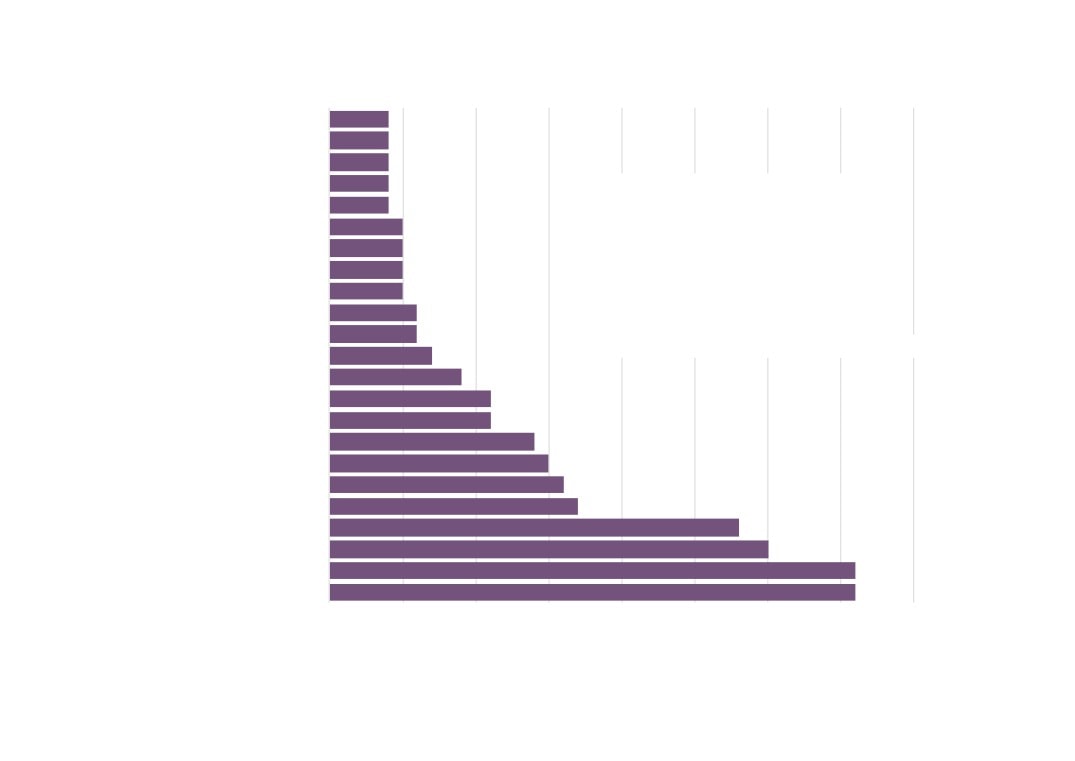
Life Sciences sector vacancies across New Anglia,
0
20
40
60
80
100
120
140
160
180
Jan 2012 - Dec 2016
Norwich
According to the Labour Insight Jobs tool, then
there were 1,295 postings for the sector in New
St Edmundsbury
Anglia between Jan. 1, 2012 and Dec. 31, 2016. A
further 228 postings had the potential to be within
Ipswich
the sector but a final judgement could not be made
on these due to their unspecified or unclassified
Forest Heath
nature.
King's Lynn and West Norfolk
The definition for the Life Sciences sector in this
exercise is slightly different to that we have defined
Mid Suffolk
using SIC codes. The definition used captures the
following industry and sectors: ‘Scientific research
North Norfolk
and development’, ‘Veterinary activities’,
‘Manufacture of basic pharmaceutical products and
Breckland
preparations’, ‘Manufacture of medical and dental
instruments and supplies’, ‘Manufacture of
Babergh
irradiation, electromedical and electrotherapeutic
equipment’, ‘Manufacture of optical instruments
South Norfolk
and photographic equipment’, and ‘Wholesale of
pharmaceutical goods’.
Suffolk Coastal
Please note that some caution needs to be applied
Waveney
to this data as results may reflect the way different
sectors recruit rather than real differences in the
Great Yarmouth
number of jobs.
Source: Labour Insight Jobs, Burning Glass
Broadland
Technologies
38
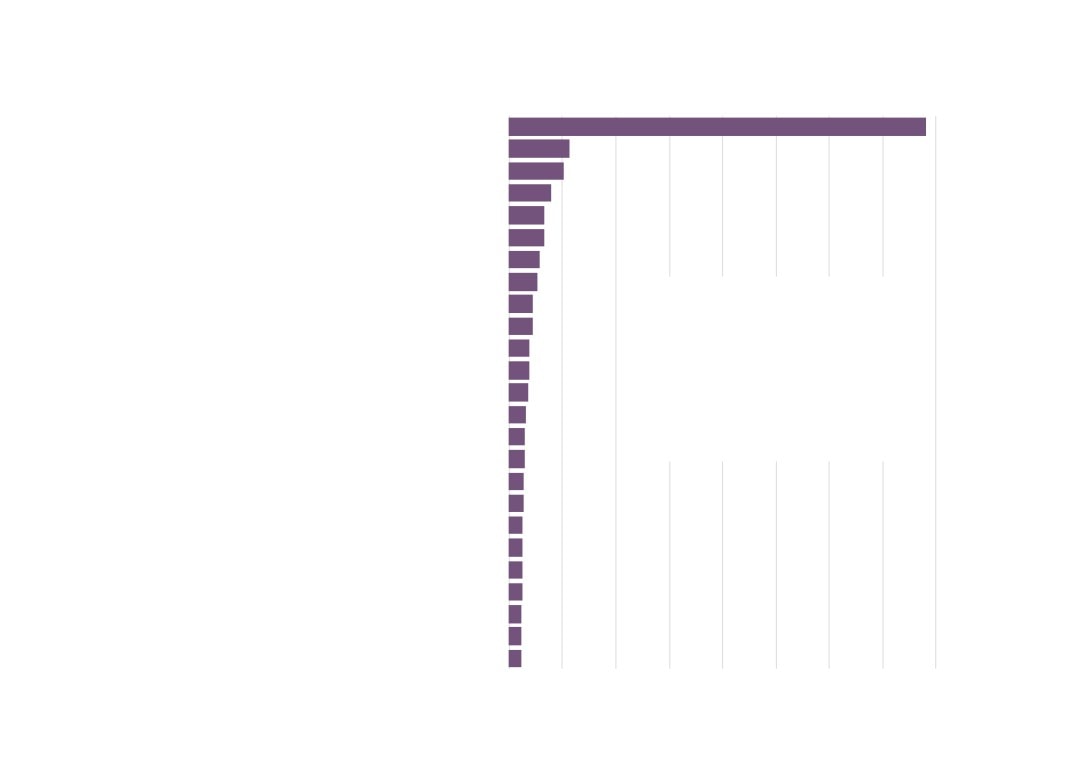
Jarvis Johnson Ltd
Harper Anderton Associates Ltd
Anchorage Veterinary Clinic
AJ Chambers
Top Life Sciences
Hawkedon and Homefield Vets Ltd
TEC Partners
Sector Employers
Swayne and Partners
CK Group
across New Anglia,
Ashfield
Jan 2012 - Dec 2016
Vet Seekers
Bridge Veterinary Practice Ltd
Source: Labour Insight Jobs, Burning Glass Technologies
Chemistree Ltd
Vetco Solutions Ltd
Seven Vets
RB Group Ltd
Envigo RMS, Inc
Medicus Resourcing Ltd
Toll Barn Veterinary Centre
CVS Group PLC
Companion Care Services Ltd
Institute of Food Research
Sanofi UK
Abcam
0
5
10
15
20
25
30
35
40
39
0
50
100
150
200
250
300
350
400
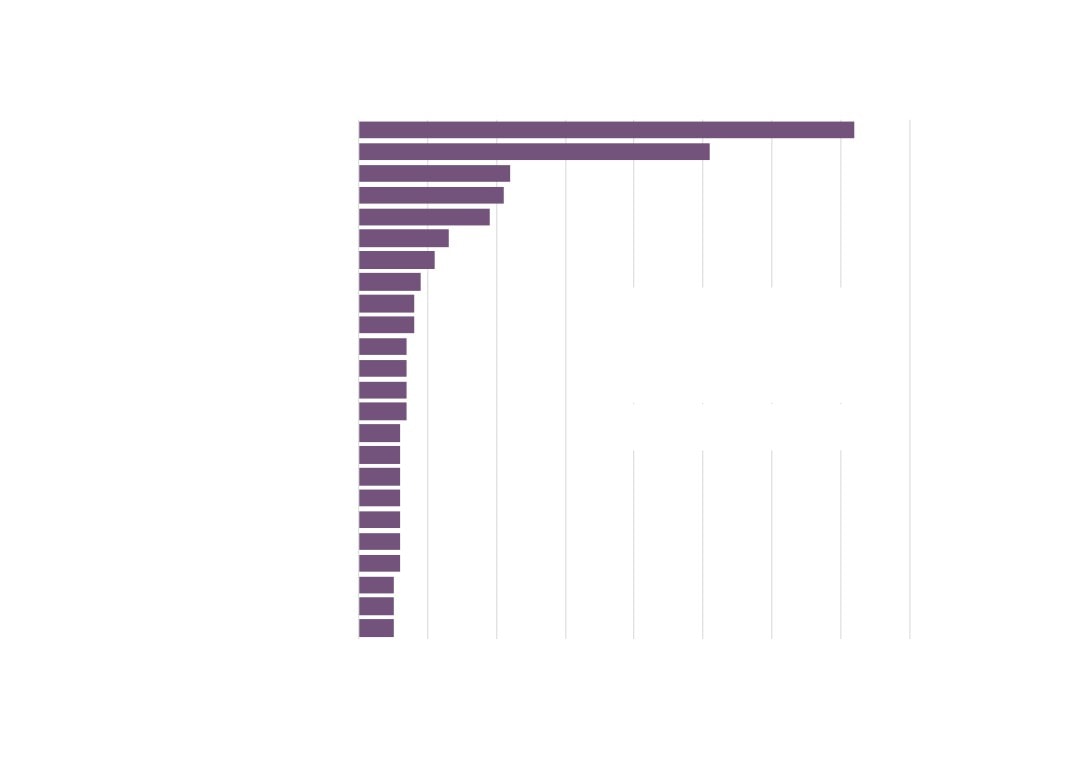
Veterinarians (2216)
Medical practitioners (2211)
Biological scientists and biochemists (2112)
Business sales executives (3542)
Programmers and software development professionals (2136)
Quality assurance and regulatory professionals (2462)
Design and development engineers (2126)
Quality assurance technicians (3115)
IT business analysts, architects and system designers (2135)
Life Sciences
Sales related occupations n.e.c. (7129)
sector vacancies
Marketing associate professionals (3543)
Engineering professionals n.e.c. (2129)
by occupation, Jan
Financial accounts managers (3538)
Routine inspectors and testers (8133)
2012 - Dec 2016
Source: Labour Insight Jobs, Burning
Health professionals n.e.c. (2219)
Glass Technologies
Marketing and sales directors (1132)
Production managers and directors in manufacturing (1121)
Receptionists (4216)
Chartered and certified accountants (2421)
Health services and public health managers and directors (1181)
Sales accounts and business development managers (3545)
Veterinary nurses (6131)
Planning, process and production technicians (3116)
Animal care services occupations n.e.c. (6139)
Draughtspersons (3122)
40
0
10
20
30
40
50
60
70
80
Veterinarian
Veterinary Surgeon
Account Manager
Quality Control Analyst
Quality Assurance Officer
Receptionist
Process Engineer
Clinical Director
Development and Test Engineer
Life Sciences sector
Research Scientist
Small Animal Vet
vacancies by job title,
Systems Engineer
Contract Analyst
Jan 2012 - Dec 2016
Practice Manager
Source: Labour Insight Jobs, Burning Glass
Area Sales Manager
Technologies
Design Engineer
Engineering Manager
Mechanical Design Engineer
Mechanical Engineer
Tax Manager
Territory Manager
Account Executive
Design Support Engineer
Electronics Engineer
41
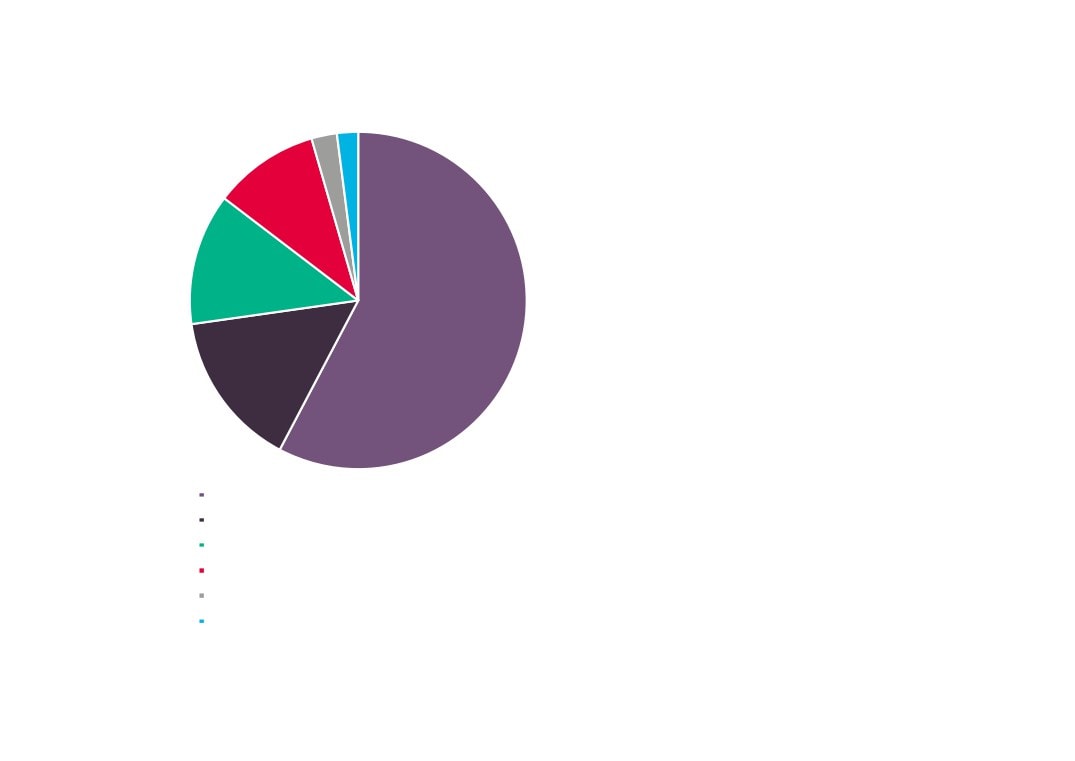
6
5
25
31
Life Sciences sector vacancies
by qualification level required,
142
Jan 2012 - Dec 2016
37
Source: Labour Insight Jobs, Burning Glass Technologies
Bachelor's degrees, graduate certificates and diplomas
Post graduate degrees, Level 5 S/NVQs, certificates and
diplomas
A-Levels, Highers, and Level 3 S/NVQs
GCSEs, Standard Grades, and Level 2 S/NVQs
Level 4 diplomas and certificates, HNCs, Level S/NVQs
Foundation degrees and HNDs
42
0
10
20
30
40
50
60
70
80
90
Project Management
Surgery
Pharmaceutical Industry Background
Good Manufacturing Practices (GMP)
Customer Service
Validation
Business Management
Product Sales
Business Development
Product Research
Technical Support
Computer Aided Draughting / Design (CAD)
Microsoft Office
Microsoft Excel
Marketing Sales
Life Sciences
Purchasing
SQL
sector vacancies by
Biology
Budgeting
skills required,
Primary Care
Jan 2012 - Dec
Product Marketing
Product Testing
Source: Labour Insight Jobs, Burning
Glass Technologies
Chemistry
Budget Management
X-Rays
43
Appendix 1 - Life Sciences & Bio-Economy sector definition (2007 SIC codes)
SIC Code
Pharmaceutical development and manufacture
21100
Manufacture of basic pharmaceutical products
21200
Manufacture of pharmaceutical preparations
46460
Wholesale of pharmaceutical goods
20130
Manufacture of other inorganic basic chemicals
20140
Manufacture of other organic basic chemicals
20590
Manufacture of other chemical products nec
Medical Technology Manufacture
32500
Manufacture of medical and dental instruments and supplies
32990
Other manufacturing nec
26110
Manufacture of electronic components
26511
Manufacture of electronic instruments and appliances for measuring, testing, and navigation, except industrial process control equipment
26512
Manufacture of electronic industrial process control equipment
26600
Manufacture of irradiation, electromedical and electrotherapeutic equipment
26701
Manufacture of optical precision instruments
27900
Manufacture of other electrical equipment
25990
Manufacture of other fabricated metal products nec
22290
Manufacture of other plastic products
28290
Manufacture of other general-purpose machinery nec
28410
Manufacture of metal forming machinery
28990
Manufacture of other special-purpose machinery nec
82990
Other business support service activities nec
33130
Repair of electronic and optical equipment
33140
Repair of electrical equipment
Life Sciences Research
72110
Research and experimental development on biotechnology
72190
Other research and experimental development on natural sciences and engineering
74909
Other professional, scientific and technical activities (not including environmental consultancy or quantity surveying)
86900
Other human health activities
45
Appendix 2 - Estimates for GVA per employee by Life Sciences & Bio-Economy sub sector
GVA per employee
Life Sciences Research
£60,000
Pharmaceutical development and manufacture
£81,000
Medical Technology manufacture
£65,000
These values were calculated for each of the three sub sectors and used to estimate the economic value and employment for small companies
where financial information was not able to be directly collected. The values are based on the median figures obtained in order to minimise the
impact of outliers. These results are based on data for a sample of 107 smaller firms out of the population of around 1,400.
Source: Association of the British Pharmaceutical Industry report ‘The economic contribution of the UK Life Sciences industry’ (March 2017),
prepared by PricewaterhouseCoopers LLP
46