Learning & Skills Sector
Data Pack
Final Version 12.02.19
Contents
Introduction to the Sector Data Pack
Page 3
Introduction to and Definition of the Learning & Skills Sector
Page 3
The Learning & Skills Sector in in New Anglia
Page 4
GVA
Page 5
Employment
Page 6
Learning & Skills Sector Skills Supply and Demand
Page 13
UKCES Employer Skills Survey Results
Page 14
Further Education Learning Aims analysis
Page 19
Apprenticeships
Page 24
Higher Education
Page 27
Labour Insight Jobs tool sector analysis
Page 30
‘Where the Work is’ tool sector analysis
Page 37
A Future View of the Learning & Skills Sector
Page 40
Appendices
Page 46
Learning & Skills Sector SIC and SOC codes
Page 47
2
Introduction to the Sector Data Pack
The role of the Sector Data Pack is to bring together the latest socio-economic and labour market data and present both an up-to-
date, and future view, of the sector and any underlying issues within the area that could impact upon it. Data is presented in a
navigable format without comment, with interpretation at this stage mainly left to the reader.
The Data Pack informs the Sector Evidence Report, the key findings from which help to inform the priorities developed in the Sector
Skills Plan. In most instances data has been analysed and presented down to local authority level. In some instances, and even
where local authority data is available, it has not been presented in the data pack due to issues of unreliability and small sample
sizes. This is particularly the case with data from the Annual Population Survey and the Annual Survey of Hours and Earnings.
Introduction to the Learning and Skills Sector Definition
In compiling the data pack for the Learning and Skills sector skills plans, we have considered both the broad industrial group of
‘Education’ (which captures both teaching and non-teaching activity), and the teaching occupations that fall under the broad
occupational group of ‘Teaching and Educational Professionals’. Full details of the sub sectors and occupations that each of these
definitions cover are presented in the appendices (page 47).
3
The Learning & Skills
Sector in New Anglia
4
Gross Value
£2.14bn
Added
100%
£113m
Educational support activities
90%
£289m
Other education nec
80%
£159m
Sports, recreation and cultural education
70%
Gross Value
First degree and post graduate level higher education
60%
£611M
Added by Sub
50%
Post-secondary non-tertiary education
Sector
40%
Source: New Anglia LEP Local
Technical and vocational secondary education
Economic Strategy Analysis
30%
General secondary education
£889m
20%
Primary education
10%
Pre-primary education
0%
5
Employment by
65,914
Industry
100%
3,374
Educational support activities
90%
5,286
Other education nec
5,011
80%
4,736
Sports, recreation and cultural education
70%
Workforce Jobs
First degree and post graduate level higher education
60%
16,879
by Sub Sector
50%
Post-secondary non-tertiary education
Source: New Anglia LEP Local
Economic Strategy Analysis
40%
Technical and vocational secondary education
30%
General secondary education
28,274
20%
Primary education
10%
Pre-primary education
0%
6
100%
5%
7%
8%
Educational support activities
7%
6%
7%
Other education nec
Proportion of
27%
26%
23%
Post-secondary non-tertiary education
Total Education
Sector
Technical and vocational secondary
Employment by
education
Sub Sector
General secondary education
Source: Business Register and
Employment Survey, Office for
45%
41%
40%
National Statistics
Primary education
Pre-primary education
2%
4%
3%
0%
New Anglia
East of England
England
7
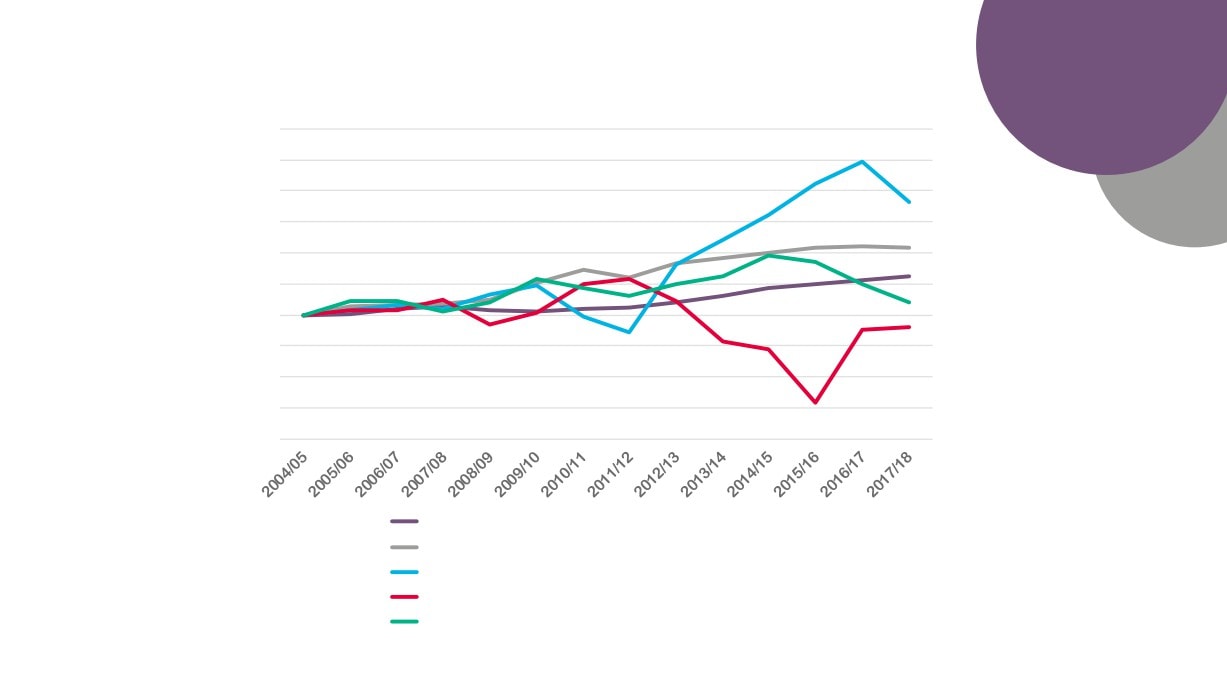
Employment by
UK Teaching and Educational Employment Change
Occupation
2004/05 = 10000)
160
150
140
130
120
110
100
90
80
70
60
All Professions UK
231 Teaching and Educational Professionals UK
2311 Higher education teaching professionals UK
2312 Further education teaching professionals UK
2314 Secondary education teaching professionals UK
Source: Annual Population Survey, Office for National Statistics
8
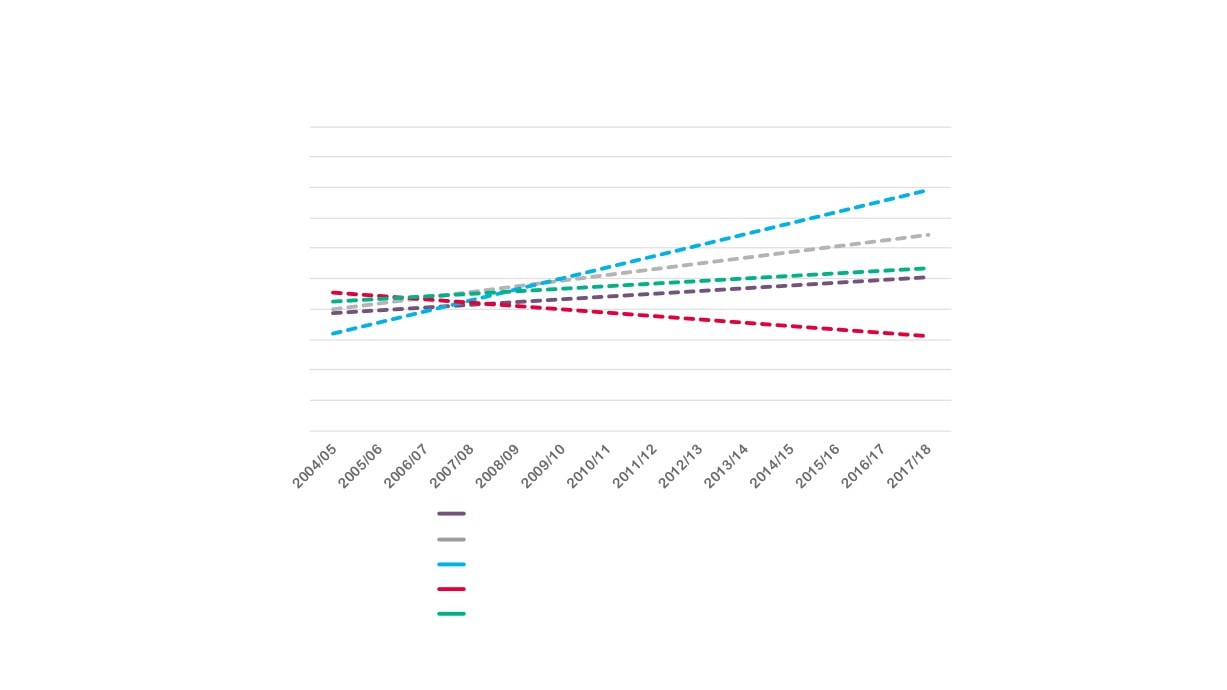
UK Teaching and Educational Employment Change Trends,
2004/05 = 10000)
160
1
150
1
1 140
130
1
1 120
1 110
1 100
90
80
70
60
All Professions UK
231 Teaching and Educational Professionals UK
2311 Higher education teaching professionals UK
2312 Further education teaching professionals UK
2314 Secondary education teaching professionals UK
Source: Annual Population Survey, Office for National Statistics
9
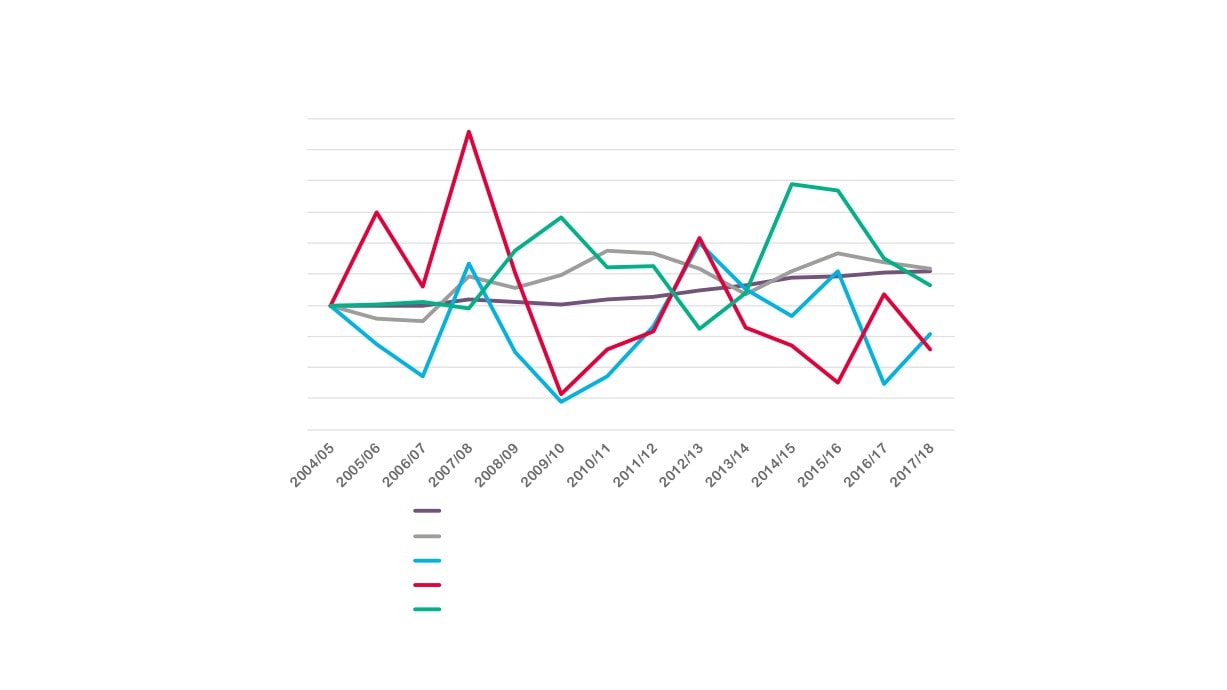
East of England Region Teaching and Educational
Employment Change, 2004/05 = 100
160
150
140
130
120
110
100
90
80
70
60
All Professions East
231 Teaching and Educational Professionals East
2311 Higher education teaching professionals East
2312 Further education teaching professionals East
2314 Secondary education teaching professionals East
Source: Annual Population Survey, Office for National Statistics
10
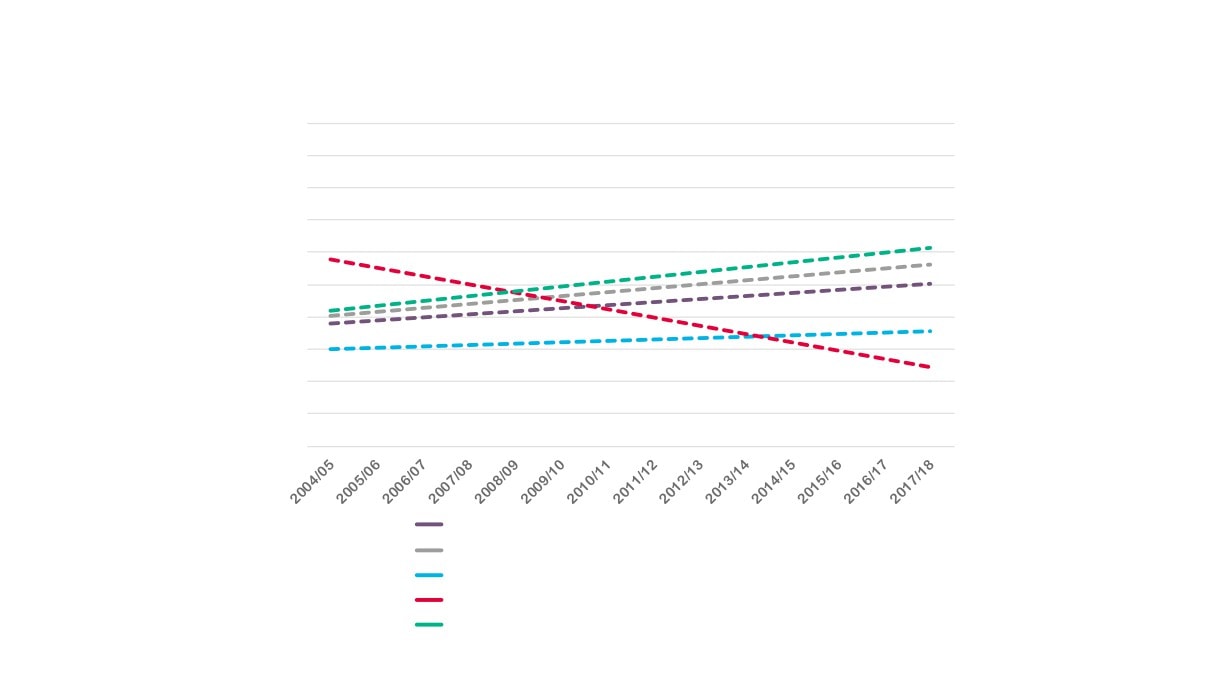
East of England Region Teaching and Educational
East Region Analysis (2004/05 = 100)
160
150
140
130
120
110
100
90
80
70
60
All Professions UK
231 Teaching and Educational Professionals UK
2311 Higher education teaching professionals UK
2312 Further education teaching professionals UK
2314 Secondary education teaching professionals UK
Source: Annual Population Survey, Office for National Statistics
11
Occupation by Age Band, England 2016
Total Working
12%
24%
23%
25%
15%
231 Education Professionals
6%
24%
27%
27%
17%
2312 'Further education teaching professionals'
14%
31%
29%
25%
0%
100%
16-24
25-34
35-44
45-54
55-64
Source: Annual Population Survey, Office for National Statistics
12
Learning & Skills Sector
Skills Supply and
Demand
13
UKCES ESS
2015
The following analysis uses the LEP level data released as part of the UK Commission for Employment
and Skills (UKCES) Employer Skills Survey (ESS) 2017. The data covers the areas of vacancies, skills
gaps, training, and staff retention and underutilisation.
Data is published for a limited number of broad sectors at LEP level and we have chosen the sector of
‘Education’ as that being closest to encapsulating Learning & Skills sector activity. In all instances,
national, regional, and New Anglia LEP averages are presented as comparators.
In total, 2,280 employers in New Anglia were surveyed, 153 of which were ‘Education’ employers.
14
23%
Vacancies
34%
Establishments with any vacancies
22%
20%
11%
17%
Have at least one vacancy that is hard to fill
11%
8%
8%
12%
Have a skills shortage vacancy (prompted or
unprompted)
8%
6%
4%
1%
Number of vacancies as a % of all employment
4%
4%
28%
28%
% of all vacancies which are SSVs
25%
22%
New Anglia (Average) Education (New Anglia) East of England (Average) England (Average)
15
Skills Gaps &
17%
Underutilisation
25%
% of establishments with any staff not fully
proficient
16%
13%
5%
New Anglia (Average)
3%
Education (New Anglia)
Number of staff not fully proficient as a % of
employment
6%
East of England (Average)
4%
England (Average)
32%
New Anglia (Average)
45%
Education (New Anglia)
Establishments with underutilised staff
34%
East of England (Average)
34%
England (Average)
16
Training
68%
96%
% of establishments training staff over the last 12 months
69%
66%
49%
% of establishments providing off-the-job training in the last
85%
12 months
49%
48%
54%
% of establishments providing on-the-job training in the last
82%
12 months
56%
53%
47%
% of training establishments providing online training or e-
77%
learning in the last 12 months
51%
52%
59%
76%
Number trained as % of total staff
62%
62%
New Anglia (Average)
Education (New Anglia)
East of England (Average)
England (Average)
17
6.7
4.7
Training days per trainee
6.4
6.4
4.0
3.5
Training days per staff
3.9
4.0
New Anglia (Average)
Education (New Anglia)
East of England (Average)
England (Average)
18
FE Learning
Aims
All data (unless stated otherwise) is sourced from the Department for Education’s Further Education data library
In order to present information that is relevant to New Anglia LEPs high performing and underpinning sectors then
we have identified FE and skills provision data split by Sector Lead Body and aligned a best-fit with each sector.
The Sector Lead Bodies identified as being the most relevant to the Learning & Skills sector are: Supporting
Teaching & Learning in Schools; and Lifelong Learning.
However, not all FE and Skills learning aims align with a sector lead body. In fact, on average around two thirds
are classed as unknown. This means that we are basing results here on roughly a third of the data.
Please note that all data is rounded to the nearest 10 and that therefore some figures presented may not add to
the sum totals presented.
19
Learning & Skills Sector Learning Aims Delivered to New
Anglia Learners by Sector Lead Body, 2010/11 and 2012/13
2010/11
2012/13
1,010
900
700
0
Supporting Teaching & Learning in
Lifelong Learning
Schools
20
 Change in Learning & Skills Sector Learning Aims
Delivered to Resident Learners by Sector Lead Body
2010/11 - 2012/13
11%
Total inc. Unknown
9%
-63%
Learning & Skills
-62%
-31%
Supporting Teaching & Learning in Schools
-19%
-100%
Lifelong Learning
-100%
New Anglia
National
21
Learning & Skills Sector Learning Aims Delivered to New Anglia
Learners by New Anglia Providers by Sector Lead Body,
2010/11 and 2012/13
840
790
610
Supporting Teaching & Learning in Schools
Lifelong Learning
2010/11
2012/13
22
Change in Learning & Skills Sector Learning Aims Delivered to
Resident Learners by Domiciled Providers by Sector Lead Body,
2010/11 - 2012/13
5%
Total inc. Unknown
9%
-38%
Total not inc. Unknown
7%
-63%
Learning & Skills
-62%
-23%
Support ing Teaching & Learning in Schools
-19%
-100%
Lifelong Learning
-100%
New Anglia National
23
Apprenticeships
Apprenticeship Participation by Sector,
2014/15
Human health and social work activities
5,840
Wholesale and retail trade
2,560
Accomodation and food service activities
1,900
Manufacturing
1,820
Construction
1,740
Administrative and support service activities
1,350
Education
1,330
Professional, scientific and technical activities
900
Other service activities
780
Arts, entertainment and recreation
680
Public administration and defence
570
Transportation and storage
540
Financial and insurance activities
520
Information and communication
370
Agriculture, Forestry and Fishing
350
Real estate activities
290
Mining and Quarrying
50
Water supply, sewerage, and waste management
40
Electricity, gas, steam and air conditioning supply
10
Source: Department for Education
24
2.2%
Agriculture, forestry & fishing (A)
2.5%
1.1%
Mining, quarrying & utilities (B,D and E)
2.7%
2.9%
Manufacturing (C)
3.1%
4.6%
Construction (F)
4.7%
2.2%
Wholesale and retail trade (G)
2.1%
1.6%
Transport & storage (inc postal) (H)
1.9%
Apprenticeship
3.8%
Accommodation & food services (I)
3.2%
Numbers as a
2.2%
Information & communication (J)
New Anglia
1.4%
Proportion of Total
2.6%
England
Financial & insurance (K)
3.2%
Sector Workforce,
3.6%
Property (L)
3.1%
2014/15
2.6%
Professional, scientific & technical (M)
1.6%
Source: Department for Education
2.3%
Business administration & support services (N)
2.3%
2.1%
Public administration & defence (O)
3.6%
2.4%
Education (P)
2.7%
6.3%
Health (Q)
5.9%
Arts, entertainment, recreation & other services
4.4%
(R,S,T and U)
4.9%
3.3%
Total
25
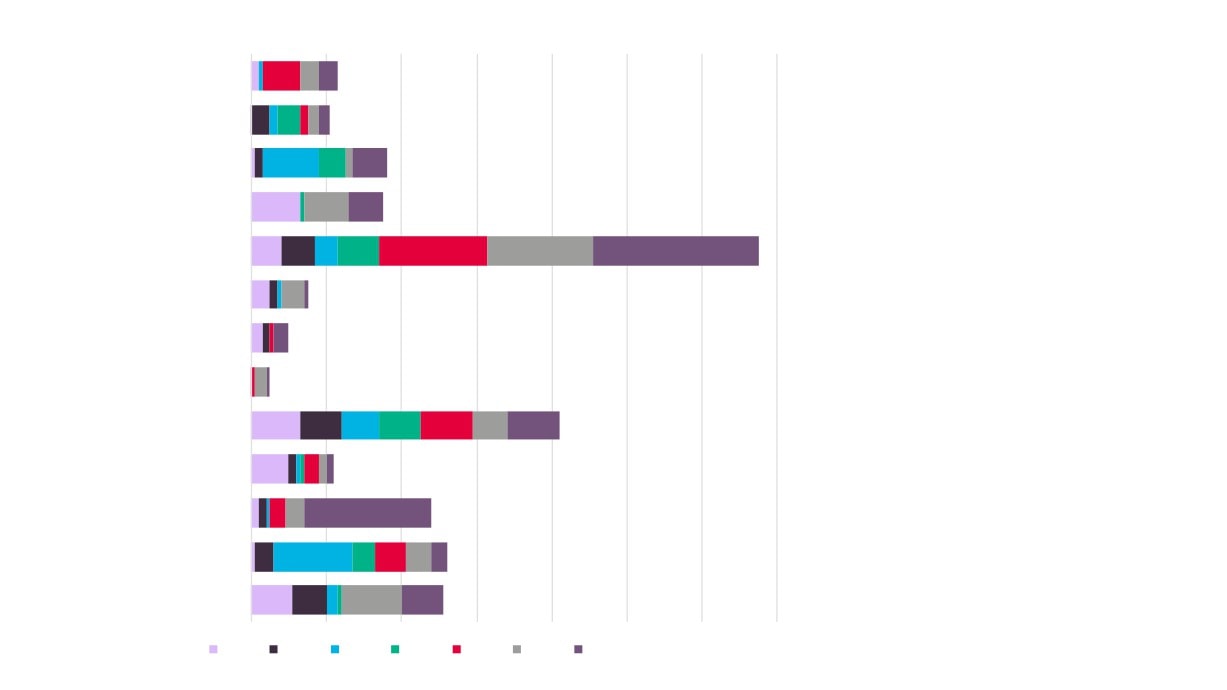
3.1%
Apprenticeships
Apprenticeship Starts by Learning & Skills Related Framework
Apprenticeship Framework
2015/16
2016/17
2017/18
Intermediate Advanced Higher Total Intermediate Advanced Higher Total Intermediate Advanced Higher Total
Supporting Teaching and
40
130
0
170
60
210
0
270
10
90
0
100
Learning in Schools
Learning and Development
0
20
0
20
0
0
0
0
0
0
0
0
Supporting Teaching and
0
70
0
70
0
40
0
40
0
40
0
40
Learning in Physical Education
Grand Total
40
220
0
260
60
250
0
310
10
130
0
140
Source: Education and Skills Funding Agency Data Cube
26
Higher
Top Origins of Students
STUDY 2010/11 - 2014/15
Coming to New Anglia and
South East
25
Education
Studying Education ( please
note that some data not
100
shown due to low numbers
grew up outside New
GCGP
20
and their subsequent
Anglia and studied
suppression)
Education in New Anglia
South East
160
South East Midlands
135
Greater Lincolnshire
110
London
100
1,810
D2N2
80
grew up in New Anglia and
studied Education in England
Coast to Capital
55
Greater Cambridge & Greater
55
Peterborough
Lancashire
40
Top 10 Destinations
Overlap between LCR and York,
for Students
1,050
35
North Yorks & East Riding
Growing Up in New
Anglia and Studying
Leeds City Region (LCR)
30
(58%)
Education Elsewhere
left and studied outside
New Anglia
Total studied Education in
Over the period 2010/11 - 2014/15
New Anglia
inclusive, New Anglia had a net flow of
students studying Education of
860
of which 12% came
27
- 950
from outside New Anglia
EMPLOYMENT 2010/11 - 2014/15
New Anglia
190
510
studied Education outside
South East
95
New Anglia and
subsequently found
South East Midlands
90
employment in New Anglia
London
45
D2N2
30
Greater Lincolnshire
30
220
Lancashire
30
studied Education in New
Anglia and subsequently
Coast to Capital
25
Top 10 Origins of
secured employment in
England
Students Studying
Leeds City Region (LCR)
20
Education and
Overlap between LCR and York,
Securing Employment
20
North Yorks & East Riding
in New Anglia
30
Hertfordshire
15
(14%)
left and found
employment outside
Total studied Education and employed
Over the period 2010/11 - 2014/15
New Anglia
in New Anglia
inclusive, New Anglia had a net flow of
workers who studied Education of
700
of which 73% came
from outside New Anglia
+490
28
New
New
COMPARATORS
Education
National
Anglia
Anglia
Stay for study and employment
86.4%
87.6%
27.3%
29.3%
Leave for study, return for employment
30.2%
30.4%
Leave for study, do not return
38.7%
34.3%
Stay for study, leave for employment
13.6%
12.4%
3.9%
6.0%
NOTES ON DATA SOURCES & METHODOLOGY
- The data presented here is from the population of England-domiciled students who studied for a first degree at an English higher education
provider between the academic years 2010-11 and 2014-15 inclusive. Data comes from the Higher Education Statistics Agency (HESA) Student
Record, the Education and Skills Funding Agency’s Individualised Student Record (ILR) data and the Destinations of Leavers from Higher Education
(DLHE) survey.
12%
- Numbers are Full Person Equivalents. This is because individuals can be taught through collaborative arrangements at two (or more) institutions.
In order to count provision against both institutions, student counts have been divided between teaching institutions in proportion to the percentage
of time taught at each.
- Data presented on mobility between home and study, where ‘home’ refers to the domicile of a student before they go to university, is for the
population of students who entered higher education between 2010-11 and 2014-15 and who have a valid postcode for both home and study. This is
taken from the HESA Student Record and the ILR. The total FPE for this population was 1,817,855.
- Data using employment location is restricted to students who left higher education between 2010-11 and 2014-15 and who provided a valid full or
partial employment postcode in response to the DLHE survey. The total FPE for this population was 710,800.
- Because these two populations differ significantly means that we are unable to make direct comparisons between the two i.e. calculate the true
retention of students, and movements into employment, for an area.
29
Labour Insight
Jobs
The following section presents data from Labour Insight, a Burning Glass analytical tool. This
tool collects details of online job postings from multiple sources and enables the analysis of
these postings based on specific skills, educational requirements, and job titles, for example.
Please note that whilst Labour Insight will capture more information on the jobs market than
more traditional Department for Work and Pensions vacancy data, the fact that not all job
vacancies are advertised means that there will still be gaps in the findings.
In terms of the Learning and Skills sector then according to the Labour Insight Jobs tool, there
were 27,026 teaching occupation vacancies posted in New Anglia between Jan. 1, 2012 and
Dec. 31, 2018.
As our interest in the Learning and Skills sector is focused on teaching roles (as opposed to the
wider employment opportunities provided by the education sector), we have used (and in some
cases focused in on) the following Standard Occupational Classification (SOC) codes in our
analysis:
- Secondary education teaching professionals (2314)
- Teaching and other educational professionals n.e.c. (2319)
- Higher education teaching professionals (2311)
- Senior professionals of educational establishments (2317)
- Further education teaching professionals (2312)
- Primary and nursery education teaching professionals (2315)
- Special needs education teaching professionals (2316)
- Education advisers and school inspectors (2318)
30
Burning Glass Labour Market Analysis of All Teaching Occupations
(excluding Primary) in the Education Sector, 2018
Job Postings per 1000 people
Travel to Work Area
Job Postings
Location Quotient
employed, last 12 months
Bury St Edmunds
251
4
Lower demand than average
Norwich
675
3
Much lower demand than average
Ipswich
479
3
Much lower demand than average
King's Lynn
163
2
Much lower demand than average
Lowestoft
103
2
Much lower demand than average
Great Yarmouth
67
1
Much lower demand than average
Thetford & Mildenhall
77
1
Much lower demand than average
Cromer & Sheringham
9
1
Much lower demand than average
31
Burning Glass Labour Market Analysis of Further Education
Teaching Occupations, 2018
Job Postings per 1000 people
Travel to Work Area Job Postings
Location Quotient
employed, last 12 months
Bury St Edmunds
35
0.5
Much higher demand than average
Ipswich
47
0.3
Average demand
Great Yarmouth
8
0.2
Much lower demand than average
Norwich
15
0.1
Much lower demand than average
Lowestoft
6
0.1
Much lower demand than average
Thetford & Mildenhall
4
0.1
Much lower demand than average
Cromer & Sheringham
1
0.1
Much lower demand than average
King's Lynn
1
0.0
Much lower demand than average
32
New Anglia Teaching Vacancies Over Time
4,500
4,000
3,500
3,000
2,500
2,000
1,500
1,000
500
0
2012
2013
2014
2015
2016
2017
2018
Source: Burning Glass Labour Market Insight
33
New Anglia Selected Teaching Vacancies by
Occupation Over Time
2018
2017
2016
2015
2014
2013
2012
0%
10%
20%
30%
40%
50%
60%
70%
80%
90%
100%
Secondary education teaching professionals (2314)
Teaching and other educational professionals n.e.c. (2319)
Higher education teaching professionals (2311)
Senior professionals of educational establishments (2317)
Further education teaching professionals (2312)
Source: Burning Glass Labour Market Insight
34
New Anglia Further Education Teaching Vacancies Over Time
2018
2017
2016
2015
2014
2013
2012
0
20
40
60
80
100
120
140
160
Source: Burning Glass Labour Market Insight
35
0
20
40
60
80
100
120
140
Babergh
Breckland
Forest Heath
Great Yarmouth
Further Education
Ipswich
Teaching Vacancies
King's Lynn and West Norfolk
Over Time Across
New Anglia
Mid Suffolk
Source: Burning Glass Labour Market Insight
North Norfolk
Norwich
South Norfolk
St Edmundsbury
Suffolk Coastal
Waveney
2012
2013
2014
2015
2016
2017
2018
36
Where the
Work is
The following analysis makes use of data and findings available via the online toolkit http://wheretheworkis.org/ . The findings presented
are a result of combining data from the UKCES ‘Working Futures’ programme and job vacancy data from the Labour Market Insight tool
developed by Burning Glass.
Limitations
Though the ‘Where the work is’ tool provides a comprehensive and detailed free-to-use dashboard of supply and demand in the UK, the
following limitations should be taken into account when interpreting the data:
- Senior Management and Elementary roles
Occupations not open to recent HR graduates or FE finishers are not considered. Similarly, occupations that do not require any formal
qualifications or training are also excluded from this tool, since the number of job-seekers cannot be meaningfully quantified.
- Matching supply and demand
Some occupations do not have specific qualifications or subject-specific requirements (such as sales, marketing and related associate
professionals). As a result of this, and despite the fact that many people with a broad range of qualifications can apply for these
occupations, they frequently appear ‘undersupplied’ in the tool, i.e. when the “job opportunity” is low. Occupations with very small sample
sizes (either of finishers or job postings) are excluded from the dataset.
- Internal and international migration
Some occupations do not rely solely on FE finishers or HE graduates from their immediate location. Many people travel to find work, often
moving across the country. Other occupations, such as those on the Migration Advisory Committee’s shortage occupation list, may rely
more heavily on jobseekers arriving from outside the UK.
- Online and offline postings
Burning Glass Technologies (BGT) acknowledge that not all jobs are posted online, although a comparison of the Annual Survey of Hours
and Earnings (ASHE) employment data and BGT postings data for UK in 2014 showed a 94 per cent correlation between ASHE and BGT
occupational distributions. The BGT posting data slightly overestimate the proportion of professional and associate professional
occupations, while slightly underestimating the proportion of elementary occupations.
37
Where the
Work is -
Location Quotient - Measure of Job
Various
Posting Density relative to employment
indexed to the national density relative to
employment
Number of Job Postings asking for entry-
Education
0.68
Professionals
level (2 years of experience or fewer) and
school leaver education levels, further
education levels, and higher education
levels
Advertised Salaries for Job
Postings in 2015
HE
£35,200
2,153
FE
Education
£35,300
Professionals
£37,000
School leaver
350
69
Education Professionals
New Anglia East of England
England
38
Opportunity
Scores
Opportunity Score - Score based on the Demand
Supply Ratio of FE / HE postings within a
geography, from Very Low (0) to Very High (100)
99
99
Educat
99
Professi
Education
99
Professionals
99
99
New Anglia
East of England
England
39
A Future View of the
Learning & Skills Sector
40
Forecasting
Models
The following analysis uses data from the East of England Forecasting Model (EEFM) and the UK
Commission for Employment and Skills (UKCES) Working Futures data (WF).
Where possible we have presented analysis for both the Education sector, and Teaching and
Educational Professionals. We note here again that the Education sector is much wider than that of
Teaching and Educational Professionals as it captures the numerous non-teaching roles that are
supported by the sector.
Please also note that neither model, or the projections they produce, take into account the New Anglia
LEPs ambitions for growth in Gross Value Added (GVA) and employment.
41
Industry
Employment
Education Sector Employment Change,
Projections
2014 = 100
110
105
100
95
90
2014
2016
2018
2020
2022
2024
2026
2028
2030
2032
2034
2036
2038
2040
2042
2044
Education (EEFM)
Education (WF)
42
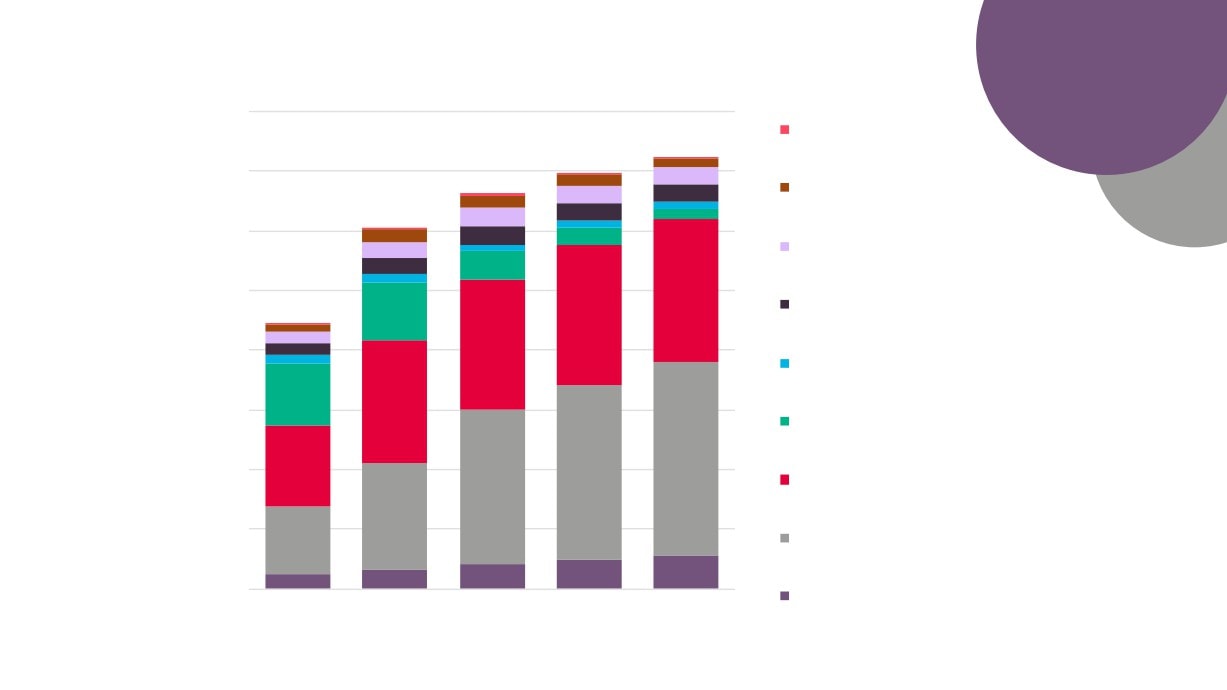
Teaching and Educational Professionals
Occupation &
Qualification
Employment and Qualification Change
40,000
Projections
No Qualification
35,000
QCF1 GCSE(below grade C) &
equivalent
30,000
QCF2 GCSE(A-C) & equivalent
25,000
QCF3 A level & equivalent
20,000
QCF4 HE below degree level
15,000
QCF5 Foundation
degree;Nursing;Teaching
10,000
QCF6 First degree
5,000
QCF7 Other higher degree
0
QCF8 Doctorate
1994
2004
2014
2019
2024
Source: Working Futures, UK Commission for Employment and Skills
43
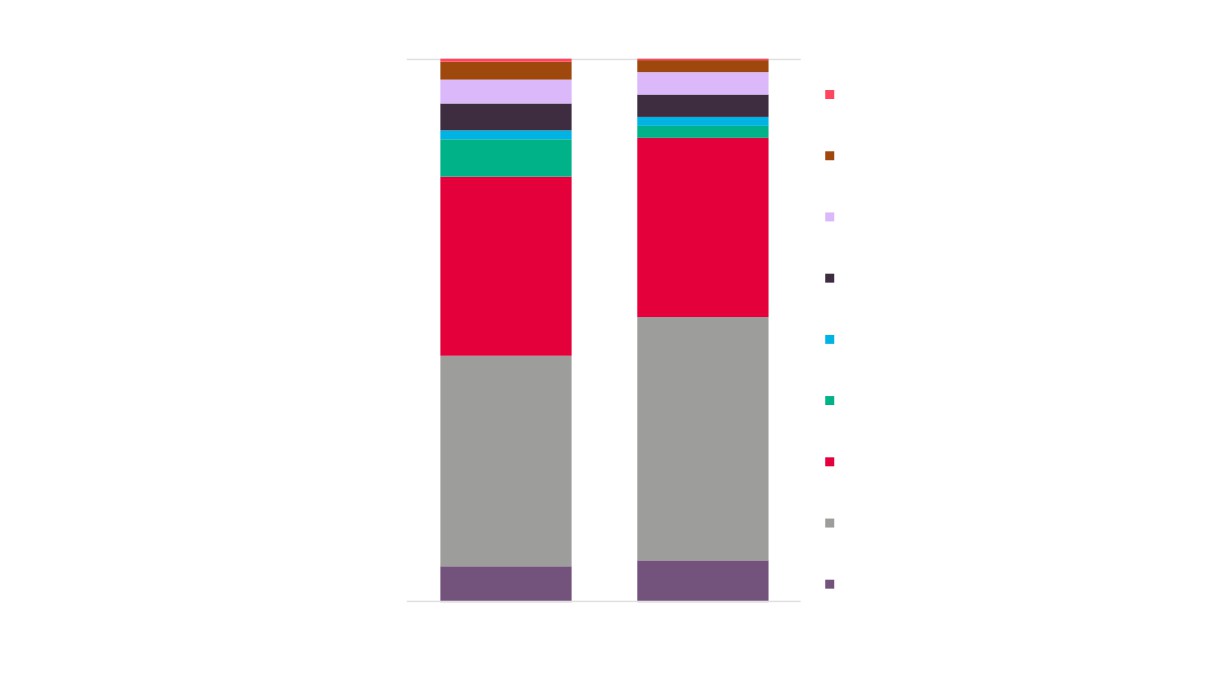
100%
3%
2%
4%
5%
No Qualification
4%
5%
7%
QCF1 GCSE(below grade C) & equivalent
Teaching and
QCF2 GCSE(A-C) & equivalent
33%
Educational
33%
QCF3 A level & equivalent
Professionals
Qualification Change
QCF4 HE below degree level
Source: Working Futures, UK Commission
for Employment and Skills
QCF5 Foundation degree;Nursing;Teaching
45%
39%
QCF6 First degree
QCF7 Other higher degree
6%
8%
QCF8 Doctorate
0%
2014
2024
44
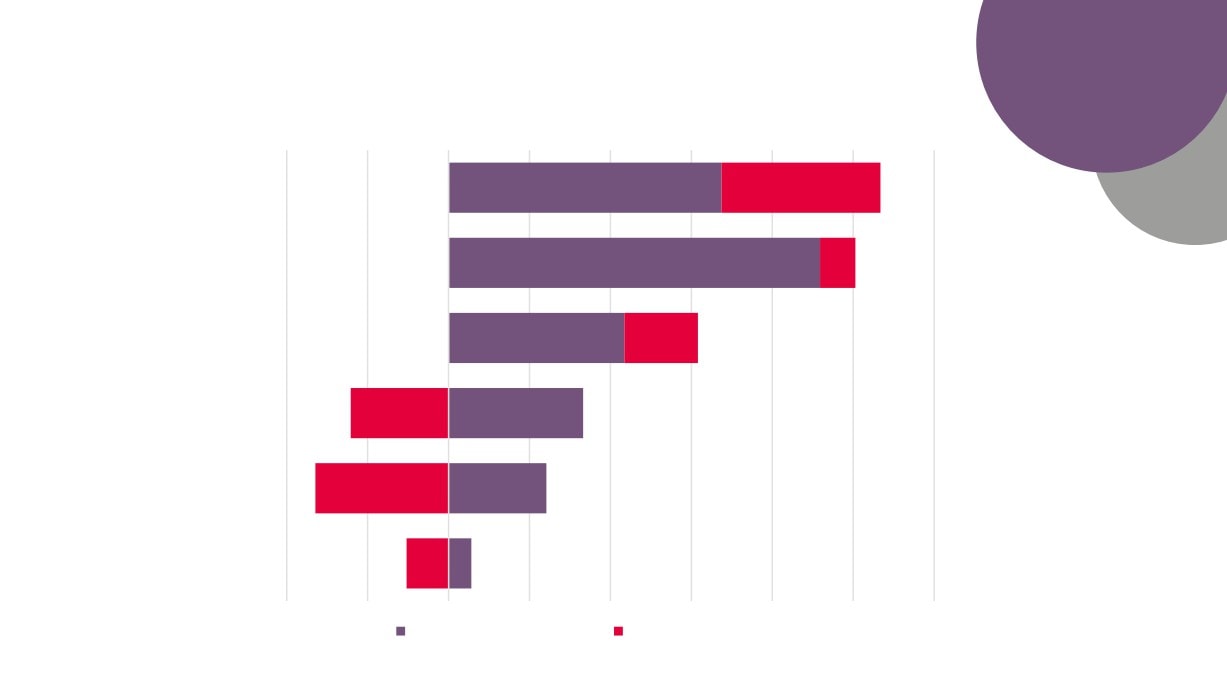
Replacement &
Education Sector Replacement and Expansion
Expansion
Demand by Qualification, 2014 - 2024
Demand
-4,000
-2,000
0
2,000
4,000
6,000
8,000
10,000
12,000
QCF 7-8
QCF 4-6
QCF 3
QCF 2
QCF 1
No Qual
Replacement Demand
Expansion Demand
45
Source: Working Futures, UK Commission for Employment and Skills
Education Standard
Teaching and Educational
Industrial Classification
Standard Occupational
(SIC) codes
Classification (SOC) codes
SIC : Education Subsector
Occupation (SOC)
85100 : Pre-primary education
Higher education teaching professionals (2311)
85200 : Primary education
Further education teaching professionals (2312)
85310 : General secondary education
Secondary education teaching professionals (2314)
85320 : Technical and vocational secondary education
Primary and nursery education teaching professionals (2315)
85410 : Post-secondary non-tertiary education
Special needs education teaching professionals (2316)
85421 : First-degree level higher education
Senior professionals of educational establishments (2317)
85422 : Post-graduate level higher education
Education advisers and school inspectors (2318)
85510 : Sports and recreation education
Teaching and other educational professionals n.e.c. (2319)
85520 : Cultural education
85590 : Other education nec
85600 : Educational support activities
47