Financial Services &
Insurance Data Pack
Version 2 05.03.2018
CONFIDENTIAL
Contents
-
Introduction to the Sector Data Pack
-
Introduction to and Definition of the Financial Services & Insurance Sector
-
The Financial Services & Insurance Sector in New Anglia
o Overview
o GVA
o Employment
o Enterprises
o Wages
-
Financial Services & Insurance Sector Skills Supply and Demand
o Qualifications
o UKCES Employer Skills Survey sector analysis
o Further Education Learning Aims analysis
o Apprenticeships
o Labour Insight Jobs tool sector analysis
o
‘Where the Work is’ tool sector analysis
-
A Future View of the Financial Services & Insurance Sector
-
Appendix - Financial Services & Insurance Sector Definition
2
Introduction to the Sector Data Pack
The role of the Sector Data Pack is to bring together the latest socio-economic and labour market data and present both an up-to-date, and
future view, of the sector and any underlying issues within the area that could impact upon it. Data is presented in a navigable format without
comment with interpretation at this stage left to the reader
The Data Pack informs the Sector Evidence Report, the key findings from which help to inform the priorities developed in the Sector Skills Plan.
The Sector Evidence Report is also summarised within the Sector Skills Plan and appears in full in the its appendices.
In most instances data has been analysed and presented down to local authority level. In some instances, and even where local authority data
is available, it has not been presented in the data pack due to issues of unreliability and small sample sizes. This is particularly the case with
data from the Annual Population Survey and the Annual Survey of Hours and Earnings.
Introduction to and Definition of the Financial Services & Insurance
Sector
3
The Financial Services
& Insurance Sector in
New Anglia
a
4
Overview
Financial Services & Insurance sector
contribution to the local economy
£2.14bn
6.0%
29,200
1,920
3.7%
3.2%
GVA
Employment
Enterprises
Source: New Anglia LEP Economic Strategy evidence base work
5
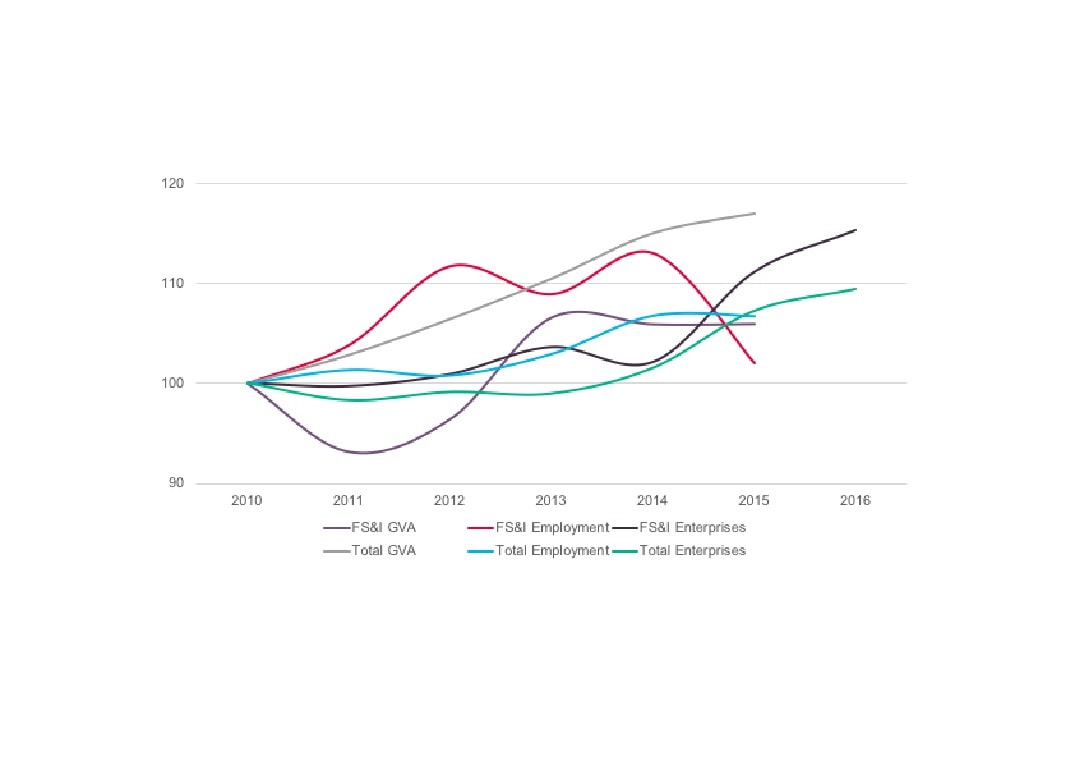
Financial Services & Insurance sector contribution to growth in
the local economy (2010=100)
Source: New Anglia LEP Economic Strategy evidence base work
6
Gross Value
Added (GVA)
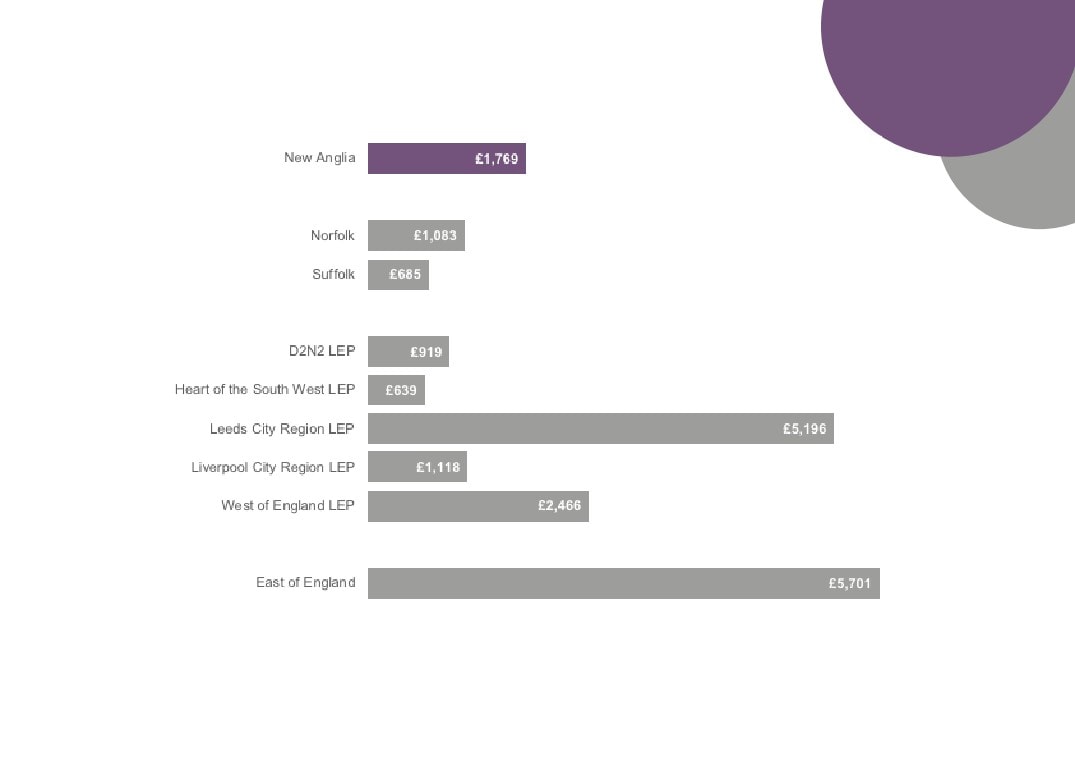
Financial Services & Insurance GVA (£m)
across comparator areas, 2015
Source: Sub-regional Gross Value Added (GVA), Office for National Statistics
Please note that due to the experimental nature of the GVA and employment statistics produced by New Anglia LEP for the New Anglia
area presented on page 5, these have not been able to be replicated for comparator areas, hence why the figure for New Anglia here are
different to those reported previously.
7
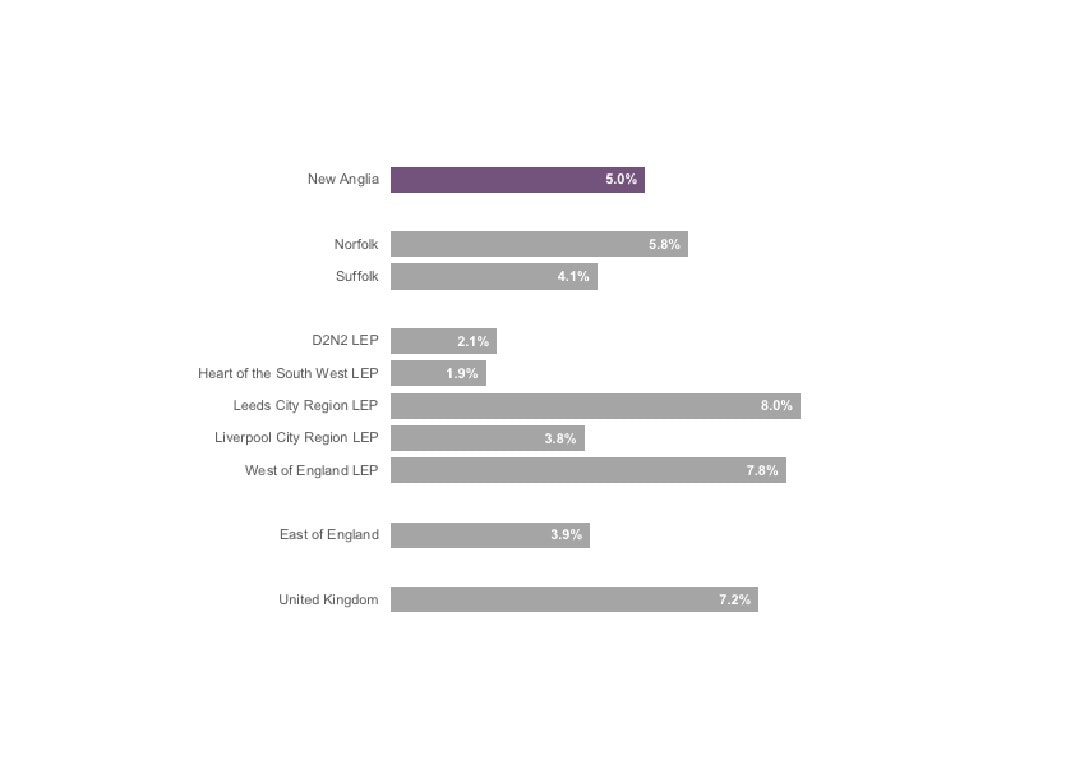
Proportion of total GVA produced by Financial
Services & Insurance across comparator areas, 2015
Source: Sub-regional Gross Value Added (GVA), Office for National Statistics
8
Change in Financial Services & Insurance GVA
across comparator areas (2010 - 2015)
New Anglia
-3%
Norfolk
-5%
Suffolk
0%
D2N2 LEP -31%
Heart of the South West LEP
-17%
Leeds City Region LEP
11%
Liverpool City Region LEP
-18%
West of England LEP
-9%
East of England
-4%
UK
4%
Sources: Sub-regional Gross Value Added (GVA), Office for National Statistics
Please note that due to the experimental nature of the GVA and employment statistics produced by New Anglia LEP for the
New Anglia area presented on page 6, these have not been able to be replicated for comparator areas, hence why the
figures for New Anglia here are different to those reported previously.
9
Employment
Employment provided by the Financial Services &
Insurance sector across comparator areas, 2015
New Anglia
26,000
Norfolk
14,800
Suf folk
10,800
D2N2 LEP
19,400
Heart of the South West LEP
16,800
Leeds City Region LEP
75,700
Liverpool City Region LEP
21,900
West of England LEP
36,800
East of England
107,000
Source: Business Register and Employment Survey, Office for National Statistics
Please note that due to the experimental nature of the GVA and employment statistics produced by New Anglia LEP for the
New Anglia area presented on page 5, these have not been able to be replicated for comparator areas, hence why the
figures for New Anglia here are different to those reported previously.
10
Employment provided by the Financial Services &
Insurance sector across New Anglia, 2015
Ipswich
6,125
Broadland
5,335
Norwich
4,945
King`s Lynn and West Norfolk
1,655
St Edmundsbury
1,570
South Norfolk
895
Breckland
755
Forest Heath
660
Suffolk Coastal
630
Waveney
625
Mid Suffolk
585
Babergh
570
Great Yarmouth
535
North Norfolk
530
Source: Business Register and Employment Survey, Office for National Statistics
11
Proportion of employment provided by the Financial
Services & Insurance sector across comparator areas, 2015
New Anglia
3.8%
Norfolk
4.1%
Suf folk
3.4%
D2N2 LEP
2.1%
Heart of the South West LEP
2.4%
Leeds City Region LEP
5.5%
Liverpool City Region LEP
3.6%
West of England LEP
6.4%
East of England
4.0%
United Kingdom
5.1%
Source: Business Register and Employment Survey, Office for National Statistics
Please note that due to the experimental nature of the GVA and employment statistics produced by New Anglia LEP for the
New Anglia area presented on page 6, these have not been able to be replicated for comparator areas, hence why the
figures for New Anglia here are different to those reported previously.
12
Proportion of employment provided by the Financial
Services & Insurance sector across New Anglia, 2015
Breckland
1.6%
Broadland
11.4%
Great Yarmouth
1.3%
Kings Lynn and West Norfolk
3.2%
North
Norfolk
1.5%
Norwich
5.5%
South Norfolk
1.8%
Babergh
1.9%
Forest Heath
2.9%
Ipswich
8.6%
Mid Suffolk
1.7%
St Edmundsbury
2.6%
Suffolk Coastal
1.2%
Waveney
1.5%
Source: Business Register and Employment Survey, Office for National Statistics
13
Change in Financial Services & Insurance
employment across comparator areas, 2010 - 2015
New Anglia
4%
Norfolk
-5%
Suffolk
5%
D2N2 LEP -17%
Heart of the South West LEP
9%
Leeds City Region LEP
5%
Liverpool City Region LEP
-3%
West of England LEP
-2%
East
24%
England
10%
Source: Business Register and Employment Survey, Office for National Statistics
14
Change in Financial Services & Insurance
employment across New Anglia, 2010 - 2015
Babergh
34%
Breckland
24%
Broadland
-23%
Forest Heath
27%
Great Yarmouth
-3%
Ipswich
2%
King`s Lynn and West Norfolk
35%
Mid Suffolk
60%
North Norfolk
-2%
Norwich
-1%
South Norfolk
23%
St Edmundsbury
13%
Suffolk Coastal
19%
Waveney
-10%
Source: Business Register and Employment
Survey, Office for National Statistics
15
Top Financial Services & Insurance sub sectors by employment, 2015
% of total Financial
Change in
Services &
Industry Sector Code
Industry Sector Name
Employment
employment 2010 -
Insurance sector
2015
employment
66220
Activities of insurance agents and brokers
9,200
32%
-12%
69201
Accounting, and auditing activities
5,200
18%
39%
64191
Banks
3,000
10%
-20%
66190
Other activities auxiliary to financial services, except insurance and pen
2,200
8%
7%
66290
Other activities auxiliary to insurance and pension funding
2,200
7%
4%
69202
Bookkeeping activities
1,700
6%
201%
65120
Non-life insurance
1,600
5%
4%
66210
Risk and damage evaluation
1,000
3%
16%
Source: New Anglia LEP Economic Strategy evidence base work
16
Top Financial Services & Insurance sub sectors with 100 employees or more by
growth in employment
% of total Financial
Change in
Services &
Industry Sector Code
Industry Sector Name
Employment
employment
Insurance sector
2010 - 2015
employment
69203
Tax consultancy
100
0%
218%
69202
Bookkeeping activities
1,700
6%
201%
64999
Other financial service activities, except insurance and pension funding, (not
800
3%
108%
64910
Financial leasing
100
0%
102%
69201
Accounting, and auditing activities
5,200
18%
39%
70221
Financial management
200
1%
39%
66210
Risk and damage evaluation
1,000
3%
16%
66190
Other activities auxiliary to financial services, except insurance and pension
2,200
8%
7%
66120
Security and commodity contracts brokerage
300
1%
6%
66290
Other activities auxiliary to insurance and pension funding
2,200
7%
4%
65120
Non-life insurance
1,600
5%
4%
Source: New Anglia LEP Economic Strategy evidence base work
17
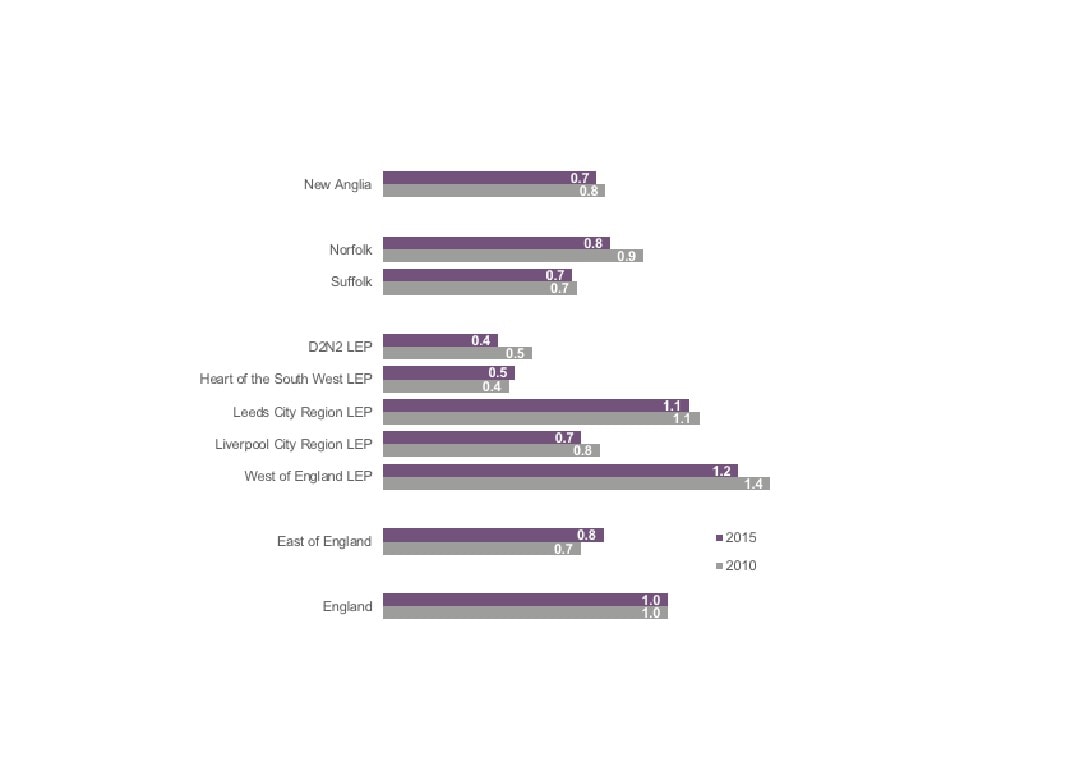
Financial Services & Insurance location quotients
across comparator areas, 2010 and 2015
Location quotients (LQs) are a
useful way of showing a sectors
importance to the local economy
relative to the national picture. The
analysis presented here uses
employment with an LQ above 1
showing a higher concentration than
nationally, and an LQ of below than
1 a lower concentration.
Source: Business Register and Employment Survey, Office
for National Statistics
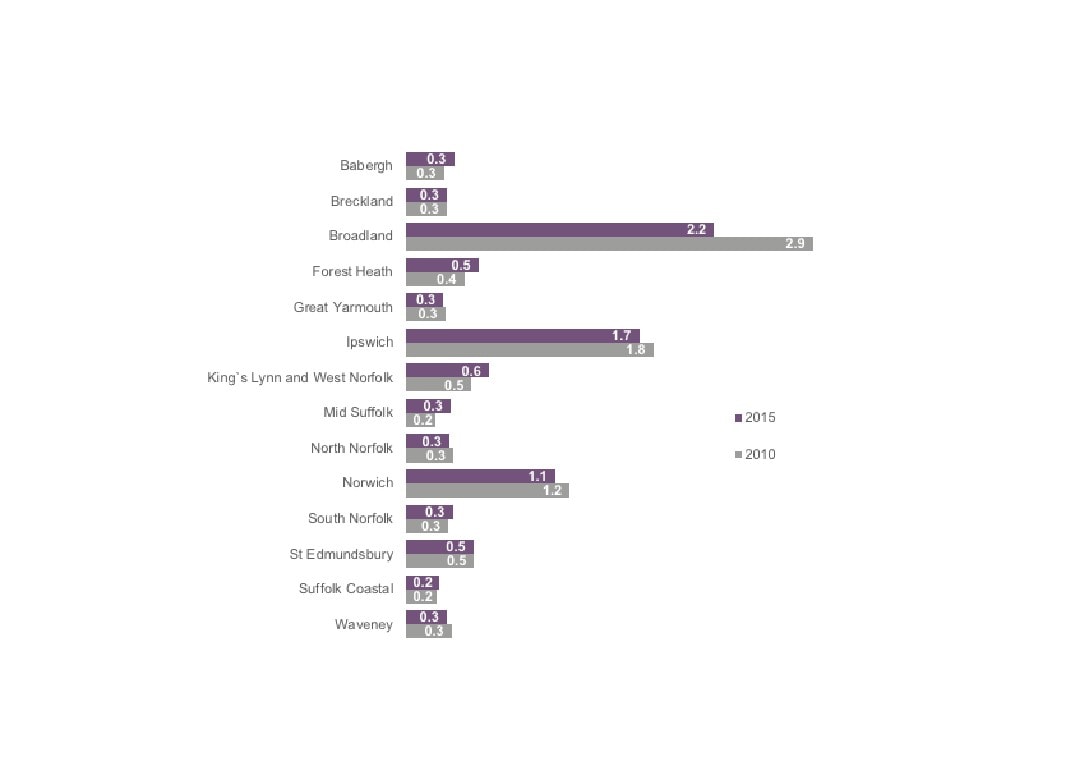
18
Financial Services & Insurance location
quotients across New Anglia, 2010 and 2015
Source: Business Register and Employment Survey, Office for National Statistics
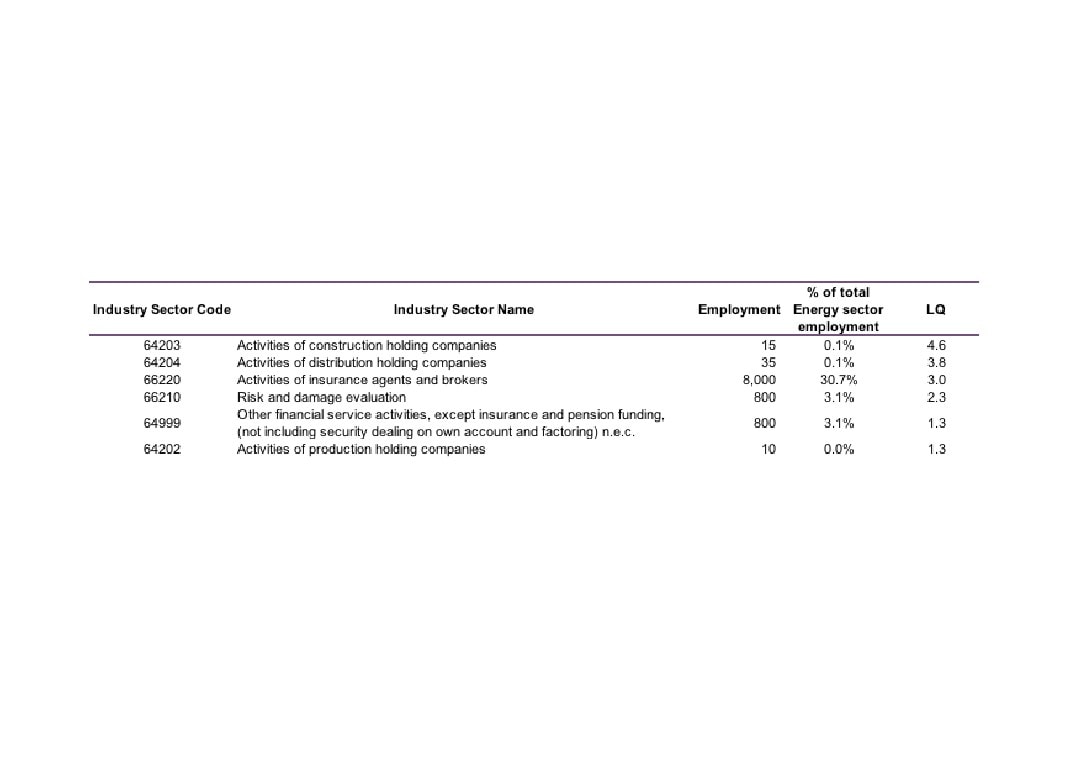
19
Financial Services & Insurance sub sectors with location quotients (LQs) above 1
Source: Business Register and Employment Survey 2015, Office for National Statistics
20
Full time, part time, and self-employment in the Financial
Services & Insurance sector, 2015
New Anglia
57%
29%
14%
Financial Services & Insurance
70%
18%
12%
0%
100%
Full time
Part time
Self Employed
Source: New Anglia LEP Economic Strategy evidence base work
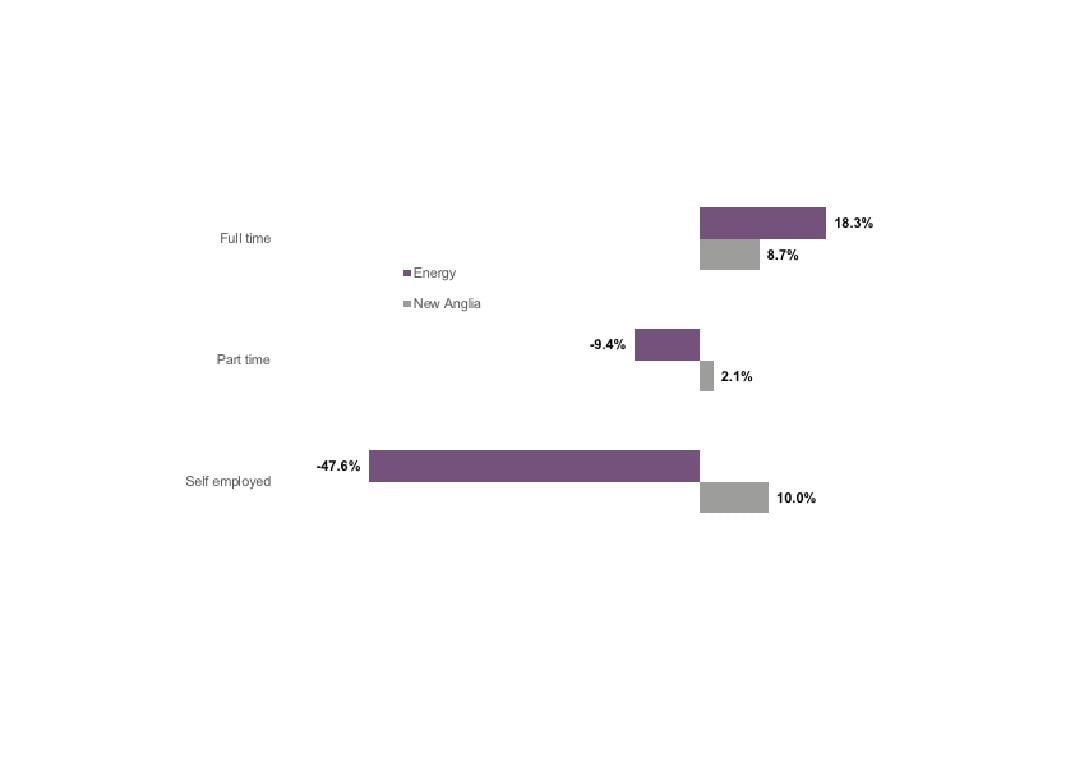
21
Change in full time, part time, and self-employment in the
Financial Services & Insurance sector, 2010 - 2015
Source: Business Register and Employment Survey, Office for National Statistics
22
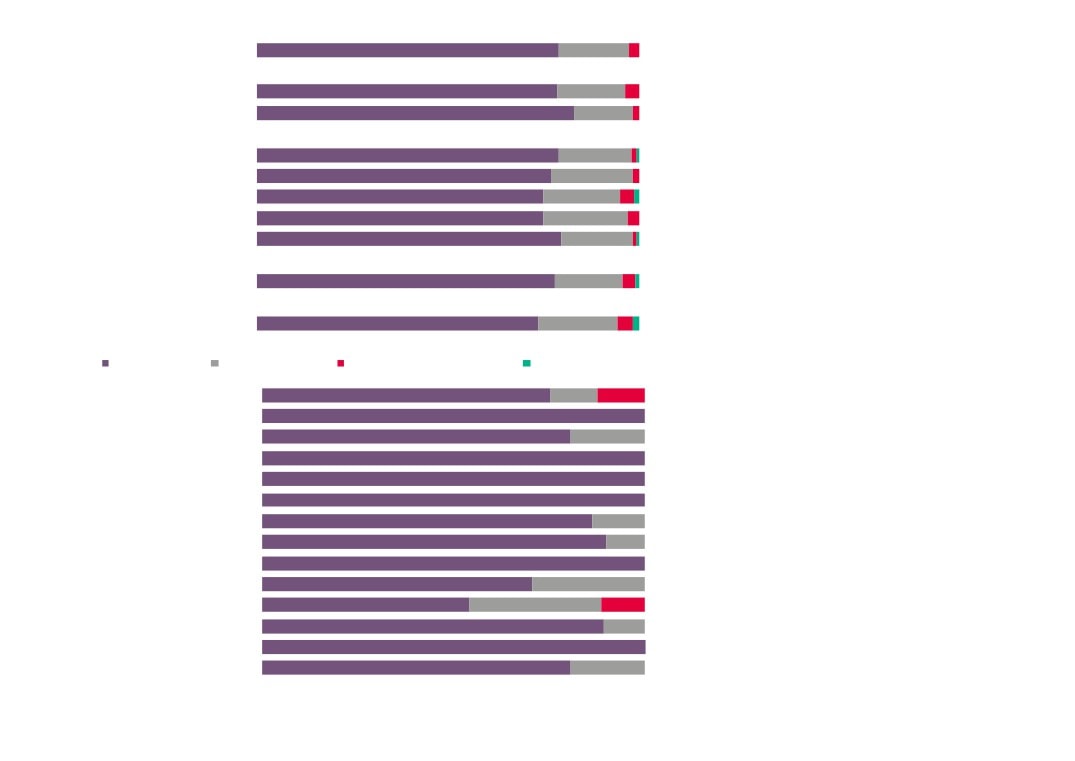
Workplace Financial
Services & Insurance
employment 2011 by broad
Standard Occupational
Classification (SOC) across
comparator areas
Source: 2011 Census, Office for National Statistics
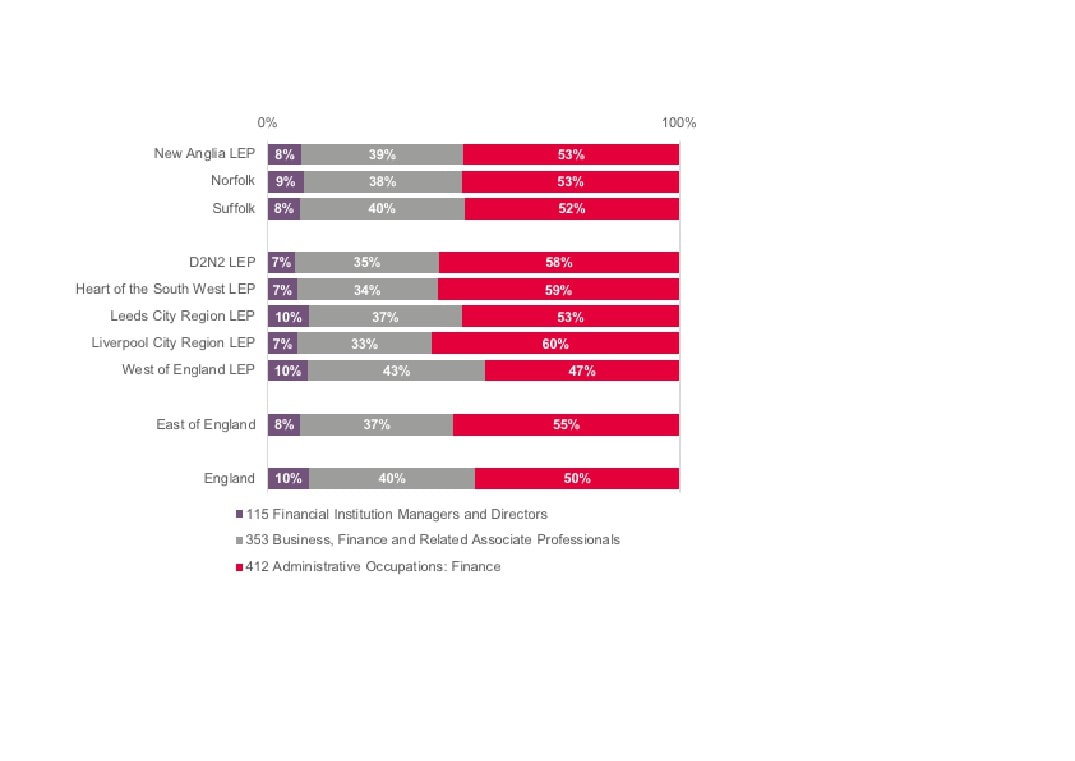
23
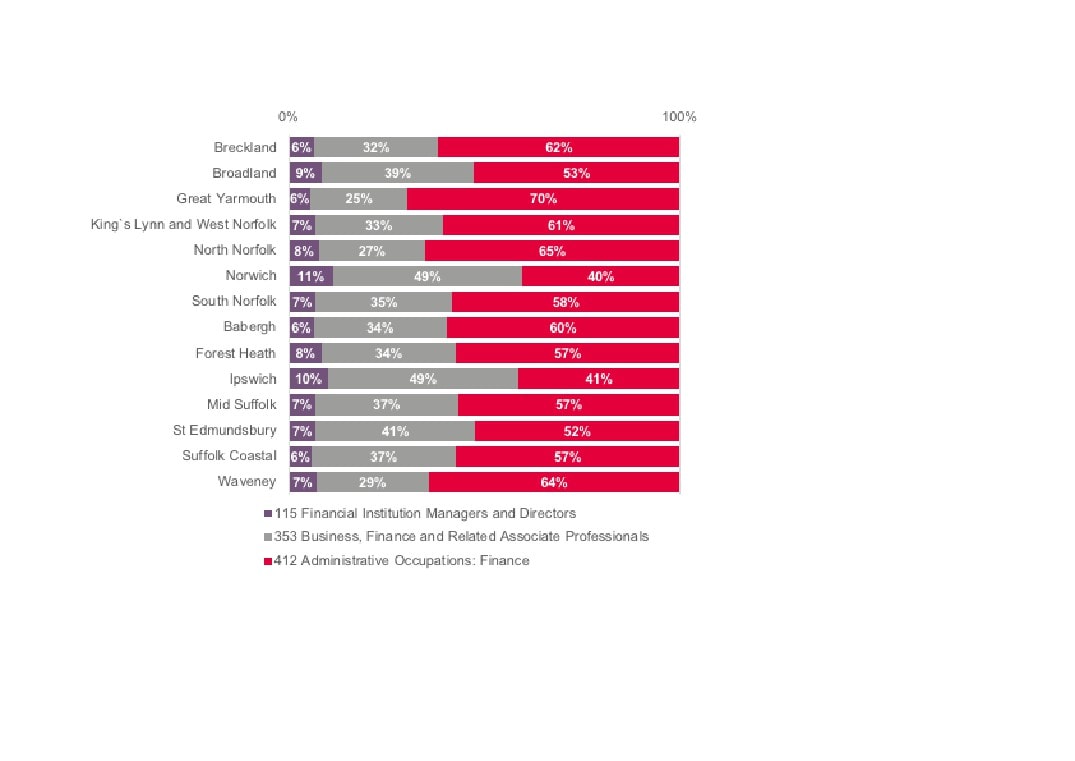
Workplace Financial Services
& Insurance employment
2011 by broad Standard
Occupational Classification
(SOC) across New Anglia
Source: 2011 Census, Office for National Statistics
24
Enterprises
Financial Services & Insurance enterprises as a proportion
of total enterprises across comparator areas, 2016
New Anglia
3.1%
Norfolk
2.9%
Suffolk
3.4%
D2N2 LEP
3.6%
Heart of the South West LEP
3.0%
Leeds City Region LEP
4.0%
Liverpool City Region LEP
4.1%
West of England LEP
4.7%
East
4.1%
England
4.5%
Source: UK Business Counts, Office for National Statistics
25
Financial Services & Insurance enterprises as a proportion of total
enterprises across New Anglia, 2016
Forest Heath
18%
North Norfolk
16%
Great Yarmouth
16%
Norwich
15%
Suffolk Coastal
12%
Ipswich
11%
Waveney
11%
Babergh
10%
King`s Lynn and West Norfolk
10%
St Edmundsbury
9%
Breckland
9%
South Norfolk
9%
Broadland
8%
Mid Suffolk
8%
Source: UK Business Counts, Office for National Statistics
26
New Anglia
94%
5%
Norfolk
94%
5%
Suffolk
95%
5%
Financial Services &
D2N2 LEP
94%
6%
Insurance sector enterprise
Heart of the South West LEP
93%
6%
Leeds City Region LEP
93%
6%
numbers by size across
Liverpool City Region LEP
93%
7%
comparator areas, 2016
West of England LEP
94%
6%
East
93%
5%
Please note that at Local Authority level that
businesses employing more than 250 people are
England
92%
6%
not reported due to their very small numbers and
No. of employees
resulting disclosive nature.
Micro (0 to 9)
Small (10 to 49)
Medium-sized (50 to 249)
Large (250+)
Source: UK Business Counts, Office for
Babergh
93%
4%
National Statistics
Breckland
100%
Broadland
94%
Forest Heath
100%
Great Yarmouth
100%
0%
Ipswich
100%
Financial Services &
King`s Lynn and West Norfolk
96%
Insurance sector enterprise
Mid Suffolk
97%
North Norfolk
100%
0%
numbers by size across
Norwich
91%
9%
New Anglia, 2016
South Norfolk
86%
St Edmundsbury
97%
Suffolk Coastal
Waveney
94%
6%
27
Change in Financial Services &
Insurance enterprises across comparator
New Anglia
15%
Norfolk
16%
Suffolk
18%
D2N2 LEP
26%
Heart of the South West LEP
19%
Leeds City Region LEP
32%
Liverpool City Region LEP
42%
West of England LEP
41%
East
28%
England
32%
Source: UK Business Counts, Office for National Statistics
28
Babergh
-4%
Breckland
17%
Broadland
13%
Forest Heath
50%
Great Yarmouth
-10%
Ipswich
0%
Change in Financial
King`s Lynn and West Norfolk
26%
Services & Insurance
enterprises across New
Mid Suffolk
31%
Anglia, 2010 - 2016
North Norfolk
14%
Sources: UK Business Counts, Office for
Norwich
9%
National Statistics
South Norfolk
17%
St Edmundsbury
6%
Suffolk Coastal
41%
Waveney
20%
29
Financial Services &
Insurance Skills Supply
and Demand
30
Qualifications
Financial Services & Insurance workplace qualifications across
comparator areas, 2011
New Anglia
3%
14%
24%
19%
37%
3%
Derby, Derbyshire, Nottingham and
3%
14%
22%
18%
40%
3%
Nottinghamshire
Greater Manchester
3%
14%
22%
18%
41%
3%
Leeds City Region
3%
13%
21%
18%
42%
3%
Liverpool City Region
5%
17%
24%
18%
34%
2%
South East
5%
19%
25%
17%
31%
3%
West of England
2%
12%
19%
17%
47%
2%
Source: 2011 Census, Office for National Statistics
East
4%
17%
24%
17%
35%
3%
England
3%
12%
18%
15%
49%
4%
No qualifications
Level 1 qualifications
Level 2 qualifications
Level 3 qualifications
Level 4 qualifications and above
Apprenticeships and other qualifications
31
Change in Financial Services & Insurance workplace
qualifications, 2001 - 2011
2011
3%
14%
24%
19%
37%
3%
2001
5%
19%
38%
19%
17%
3%
2011
4%
17%
24%
17%
35%
3%
2001
6%
21%
37%
17%
16%
3%
2011
3%
12%
18%
15%
49%
4%
2001
5%
17%
31%
16%
27%
3%
0%
100%
No qualifications
Level 1 qualifications
Level 2 qualifications
Level 3 qualifications
Level 4 qualifications and above
Apprenticeships and other qualifications
Source: 2001 and 2011 Census, Office for National Statistics
32
UKCES ESS
2015
The following analysis uses the LEP level data released as part of the UK Commission for Employment and Skills (UKCES) Employer Skills
Survey (ESS) 2015. The data covers the areas of vacancies, skills gaps, training, and staff retention and underutilisation.
Data is published for a limited number of broad sectors at LEP level and we have chosen the sector of ‘Financial Services’ as that being closest
to encapsulating Financial Services & Insurance sector activity. In all instances, national, regional, and New Anglia LEP averages are
presented as comparators.
In total, 2,364 employers in New Anglia were surveyed, 73 of which were ‘Financial Services’ employers.
33
Vacancies
17%
20%
Establishments with any vacancies
19%
20%
6%
8%
Have at least one vacancy that is hard to fill
7%
8%
4%
Have a skills shortage vacancy (prompted or
7%
unprompted)
5%
Source: UKCES Employer
6%
Skills Survey 2015
3%
5%
Number of vacancies as a % of all employment
3%
3%
19%
20%
% of all vacancies which are SSVs
22%
23%
New Anglia (Average)
Financial Services (New Anglia)
East of England (Average)
England (Average)
34
Skills Gaps
14%
21%
% of establishments with any staff not fully
proficient
13%
14%
3%
2%
Number of staff not fully proficient as a % of
employment
5%
5%
New Anglia (Average)
Financial Services (New Anglia)
East of England (Average)
England (Average)
Source: UKCES Employer Skills Survey 2015
35
Training
7.5
3.2
Training days per trainee
6.3
6.8
4.7
2.3
Training days per staff
4.0
4.3
New Anglia (Average)
Financial Services (New Anglia)
East of England (Average)
England (Average)
Source: UKCES Employer Skills Survey 2015
36
65%
% of establishments training staff over the last 12
82%
months
64%
66%
48%
% of establishments providing off-the-job training in
60%
the last 12 months
47%
48%
51%
% of establishments providing on-the-job training in
76%
the last 12 months
51%
52%
42%
% of training establishments providing online training
74%
or e-learning in the last 12 months
44%
45%
63%
71%
Number trained as % of total staff
64%
63%
Source: UKCES Employer
Skills Survey 2015
New Anglia (Average) Financial Services (New Anglia) East of England (Average) England (Average)
37
Staff
25%
20%
Establishments with underutilised staff
25%
30%
7%
5%
Whether any jobs in which have difficulties retaining
Source: UKCES Employer
staff
Skills Survey 2015
7%
8%
New Anglia (Average) Financial Services (New Anglia) East of England (Average) England (Average)
38
FE Learning
Aims
All data (unless stated otherwise) is sourced from the Department for Education’s Further Education data library
In order to present information that is relevant to New Anglia LEPs high performing and underpinning sectors then we have
identified FE and skills provision data split by Sector Lead Body and aligned a best-fit with each sector.
The Sector Lead Body identified as being the most relevant to the Financial Services & Insurance sector is ‘Finance, Accountancy & Financial
Services’.
However, not all FE and Skills learning aims align with a sector lead body. In fact, on average around two thirds are classed as unknown. This
means that we are basing results here on roughly a third of the data.
Please note that all data is rounded to the nearest 10 and that therefore some figures presented may not add to the sum totals presented.
39
Financial Services & Insurance sector learning aims delivered to
New Anglia learners by Sector Lead Body, 2010/11 and 2012/13
1,120
770
Finance, Accountancy & Financial Services
2010/11
2012/13
Source: FE Data Library, Department for Education
40
Change in Financial Services & Insurance sector learning aims
delivered to resident learners by Sector Lead Body, 2010/11 - 2012/13
5%
Total inc. Unknown
9%
-38%
Total not inc. Unknown
7%
45%
Finance, Accountancy & Financial Services
33%
New Anglia National
Source: FE Data Library, Department for Education
41
Financial Services & Insurance learning aims delivered to
New Anglia residents by New Anglia based and external
providers by Sector Lead Body, 2012/13
0%
20%
40%
60%
80%
100%
Finance, Accountancy & Financial
1,120
340
Services
Total with unknown removed
55,340
24,770
New Anglia Provider
External Provider
Source: FE Data Library, Department for Education
42
Financial Services & Insurance learning aims delivered to New Anglia
learners by providers by Sector Lead Body, 2010/11 and 2012/13
1,120
770
Finance, Accountancy & Financial Services
2010/11
2012/13
Source: FE Data Library, Department for Education
43
Change in Financial Services & Insurance learning aims
delivered to resident learners by domiciled providers by Sector
Lead Body, 2010/11 - 2012/13
5%
Total inc. Unknown
9%
-38%
Total not inc. Unknown
7%
45%
Finance, Accountancy & Financial Services
33%
New Anglia National
Source: FE Data Library, Department for Education
44
Apprenticeships
Financial Services & Insurance sector
apprenticeship starts by year
350
300
55
70
250
100
70
200
150
265
225
100
195
185
50
0
2011/12
2012/13
2013/14
2014/15
Accounting
Providing Financial Services
Source: Skills Funding Agency Data Cube
45
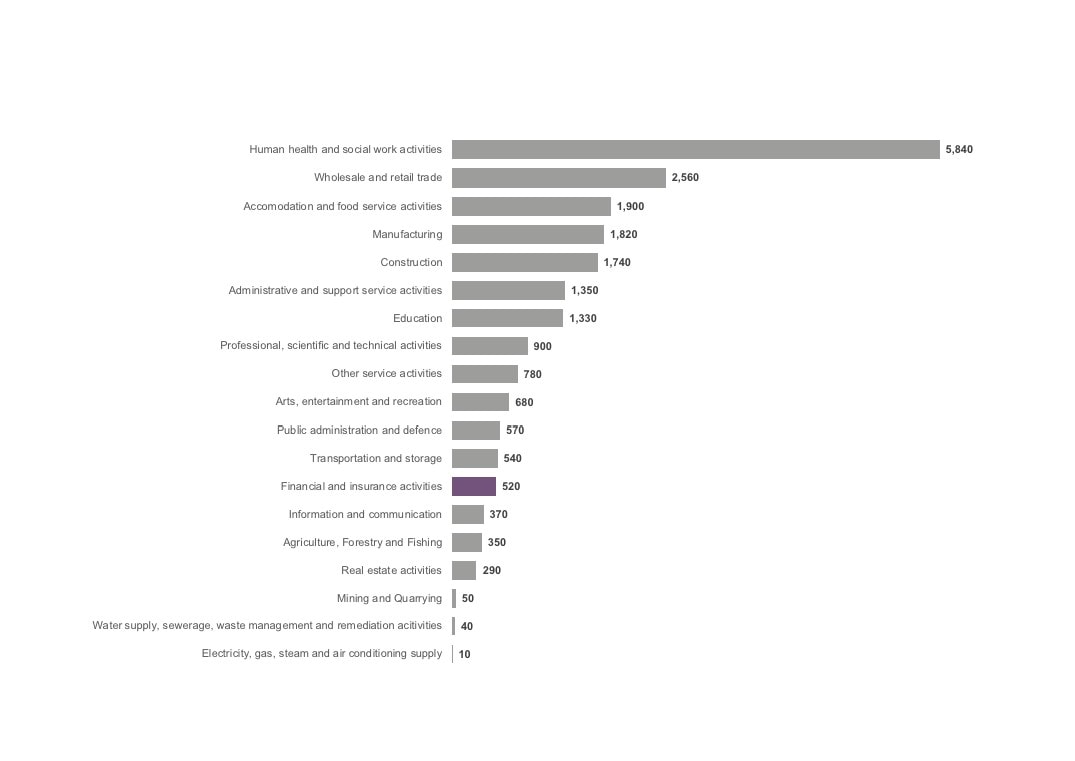
Apprenticeship participation by sector, 2014/15
Source: FE Data Library, Department for Education
46
Apprenticeship participation in the Financial Services &
Insurance sector 2014/15 as a proportion of total participation
2.4%
Financial and insurance activities
3.7%
New Anglia England
Source: FE Data Library, Department for Education
47
Labour Insight
Jobs
The following section presents data from Labour Insight, a Burning Glass analytical tool. This tool collects details of online
job postings from multiple sources and enables the analysis of these postings based on specific skills, educational
requirements, and job titles, for example.
Please note that whilst Labour Insight will capture more information on the jobs market than more traditional Department
for Work and Pensions vacancy data, the fact that not all job vacancies are advertised means that there will still be gaps in
the findings.
According to the Labour Insight Jobs tool, then there were 11,965 postings for the Financial Services & Insurance sector in
New Anglia between Jan. 1, 2012 and Dec. 31, 2016.
The definition for the Financial Services & Insurance sector in this exercise captures the following industry and sectors:
‘Financial and Insurance Activities’, and ‘Accounting, bookkeeping and auditing activities; tax consultancy’.
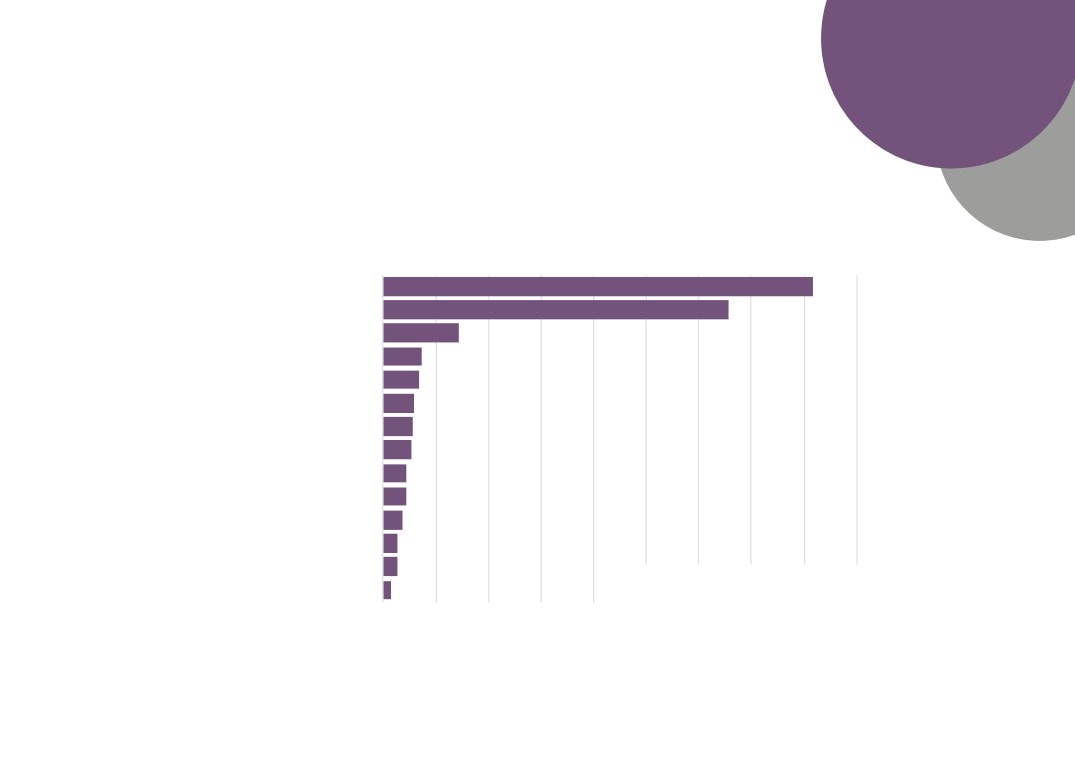
48
Location
Financial Services & Insurance sector vacancies
across New Anglia, Jan 2012 - Dec 2016
0
500
1,000
1,500
2,000
2,500
3,000
3,500
4,000
4,500
Norwich
Ipswich
St Edmundsbury
Forest Heath
King's Lynn and West Norfolk
Breckland
Waveney
South Norfolk
Great Yarmouth
Suffolk Coastal
Babergh
Mid Suffolk
North Norfolk
1,363 unspecified or unclassified postings
Broadland
Source: Labour Insight Jobs, Burning Glass
Technologies
49
Recruiters
Willis Group Limited
Virgin Money
BDO
Direct Line Insurance
Mears Group
HSBC Holdings
Top Financial Services &
Saga Homecare
Countrywide Estate Agents
Insurance sector recruiters across
TSB Bank PLC
New Anglia, Jan 2012 - Dec 2016
Lloyds Banking Group
5,838 unspecified or unclassified postings
Britannia Bank
Travelex
Source: Labour Insight Jobs, Burning Glass
Technologies
Yorkshire Building Society
Legal & General Group
Willis North America Inc
BUPA
Bank of England
Swinton Group
Emcor Group
Barclays
Royal Bank of Scotland
Anglian Water Group
Anglian Group
AXA
Aviva PLC
0
100
200
300
400
500
600
700
800
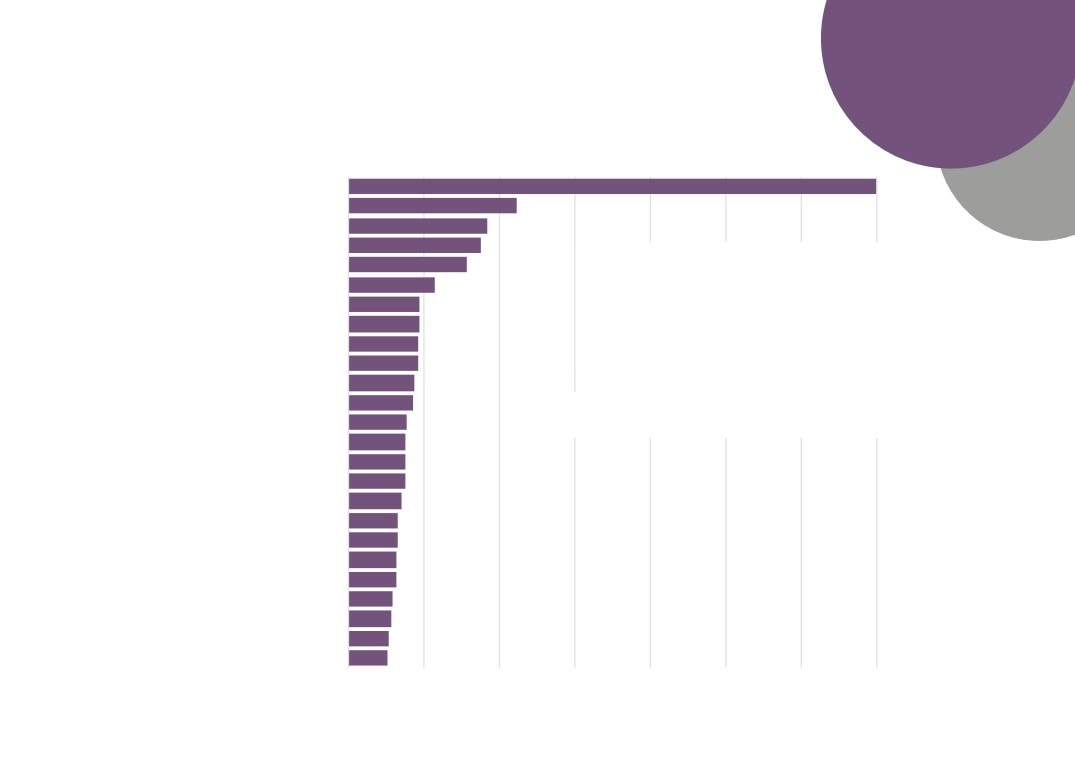
50
Occupation
0
100
200
300
400
500
600
700
800
Business sales executives (3542)
Finance and investment analysts and advisers (3534)
Insurance underwriters (3533)
Customer service occupations n.e.c. (7219)
Marketing associate professionals (3543)
Pensions and insurance clerks and assistants (4132)
Sales related occupations n.e.c. (7129)
Call and contact centre occupations (7211)
Programmers and software development professionals (2136)
Management consultants and business analysts (2423)
Other administrative occupations n.e.c. (4159)
Financial managers and directors (1131)
Managers and proprietors in other services n.e.c. (1259)
Chartered and certified accountants (2421)
Bank and post office clearks (4123)
Estimators, valuers and assessors (3531)
Financial accounts managers (3538)
Web design and development professionals (2137)
Financial Services &
Book-keepers, payroll managers and wages clerks (4122)
Insurance sector vacancies
Care workers and home carers (6145)
by occupation, Jan 2012 -
Sales and retail assistants (7111)
IT business analysts, architects and systems designers (2135)
Dec 2016
Sales supervisors (7130)
84 unspecified or unclassified postings
Sales accounts and business development managers (3545)
Source: Labour Insight Jobs, Burning
Science, engineering and production technicians n.e.c. (3119)
Glass Technologies
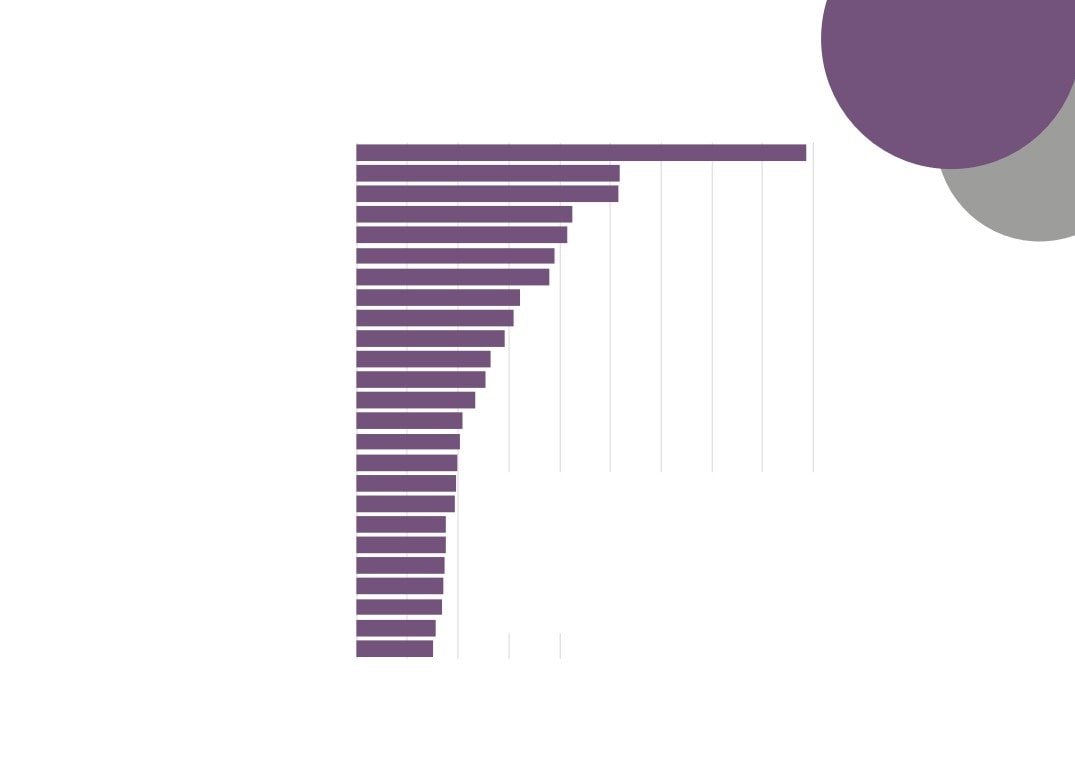
51
Job Title
0
100
200
300
400
500
600
700
Sales Executive
Business Analyst
Commercial Underwriter
Customer Advisor
Commercial Account Handler
Financial Services &
Customer Service Advisor
Insurance sector
Account Manager
Account Executive
vacancies by job title, Jan
Sales Consultant
2012 - Dec 2016
Claims Adjuster
Financial Advisor
0 unspecified or unclassified postings
Accountant
Source: Labour Insight Jobs, Burning Glass
Technologies
Financial Planner
Business Development Executive
Mortgage Advisor
Project Manager
Claims Handler
Mortgage Consultant
Registered Nurse
Accountancy Assistant
Cleaner
Tax Manager
Personal Banker
Administrative Clerk
Branch Manager
52
Qualification
Requirements
59 31
71
374
Financial Services & Insurance
1019
sector vacancies by
qualification level required, Jan
2012 - Dec 2016
9,809 unspecified or unclassified postings
Source: Labour Insight Jobs, Burning Glass Technologies
601
GCSEs, Standard Grades, and Level 2 S/NVQs
Bachelor's degrees, graduate certificates and diplomas
A-Levels, Highers, and Level 3 S/NVQs
Post graduate degrees, Level 5 S/NVQs, certificates and
diplomas
Level 4 diplomas and certificates, HNCs, Level S/NVQs
Foundation degrees and HNDs
53
Skills
Requirements
0
200
400
600
800
1,000
1,200
1,400
1,600
1,800
Customer Service
Business Management
Microsoft Excel
Accountancy
Customer Contact
Sales
Insurance Underwriting
Product Sales
Key Performance Indicators
Project Management
Microsoft Office
Business Development
Claims Adjustments
SQL
Sales Goals
Negotiation Skills
Product Knowledge
Financial Services &
Financial Industry Experience
Contract Management
Insurance sector vacancies
Insurance Industry Background
by skills required, Jan 2012
JavaScript
Microsoft Windows
- Dec 2016
Business Analysis
2,903 unspecified or unclassified postings
Repair
Source: Labour Insight Jobs, Burning
Budgeting
Glass Technologies
54
Where the
Work is
The following analysis makes use of data and findings available via the online toolkit http://wheretheworkis.org/ . The findings presented
are a result of combining data from the UKCES ‘Working Futures’ programme and job vacancy data from the Labour Market Insight tool
developed by Burning Glass.
Limitations
Though the ‘Where the work is’ tool provides a comprehensive and detailed free-to-use dashboard of supply and demand in the UK, the
following limitations should be taken into account when interpreting the data:
- Senior Management and Elementary roles
Occupations not open to recent HR graduates or FE finishers are not considered. Similarly, occupations that do not require any formal
qualifications or training are also excluded from this tool, since the number of job-seekers cannot be meaningfully quantified.
- Matching supply and demand
Some occupations do not have specific qualifications or subject-specific requirements (such as sales, marketing and related associate
professionals). As a result of this, and despite the fact that many people with a broad range of qualifications can apply for these occupations,
they frequently appear ‘undersupplied’ in the tool, i.e. when the “job opportunity” is low. Occupations with very small sample sizes (either of
finishers or job postings) are excluded from the dataset.
- Internal and international migration
Some occupations do not rely solely on FE finishers or HE graduates from their immediate location. Many people travel to find work, often
moving across the country. Other occupations, such as those on the Migration Advisory Committee’s shortage occupation list, may rely more
heavily on jobseekers arriving from outside the UK.
- Online and offline postings
Burning Glass Technologies (BGT) acknowledge that not all jobs are posted online, although a comparison of the Annual Survey of Hours and
Earnings (ASHE) employment data and BGT postings data for UK in 2014 showed a 94 per cent correlation between ASHE and BGT
occupational distributions. The BGT posting data slightly overestimate the proportion of professional and associate professional occupations,
while slightly underestimating the proportion of elementary occupations.
55
Location
Quotient
Location Quotient - Measure of Job Posting Density
relative to employment indexed to the national density
relative to employment
Administrative: Finance
0.71
Low
Business, Finance and
Related Associate
0.55
Very low
Professionals
56
Vacancies by
Opportunity
Number of Job Postings asking for entry-level (2 years of
experience or fewer) and school leaver education levels,
further education levels, and higher education levels
Administrative: Finance
1,390
386
207
Business, Finance and Related
203
226
572
Associate Professionals
School leaver
FE
HE
57
Average
Wages
Advertised Salaries for Job Postings in 2015
£24,400
Administrative: Finance
£28,000
£37,300
£34,700
Business, Finance and
Related Associate
£37,800
Professionals
£49,800
New Anglia
East of England
England
58
Opportunity
Scores
Opportunity Score - Score based on the Demand
Supply Ratio of FE / HE postings within a
geography, from Very Low (0) to Very High (100)
Further Education
Higher Education
41
Administrative: Finance
52
49
99
47
80
Business, Finance and
Related Associate
59
95
Professionals
53
87
New Anglia
East of England
England
59
A Future View of the
Financial Services &
Insurance Sector
60
The following analysis uses data from the East of England Forecasting Model (EEFM) and the UKCES Working Futures data
(WF). In each case the Financial Services & Insurance sector has been approximated from the sector splits available in each
model. In the case of the East of England Forecasting Model then ‘Finance’ has been used to provide forecasts for the Financial
Services & Insurance sector. For the Working Futures data, the sector ‘Finance & Insurance’ has been referred to.
Please note that neither model, or the forecasts they produce, take into account the New Anglia LEPs ambitions for growth in
Gross Value Added (GVA) and employment.
61
Forecasts for change in Financial Services & Insurance sector
employment in New Anglia (2014 = 100)
110
108
106
104
102
100
98
96
94
92
90
2014
2015
2016
2017
2018
2019
2020
2021
2022
2023
2024
Finance (EEFM)
Finance & Insurance (WF)
Sources: East of England Forecasting Model, Cambridge Econometrics;
UKCES Working Futures 2014 - 2024
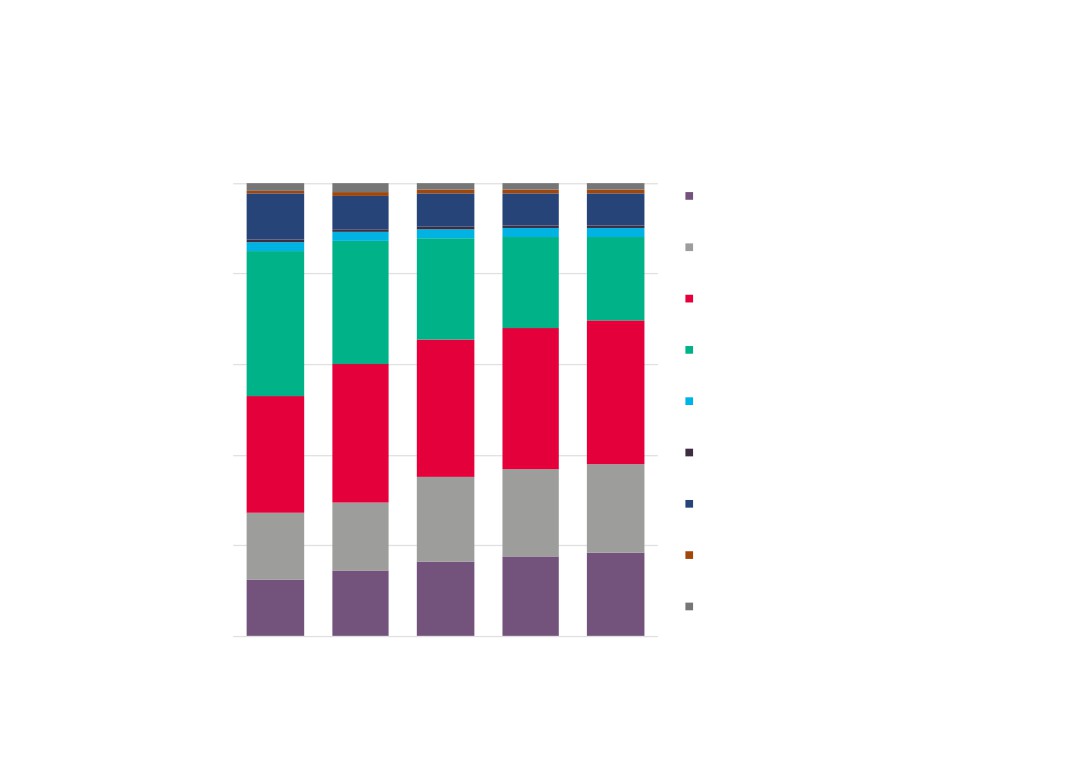
62
Occupational composition of employment in New Anglia’s
Financial Services & Insurance sector over time
100%
2%
2%
1%
1%
1%
Managers, directors and senior
7%
7%
7%
10%
8%
officials
2%
2%
2%
2%
2%
Professional occupations
80%
18%
20%
22%
Associate professional and
27%
technical
32%
Administrative and secretarial
60%
32%
31%
Skilled trades occupations
30%
31%
40%
26%
Caring, leisure and other service
Sales and customer service
20%
19%
19%
15%
20%
15%
Process, plant and machine
operatives
17%
18%
18%
15%
13%
Elementary occupations
0%
Source: UKCES Working Futures 2014 - 2024
2004
2009
2014
2019
2024
63
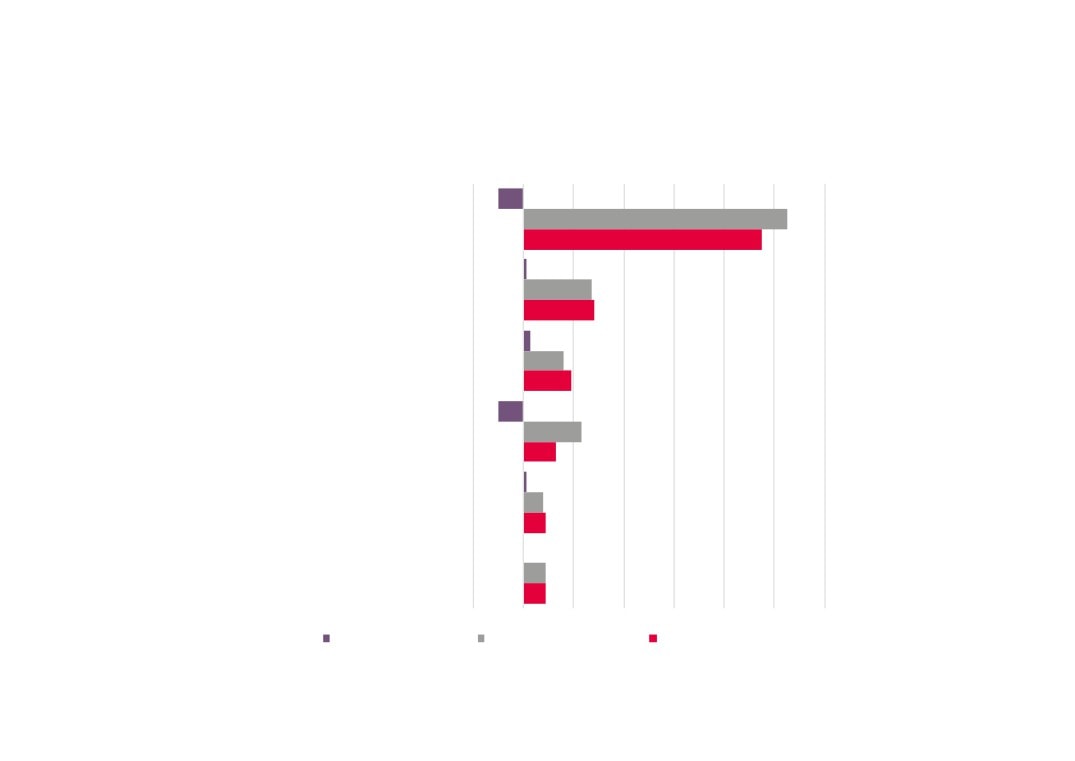
Financial Services & Insurance sector replacement and expansion
demand by occupation (top 5 in terms of net requirement), 2014 - 2024
-2,000
0
2,000
4,000
6,000
8,000
10,000 12,000
All occupations
Business and public service associate
professionals
Corporate managers and directors
Administrative occupations
Business, media and public service
professionals
Science, research, engineering and
technology professionals
Expansion demand
Replacement demand
Net requirement
Source: UKCES Working Futures 2014 - 2024
64
Financial Services & Insurance sector replacement and expansion
demand as a proportion of employment by occupation, 2014 - 2024
-30%
-20%
-10%
0%
10%
20%
30%
40%
50%
All occupations
Business and public service associate professionals
Corporate managers and directors
Administrative occupations
Business, media and public service professionals
Science, research, engineering and technology
professionals
Expansion demand
Replacement demand
Net requirement
Source: UKCES Working Futures 2014 - 2024
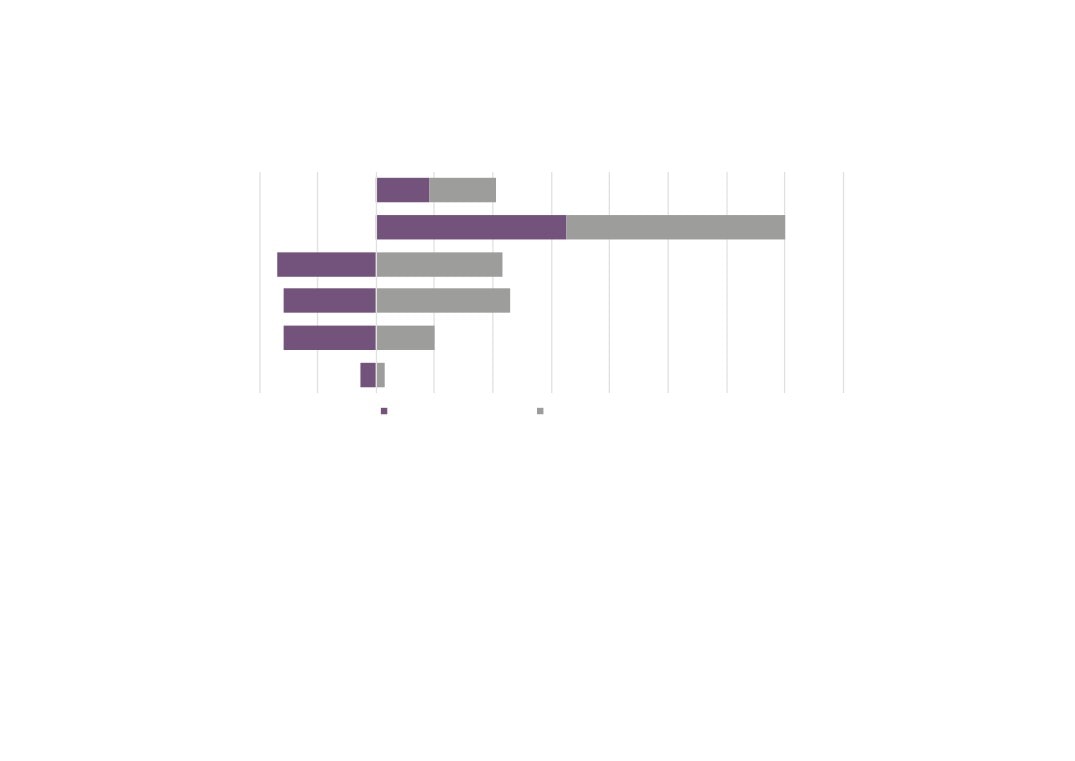
65
Financial Services & Insurance sector replacement and
expansion demand by qualification, 2014 - 2024
-2,000
-1,000
0
1,000
2,000
3,000
4,000
5,000
6,000
7,000
8,000
QCF 7-8
QCF 4-6
QCF 3
QCF 2
QCF 1
No Qual
Expansion Demand
Replacement Demand
Source: UKCES Working Futures 2014 - 2024
Please note that the Working Futures data uses the
following breakout of qualification levels:
QCF8 - Doctorate
QCF7 - Other higher degree
QCF6 - First degree
QCF5 - Foundation degree; Nursing; Teaching
QCF4 - HE below degree level
QCF3 - A level & equivalent
QCF2 - GCSE (A-C) & equivalent
QCF1 - GCSE (below grade C) & equivalent
No Q - No Qualification
66
Financial Services & Insurance sector qualifications, 2014 - 2024
2024
15%
48%
15%
17%
4%
QCF 7-8
QCF 4-6
QCF 3
QCF 2
QCF 1
No Qual
2014
11%
36%
21%
22%
10%
0%
100%
Source: UKCES Working Futures 2014 - 2024
Please note that the Working Futures data uses the
following breakout of qualification levels:
QCF8 - Doctorate
QCF7 - Other higher degree
QCF6 - First degree
QCF5 - Foundation degree; Nursing; Teaching
QCF4 - HE below degree level
QCF3 - A level & equivalent
QCF2 - GCSE (A-C) & equivalent
QCF1 - GCSE (below grade C) & equivalent
No Q - No Qualification
67
Appendix - Financial Services & Insurance Sector Definition
The following five digit SIC codes are being used to measure levels of, and change in, both employment and enterprise numbers in the sector.
64110: Central banking
64191: Banks
64192: Building societies
64201: Activities of agricultural holding companies
64202: Activities of production holding companies
64203: Activities of construction holding companies
64204: Activities of distribution holding companies
64205: Activities of financial services holding companies
64209: Activities of other holding companies (not including agricultural, production, construction, distribution and financial services
holding companies) n.e.c
64301: Activities of investment trusts
64302: Activities of unit trusts
64303: Activities of venture and development capital companies
64304: Activities of open-ended investment companies
64305: Activities of property unit trusts
64306: Activities of real estate investment trusts
64910: Financial leasing
64921: Credit granting by non-deposit taking finance houses and other specialist consumer credit grantors
64922: Activities of mortgage finance companies
64929: Other credit granting (not including credit granting by non-deposit taking finance houses and other specialist consumer credit n.e.c.
grantors and activities of mortgage finance companies)
64991: Security dealing on own account
64992: Factoring
64999: Other financial service activities, except insurance and pension funding, (not including security dealing on own account and
factoring) n.e.c.
65110: Life insurance
69
65120: Non-life insurance
65201: Life reinsurance
65202: Non-life reinsurance
65300: Pension funding
66110: Administration of financial markets
66120: Security and commodity contracts brokerage
66190: Other activities auxiliary to financial services, except insurance and pension funding
66210: Risk and damage evaluation
66220: Activities of insurance agents and brokers
66290: Other activities auxiliary to insurance and pension funding
66300: Fund management activities
68100: Buying and selling of own real estate
69201: Accounting, and auditing activities
69202: Bookkeeping activities
69203: Tax consultancy
70221: Financial management
82911: Activities of collection agencies
82912: Activities of credit bureaus
70