Emerging Technologies
Data Pack
Final Version 31.01.19
Contents
Introduction
Page 3
Transferring the PWC Analysis Results to the Local Level
Page 5
Transferring the McKinsey Analysis Results to the Local Level
Page 16
Comparison of McKinsey and PWC Local Level Outputs
Page 27
Analysis of Norwich’s Regional Role in Retail
Page 32
Analysis of STEM Subject Student and Graduate Destinations
Page 35
2
Introduction to the Sector Data Pack
The role of the Sector Data Pack is to bring together the latest socio-economic and labour market data and present both an up-to-
date, and future view, of the sector and any underlying issues within the area that could impact upon it. Data is presented in a
navigable format without comment (in most cases) with interpretation at this stage mainly left to the reader. In most instances data
has been analysed and presented down to local authority level. In some instances, and even where local authority data is available,
it has not been presented in the data pack due to issues of unreliability and small sample sizes.
Introduction to the Emerging Technologies Analysis
In compiling the data pack for the Emerging Technologies sector skills plans, and in trying to understand and quantify the potential
impacts of IR4.0 at the local level, we have referred heavily to two recent international studies on the matter:
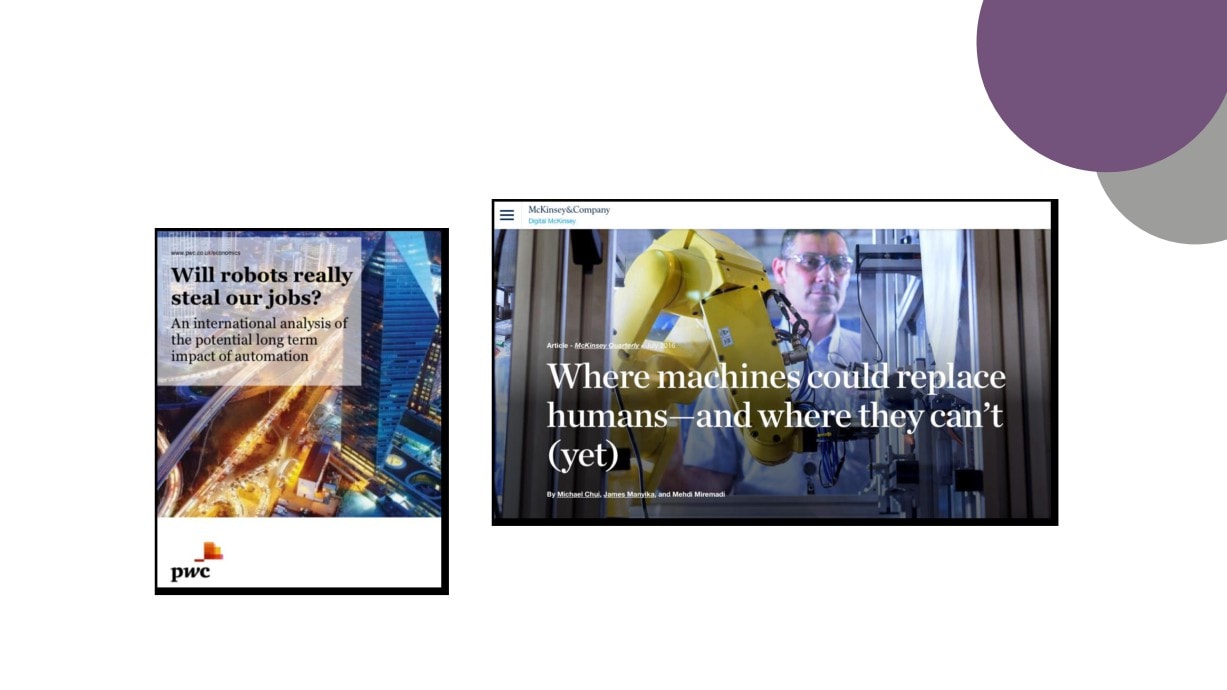
- The PriceWaterhouseCoopers (PWC) article ‘Will robots steal our jobs?’ (UK Economic Outlook, March 2017)
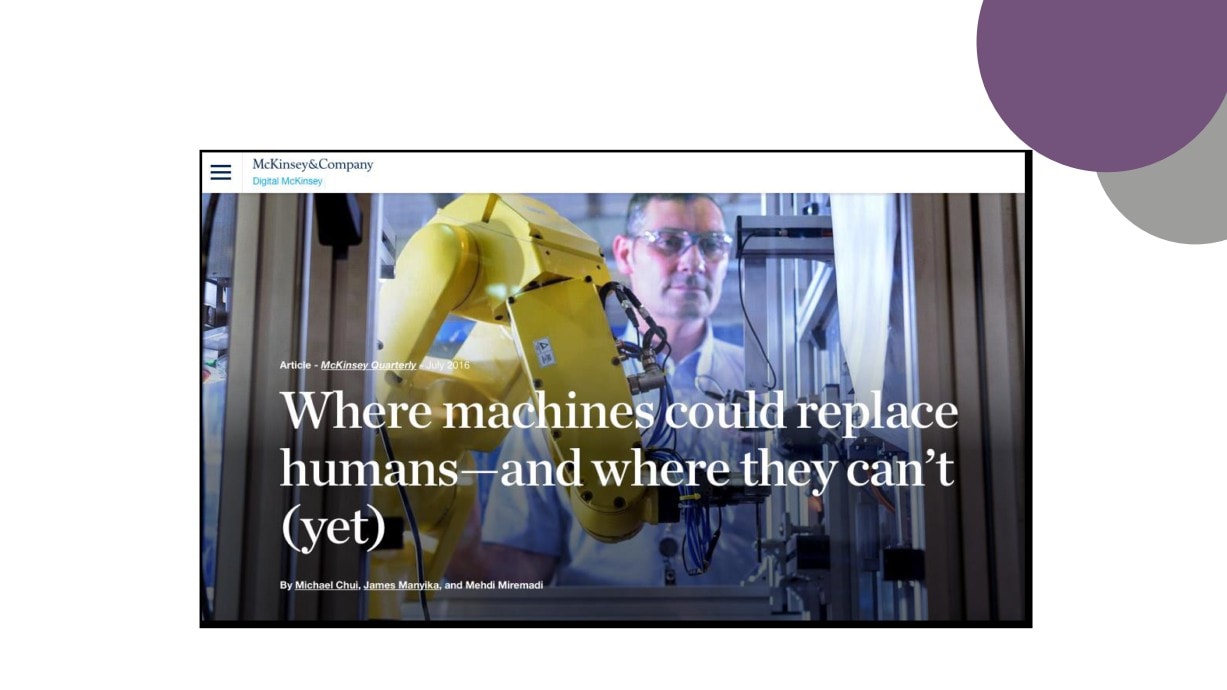
- The McKinsey Global Institute article ‘Where machines could replace humans - and where they can’t (yet)’ (McKinsey Quarterly,
July 2016).
Both pieces of research were based on non-UK labour markets and produced broad level results. In the production of this data pack
we have sought to understand what these findings mean at both a New Anglia LEP and local authority level.
3
Throughout this Data Pack,
the resulting data analysis
has been mapped for New
Anglia at local authority
level.
High Risk
All the maps are presented
in the thematic style shown
in the image on the right,
Low Risk
graduated from grey (low
risk) to purple (high risk).
All the images also present
detailed figures for each
local authority area.
4
PWC Based
Analysis
Transferring the PWC Analysis
Results to the Local Level
5
PwC Analysis - Introductory Notes
The following analysis is based on the findings of the recent PwC article ‘Will robots steal our jobs?’
(UK Economic Outlook, March 2017).
The first element of the analysis looks at where the jobs are across New Anglia that are most at risk of
automation (between now and early 2030s) based on the proportion of employment provided by
sectors deemed at risk.
The second element looks at the same issue but in terms of residents i.e. where do residents live who
are most at risk to significant job change due to lower levels of education.
Finally we present a future scenario of the New Anglia jobs market, using job projection data from the
East of England Forecasting Model (EEFM) and looking at potential IR4.0 impact on job growth
between 2018 and 2033.
6
New Anglia ‘At Risk’ Jobs by Sector
Job Automation
Total Jobs
(% at potential
Total Jobs
'At Risk'
high risk)
A : Agriculture, forestry and fishing
18.7%
22,565
4,220
B : Mining and quarrying
23.1%
900
208
C : Manufacturing
46.4%
66,000
30,624
D : Electricity, gas, steam and air conditioning supply
31.8%
3,000
954
E : Water supply; sewerage, waste management and remediation activities
62.6%
4,500
2,817
F : Construction
23.7%
35,000
8,295
G : Wholesale and retail trade; repair of motor vehicles and motorcycles
44.0%
113,000
49,720
H : Transportation and storage
56.4%
36,000
20,304
I : Accommodation and food service activities
25.5%
52,000
13,260
J : Information and communication
27.3%
17,000
4,641
K : Financial and insurance activities
32.2%
21,000
6,762
L : Real estate activities
28.2%
9,000
2,538
M : Professional, scientific and technical activities
25.6%
38,000
9,728
N : Administrative and support service activities
37.4%
63,000
23,562
O : Public administration and defence; compulsory social security
32.1%
29,000
9,309
P : Education
8.5%
56,000
4,760
Q : Human health and social work activities
17.0%
92,000
15,640
R : Arts, entertainment and recreation
22.3%
22,000
4,906
S : Other service activities
18.6%
12,000
2,232
Totals
691,965
214,480
Proportion of Total Jobs 'At Risk'
31%
Sources: ‘UK Economic Outlook, March 2017’, PwC; Business Register and Employment Survey, Office for National
7
Statistics; Defra Agricultural Survey 2016
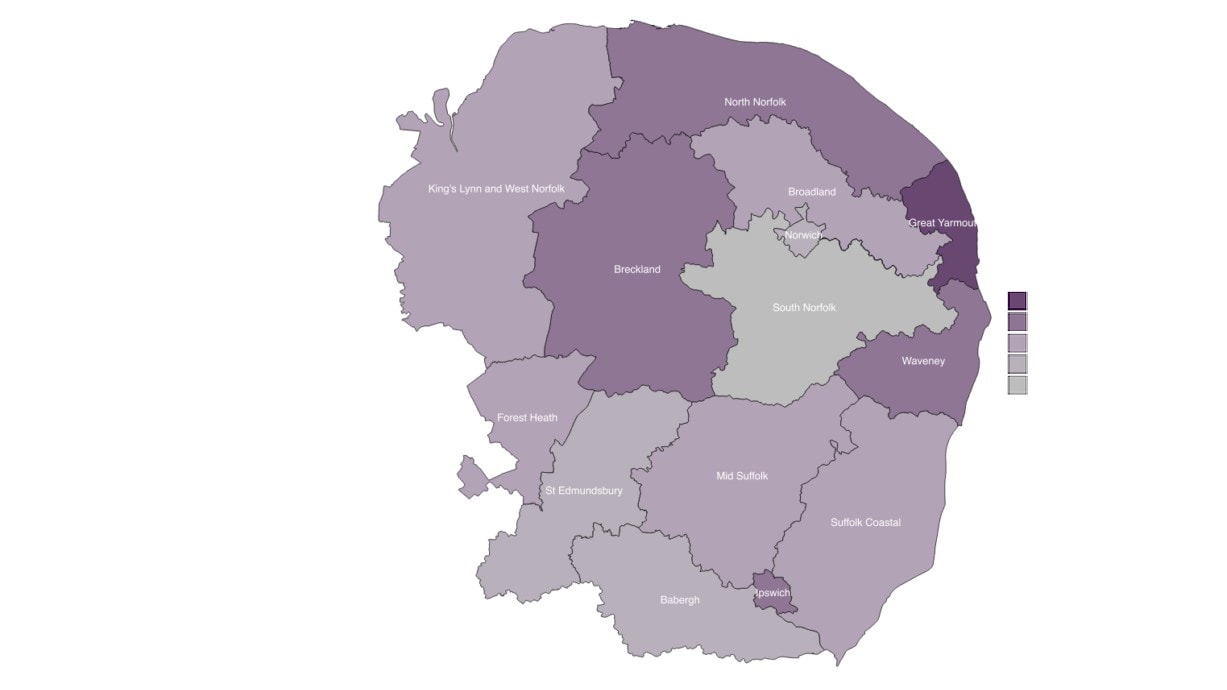
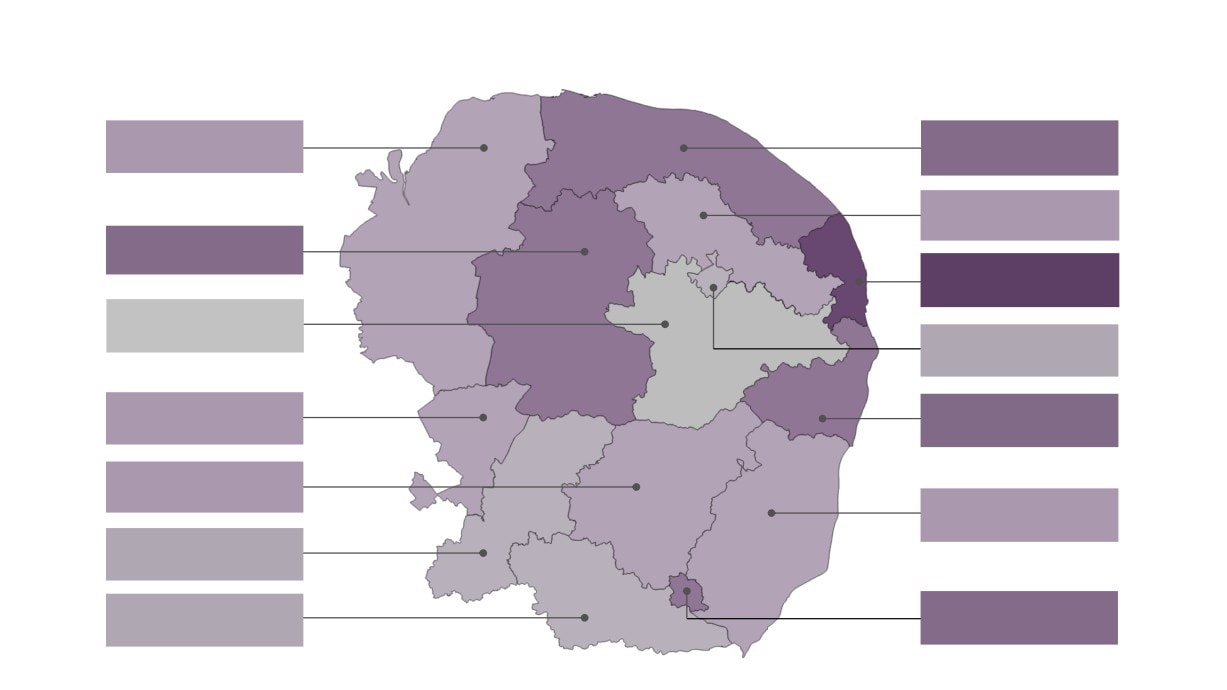
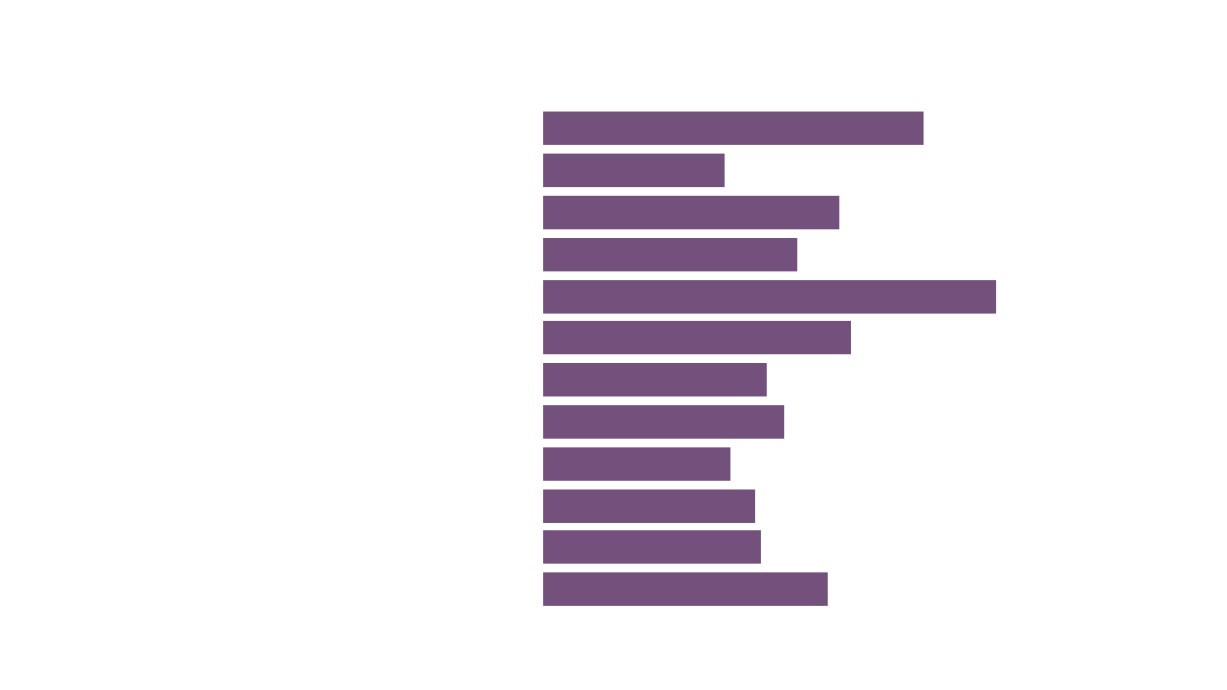
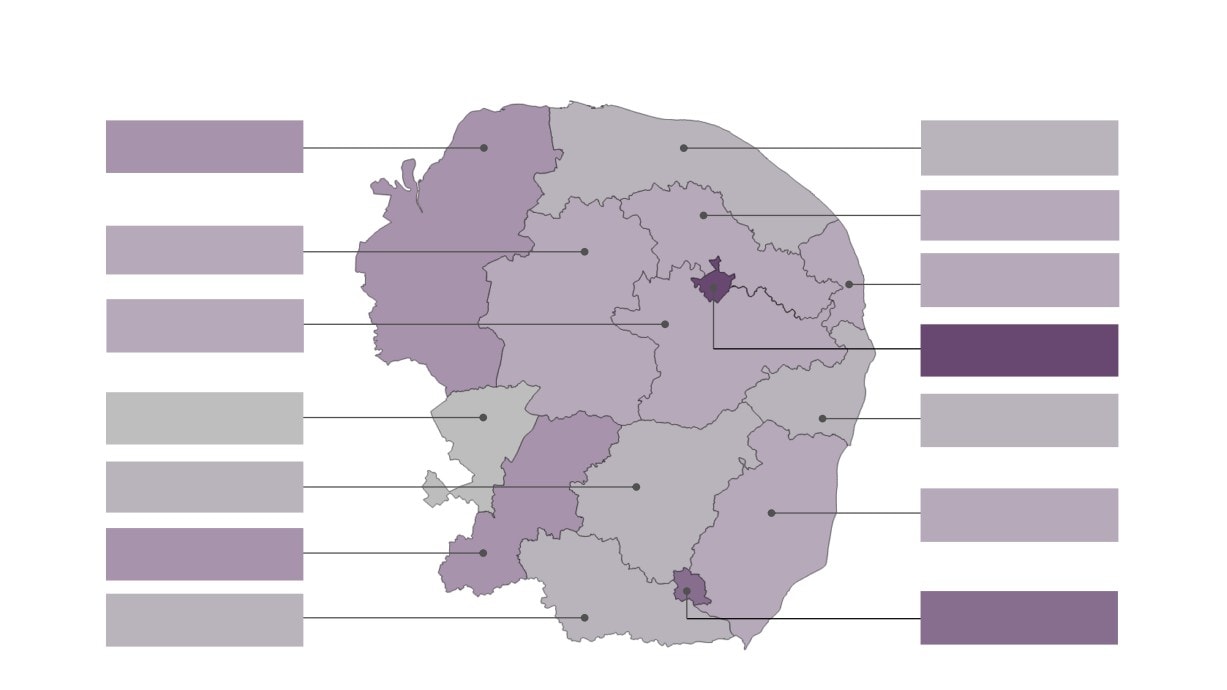
Proportion of Total Jobs ‘At Risk’ by Local Authority
Kings Lynn &
North
30.4%
29.9%
West Norfolk
Norfolk
30.3% Broadland
Breckland
32.8%
Great
29.0%
Yarmouth
South Norfolk
27.9%
30.7%
Norwich
Forest Heath
30.6%
31.9%
Waveney
Mid Suffolk
32.6%
Suffolk
32.5%
Coastal
St.
32.5%
Edmundsbury
Babergh
31.5%
30.6%
Ipswich
8
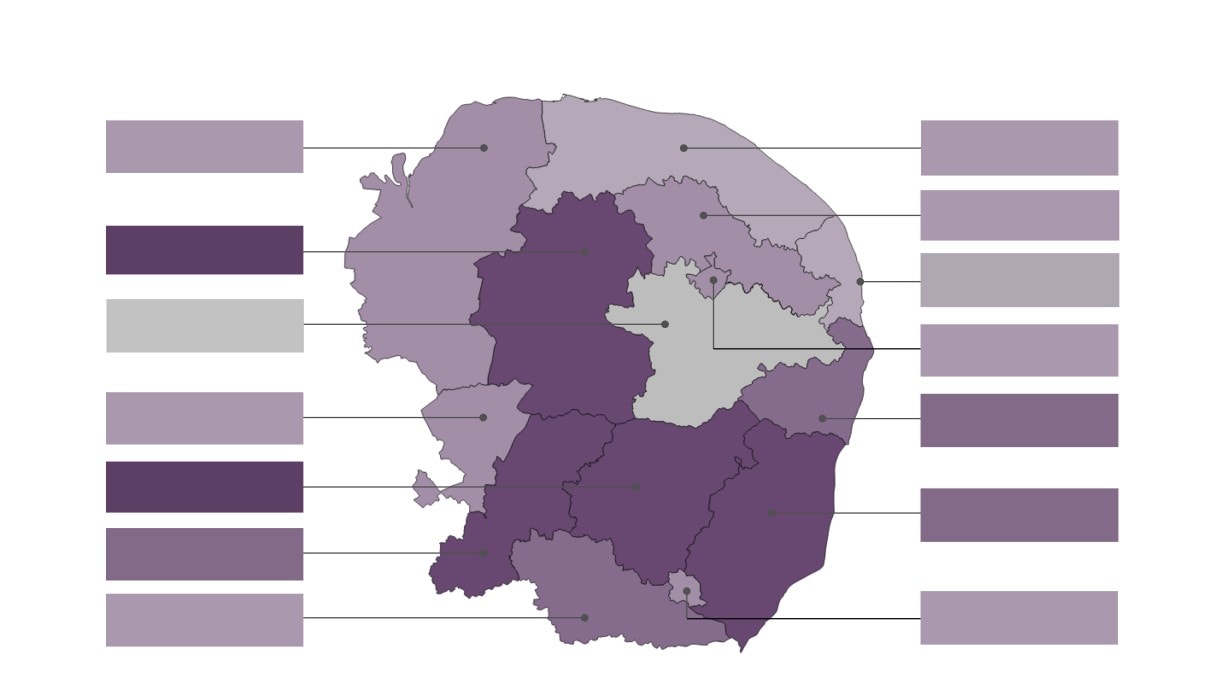
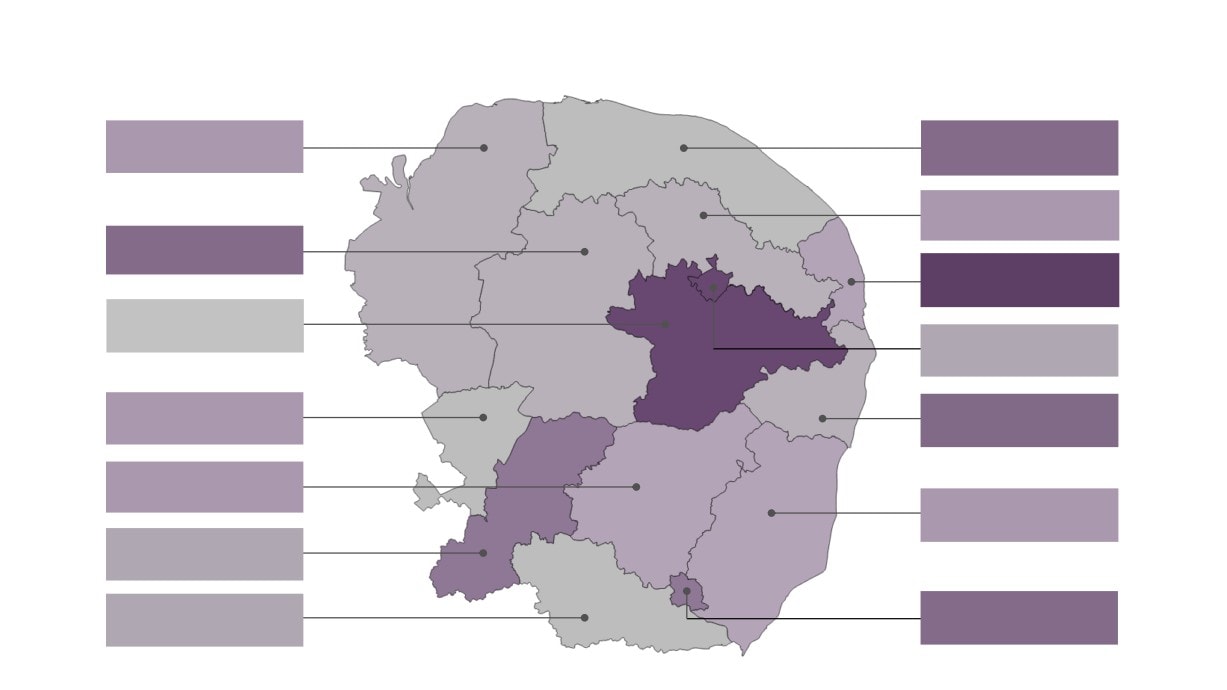
Total LEP ‘At Risk’ Jobs Apportioned by Local Authority
Kings Lynn &
North
8.2%
4.8%
West Norfolk
Norfolk
Broadland
6.8%
Breckland
7.8%
Great
5.3%
Yarmouth
South Norfolk
6.9%
13.0% Norwich
Forest Heath
3.6%
Waveney
6.1%
Mid Suffolk
5.5%
Suffolk
7.6%
Coastal
St.
9.7%
Edmundsbury
Babergh
10.1%
Ipswich
4.6%
9
New Anglia Residents ‘At Risk’ by Qualification Level
% with degree or equivalent and above - aged 16-64
221,300
Higher Education
(12% at Risk)
Number at Risk
26,600
% with higher education below degree level - aged 16-64
73,800
% with GCE A level or equivalent - aged 16-64
247,600
Medium Education
% with GCSE grades A-C or equivalent - aged 16-64
222,100
(36% at Risk)
Total
543,500
Number at Risk
195,700
% with other qualifications (GCSE) - aged 16-64
99,500
% with no qualifications (GCSE) - aged 16-64
77,400
Low Education
(46% at Risk)
Total
176,900
Number at Risk
81,400
Total at Risk
303,600
Population Aged 16-64
Totals
941,700
% at Risk
32%
Sources: ‘UK Economic Outlook, March 2017’, PwC; Annual Population Survey, Office for National Statistics
10
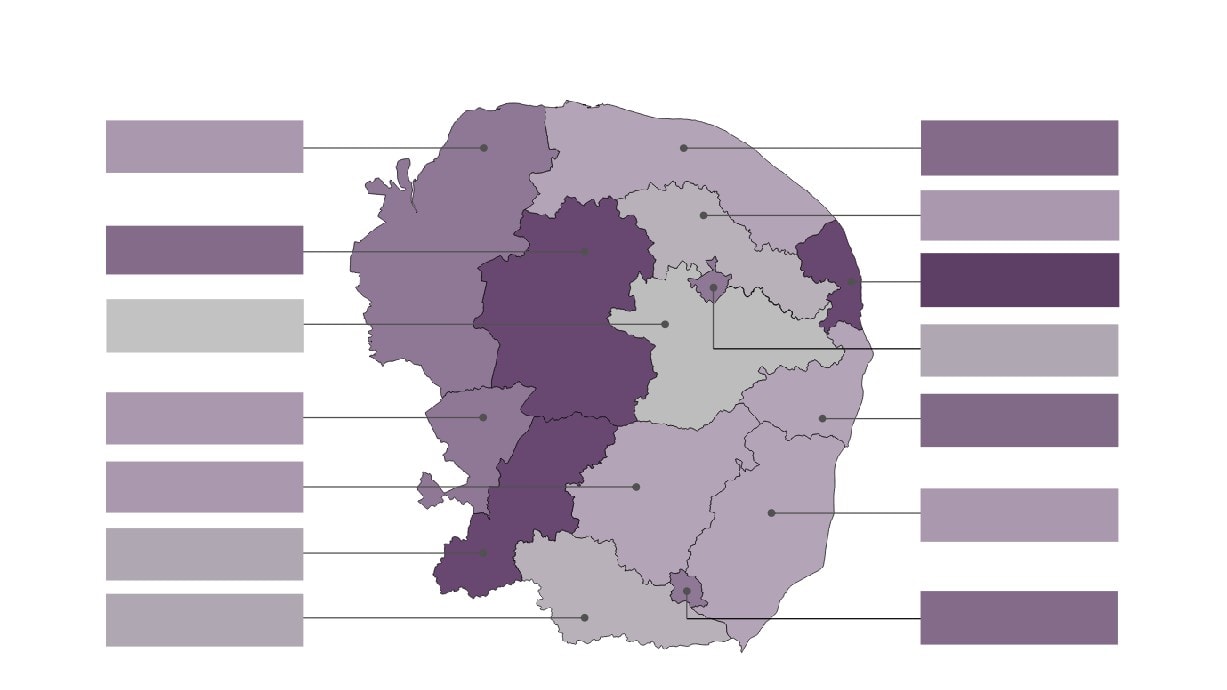
% of New Anglia Residents ‘At Risk’ by Qualification Level
Kings Lynn &
North
32%
34%
West Norfolk
Norfolk
33% Broadland
Breckland
34%
Great
37%
Yarmouth
South Norfolk
28%
Norwich
31%
Forest Heath
32%
Waveney
35%
Mid Suffolk
32%
Suffolk
32%
Coastal
St.
30%
Edmundsbury
Babergh
34%
Ipswich
29%
11
Looking Ahead
As mentioned previously, the PwC analysis considers a time frame from now until the early 2030s for
jobs to become at risk of automation.
Using the latest version of the the East of England Forecasting Model (EEFM), which presents data
down to local authority level, we have looked at jobs growth by sector between 2018 and 2033 (and
ignored those sectors where jobs are forecast to decline) and applied the previous PwC analysis to
highlight how much of new job growth can be considered as being at risk.
The results of this analysis are presented over the final few slides:
12
‘At Risk’ Job Growth by Sector and Area
UK
East of England
New Anglia
% of Jobs
Job Change
Job Change
Job Change
Job Change
Job Change
Job Change
'At Risk'
2018 - 2033
'At Risk'
2018 - 2033
'At Risk'
2018 - 2033
'At Risk'
Agriculture
18.7%
-18,400
-3,900
-1,600
Mining & quarrying
23.1%
-13,300
-600
-400
Manufacturing
46.4%
-422,900
-31,000
-7,500
Utilities
31.8%
7,800
2,500
-200
-100
Waste & remediation
62.6%
20,500
12,800
3,900
2,400
1,100
700
Construction
23.7%
190,300
45,100
34,500
8,200
7,000
1,700
Wholesale & Retail Trade
44.0%
82,700
36,400
27,400
12,000
4,400
1,900
Transport & Storage
56.4%
33,800
19,000
4,600
2,600
1,500
800
Accommodation & food services
25.5%
201,900
51,500
26,800
6,800
5,300
1,300
Information & Communication
27.3%
147,800
40,300
7,800
2,100
800
200
Finance
32.2%
41,100
13,200
-6,300
-1,000
Real estate
28.2%
89,500
25,200
9,800
2,700
2,600
700
Professional, scientific and technical activities
25.6%
419,200
107,300
39,100
10,000
5,300
1,300
Administrative and support service activities
37.4%
171,600
64,200
17,300
6,500
4,400
1,700
Public administration
32.1%
104,600
33,600
12,500
4,000
2,400
800
Education
8.5%
99,800
8,500
11,600
1,000
800
100
Health & care
17.0%
558,100
94,900
70,800
12,000
14,600
2,500
Arts & entertainment
22.3%
87,800
19,600
6,500
1,400
1,500
300
Other services
18.6%
42,300
7,900
4,100
800
800
100
Total job growth
2,298,800
582,000
276,700
72,700
52,500
14,100
Proportion of job growth 'at risk'
25%
26%
27%
Sources: ‘UK Economic Outlook, March 2017’, PwC; East of England Forecasting Model, Cambridge Econometrics
13
Job Growth 2018 - 2033 by New Anglia Local Authority Area
Kings Lynn &
North
2,200
1,500
West Norfolk
Norfolk
2,400
Broadland
Breckland
2,200
Great
2,500
Yarmouth
South Norfolk
8,200
7,700
Norwich
Forest Heath
1,300
2,200
Waveney
Mid Suffolk
2,600
Suffolk
3,600
Coastal
St.
6,900
Edmundsbury
Babergh
1,800
7,100
Ipswich
14
Job Growth 2018 - 2033 At Risk by New Anglia Local Authority Area
Kings Lynn &
North
27.2%
25.5%
West Norfolk
Norfolk
24.6% Broadland
Breckland
29.3%
Great
30.1%
Yarmouth
South Norfolk
22.3%
28.4%
Norwich
Forest Heath
27.6%
25.8%
Waveney
Mid Suffolk
26.4%
Suffolk
26.3%
Coastal
St.
29.4%
Edmundsbury
Babergh
24.6%
27.2%
Ipswich
15
McKinsey
Transferring the McKinsey Analysis
Based
Results to the Local Level
Analysis
16
McKinsey Analysis - Introductory Notes
The following analysis is based on the McKinsey Global Institute article ‘Where machines could replace
humans - and where they can’t (yet)’ (McKinsey Quarterly, July 2016). The analysis looks at where the
jobs are across New Anglia that have the most potential for automation. These estimates for automation
potential are based on the analysis of the detailed work activities for more than 800 occupations across
the US economy. These work activity types were: Predictable physical work; Data Processing; Data
collection; Unpredictable physical work; Stakeholder interactions; Applying expertise; and Managing
others. These activity types were then assessed for each occupation (and grouped by sector) in terms
of the technical potential for automation through the adaption of currently demonstrated technology.
Whilst initial analysis is presented as hours worked (with the potential for automation), through the use
of LEP level productivity hours worked, average hours worked by sector, and average (mean) hours
worked by full-time and part-time employees (all sourced from the Office for National Statistics), we
have been able to convert these hours worked into both jobs and Full-Time Equivalents (FTEs) with the
potential automation at local authority level.
Please note that at this stage this analysis does not include results for the sector of Agriculture, Forestry and Fishing
17
Overall Automation Potential by Sector
Mining, Energy and Water
63%
Manufacturing
30%
Construction
49%
Retail, Wholesale and Transport
42%
Accommodation & food services
75%
Information & communication
51%
Financial & insurance
37%
Professional Services
40%
Business and Public Administration
31%
Education
35%
Health and Care
36%
Arts, entertainment, recreation & other services
47%
Source: ‘Where machines could replace humans - and where they can’t (yet)’, McKinsey Global Institute
18
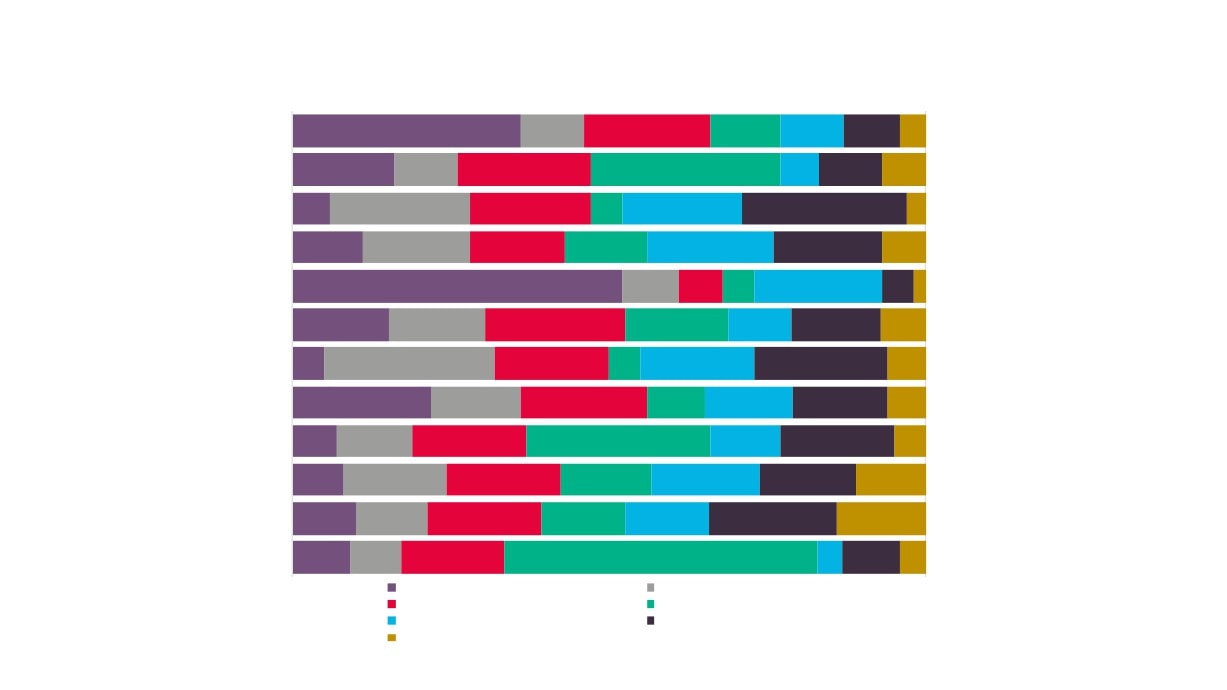
Productivity Hours by Task and Sector
0%
100%
Mining, Energy and Water
36%
10%
20%
11%
10%
9%
4%
Construction
16%
10%
21%
30%
6%
10%
7%
Manufacturing
6%
22%
19%
5%
19%
26%
3%
Retail, wholesale and transport
11%
17%
15%
13%
20%
17%
7%
This analysis is based on
the total productivity hours
Accomodation and Food Services
52%
9%
7%
5%
20%
5%
worked per year across
Information and Communications
15%
15%
22%
16%
10%
14%
7%
New Anglia in 2016 (not
including in the Agriculture
Professional Services
5%
27%
18%
5%
18%
21%
6%
sector) of 1,144,863,469.
Finance and Insurance
22%
14%
20%
9%
14%
15%
6%
Source: Office for National
Business and Public Administration
7%
12%
18%
29%
11%
18%
5%
Statistics
Health and Care
8%
16%
18%
14%
17%
15%
11%
Education
10%
11%
18%
13%
13%
20%
14%
Arts, entertainment and other
9%
8%
16%
49%
4%
9%
4%
Predictable physical work
Data processing
Data collection
Unpredictable physical work
Stakeholder interactions
Applying expertise
Managing others
Source: ‘Where machines could replace humans - and where they can’t (yet)’, McKinsey Global Institute
19
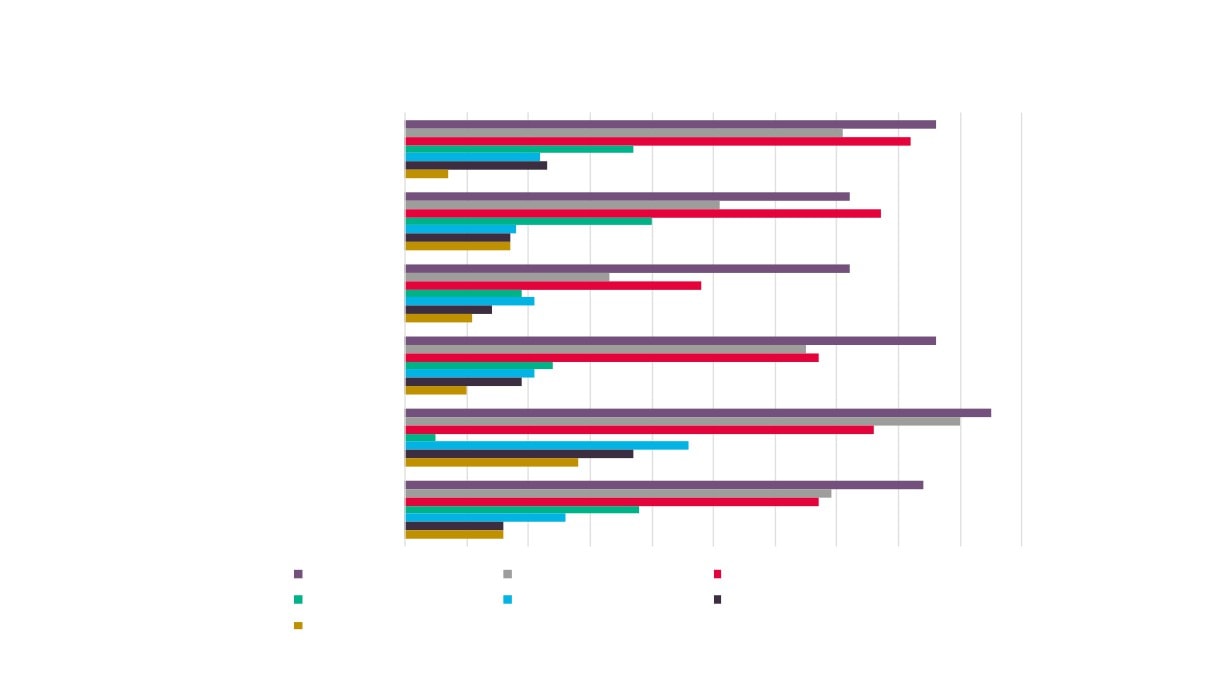
Automation Potential by Task and Sector
0%
10%
20%
30%
40%
50%
60%
70%
80%
90%
100%
Mining, Energy and Water
Construction
Manufacturing
Retail, wholesale and transport
Accomodation and Food Services
Information and Communications
Predictable physical work
Data processing
Data collection
Unpredictable physical work Stakeholder interactions
Applying expertise
Managing others
Source: ‘Where machines could replace humans - and where they can’t (yet)’, McKinsey Global Institute
20
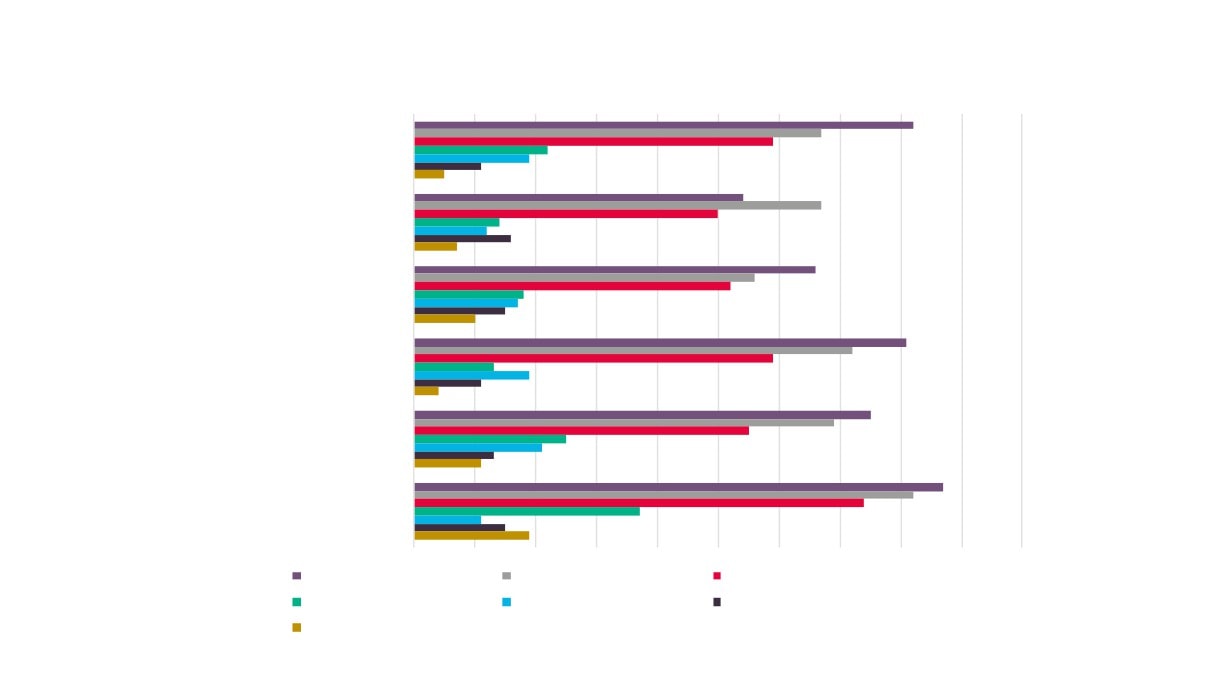
Automation Potential by Task and Sector (cont.)
0%
10%
20%
30%
40%
50%
60%
70%
80%
90%
100%
Professional Services
Finance and Insurance
Business and Public Administration
Health and Care
Education
Arts, entertainment and other
Predictable physical work
Data processing
Data collection
Unpredictable physical work Stakeholder interactions
Applying expertise
Managing others
Source: ‘Where machines could replace humans - and where they can’t (yet)’, McKinsey Global Institute
21
New Anglia Jobs and FTEs with Automation Potential by Sector
Through the use of data on average hours worked by sector, and the full-time/part-time ratios of employment by sector (at local authority level)
we can get an idea of the ‘human’ impact of automation (rather than just thinking about it in terms of time). For example, the McKinsey analysis
suggests an overall automation potential for ‘Accommodation and food services’ of 75%. However, given that the ratio of full-time/part-time
employees in the sector is high (in New Anglia it is 42/58) with workers on average working 27.2 hours per week, this means that the impact on
jobs (and FTEs) will be higher (88%) than in a sector where there are more full-time workers and where they work longer hours. In line with the
previous PwC analysis, the presentation of results at local authority level is restricted to those for jobs.
Productivity
Total Jobs
% of Jobs
% of FTEs
Total
FTEs With
Hours With
With
With
With
Sector
Productivity
Total Jobs
Total FTEs Automation
Automation
Automation
Automation
Automation
Hours
Potential
Potential
Potential
Potential
Potential
Mining, Energy and Water
14,911,391
9,394,176
9,000
4,800
53%
8,100
4,500
56%
Manufacturing
111,007,022
33,302,107
67,000
15,800
24%
62,000
14,200
23%
Construction
62,959,207
30,850,011
38,000
17,500
46%
31,400
16,600
53%
Retail, Wholesale and Transport
258,464,112
108,554,927
156,000
63,200
41%
117,900
50,300
43%
Accommodation & food services
89,468,346
67,101,260
54,000
47,500
88%
34,900
32,100
92%
Information & communication
28,165,961
14,364,640
17,000
7,500
44%
14,200
6,500
46%
Financial & insurance
36,450,067
13,486,525
22,000
7,600
35%
19,100
6,800
36%
Professional Services
81,184,240
32,473,696
49,000
18,300
37%
39,800
15,800
40%
Business and Public Administration
154,084,374
47,766,156
93,000
28,400
31%
73,500
23,000
31%
Education
92,781,989
32,473,696
56,000
21,900
39%
41,500
16,100
39%
Health and Care
154,084,374
55,470,375
93,000
36,000
39%
65,400
26,200
40%
Arts, entertainment, recreation & other services
61,302,385
28,812,121
37,000
18,800
51%
23,800
13,100
55%
Total
1,144,863,469
474,049,690
691,000
287,300
42%
531,600
225,200
42%
Sources: ‘Where machines could replace humans - and where they can’t (yet)’, McKinsey Global Institute; Business
22
Register and Employment Survey, 2016, Office for National Statistics
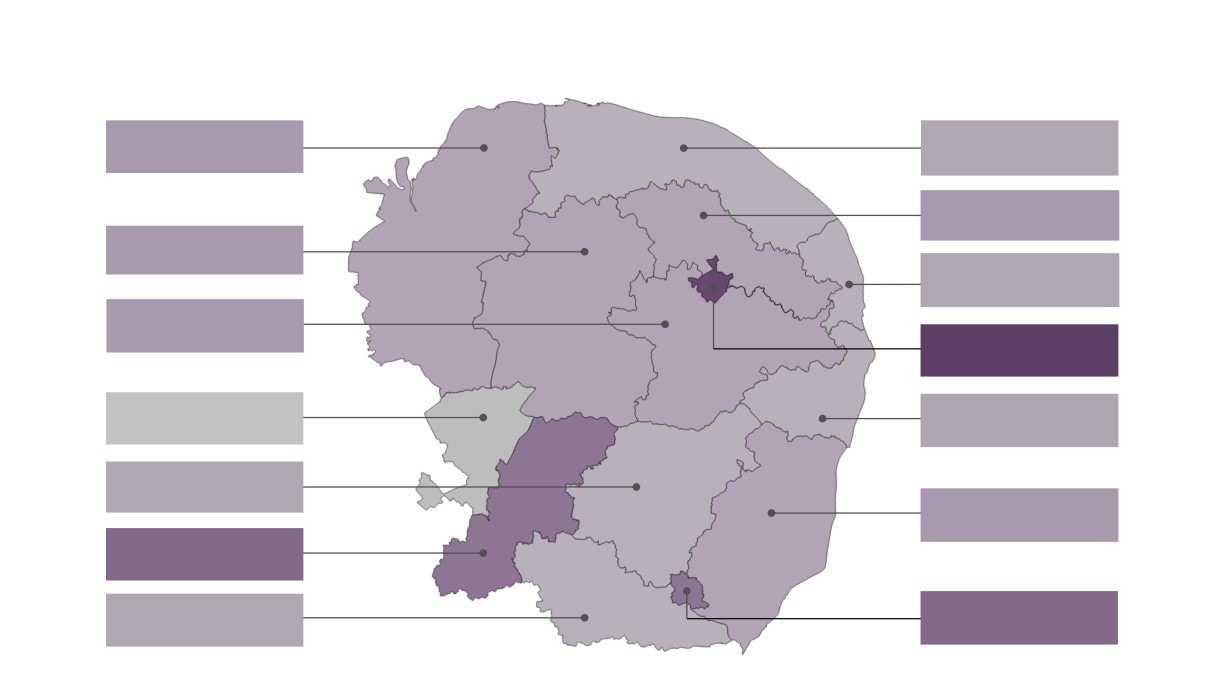
Total LEP Jobs With Automation Potential Apportioned by Local Authority
Kings Lynn &
North
8.0%
5.3%
West Norfolk
Norfolk
Broadland
6.9%
Breckland
6.7%
Great
6.3%
Yarmouth
South Norfolk
7.5%
13.2% Norwich
Forest Heath
4.0%
Waveney
6.0%
Mid Suffolk
5.0%
Suffolk
7.6%
Coastal
St.
8.5%
Edmundsbury
Babergh
10.4%
Ipswich
4.6%
23
Total LEP Automation Potential Apportioned by Local Authority
As a % of New Anglia Total
Hours
Jobs
FTEs
Babergh
4.6%
4.6%
4.5%
Breckland
6.8%
6.7%
6.8%
Broadland
7.0%
6.9%
7.1%
The table shows that there is very
Forest Heath
3.9%
4.0%
3.9%
little difference between the
Great Yarmouth
6.1%
6.3%
6.1%
analysis of automation potential
Ipswich
10.5%
10.4%
10.4%
King's Lynn and West Norfolk
8.0%
8.0%
8.0%
across hours worked, jobs, and
Mid Suffolk
5.1%
5.0%
5.2%
FTEs, when the New Anglia level
North Norfolk
5.2%
5.3%
5.2%
numbers are apportioned across
Norwich
13.1%
13.2%
13.0%
the 14 local authorities that make
South Norfolk
7.4%
7.5%
7.5%
up the New Anglia area.
St Edmundsbury
8.6%
8.5%
8.6%
Suffolk Coastal
7.6%
7.6%
7.7%
Waveney
5.9%
6.0%
5.9%
Sources: ‘Where machines could replace humans - and where they can’t
(yet)’, McKinsey Global Institute; Business Register and Employment Survey,
2016, Office for National Statistics
24
Total Automation Potential by New Anglia Local Authority
As a % of Local Authority Total
Hours
Jobs
FTEs
Babergh
41.2%
39.7%
40.0%
Breckland
40.0%
37.1%
37.8%
Broadland
40.6%
40.2%
41.4%
Forest Heath
44.1%
42.0%
42.4%
However, if we consider the results
Great Yarmouth
44.3%
45.2%
46.6%
of the analysis at local authority
Ipswich
40.6%
41.5%
42.4%
level then we can see some marked
King's Lynn and West Norfolk
41.4%
39.1%
39.7%
Mid Suffolk
40.6%
37.9%
40.8%
differences. This will be as a result
North Norfolk
43.5%
42.5%
44.5%
of local authority level differences in
Norwich
40.6%
40.6%
41.9%
both sector and full-time/part-time
South Norfolk
40.4%
38.9%
41.6%
employee ratios.
St Edmundsbury
38.8%
37.7%
37.9%
Suffolk Coastal
43.9%
41.1%
43.1%
Waveney
41.3%
40.8%
42.0%
Sources: ‘Where machines could replace humans - and where they can’t
(yet)’, McKinsey Global Institute; Business Register and Employment Survey,
2016, Office for National Statistics
25
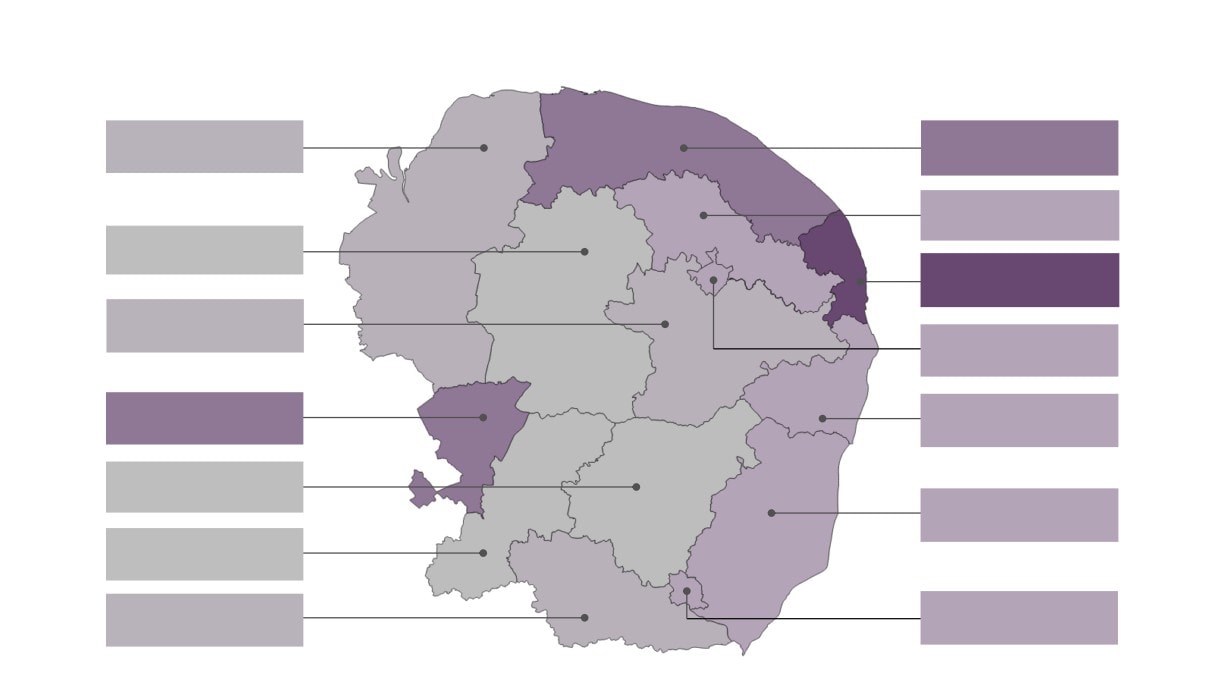
Proportion of Jobs with Automation Potential by Local Authority
Kings Lynn &
North
39.1%
42.5%
West Norfolk
Norfolk
40.2% Broadland
Breckland
37.1%
Great
45.2%
Yarmouth
South Norfolk
38.9%
Norwich
40.6%
Forest Heath
Waveney
42.0%
40.8%
Mid Suffolk
37.9%
Suffolk
41.1%
Coastal
St.
37.7%
Edmundsbury
41.5%
Ipswich
Babergh
39.7%
26
McKinsey / PWC
Comparator
Work
Comparison of PWC and McKinsey
Local Level Outputs
27
Comparison of PwC and McKinsey Research Outputs at Sector Level
McKinsey
PwC 'At
Automation
PwC Sector
McKinsey Sector
Risk' by
Potential by
Sector
Sector
Agriculture, forestry and fishing
18.7%
No Data
Mining and quarrying
23.1%
Electricity, gas, steam and air conditioning supply
Mining, Energy and Water
31.8%
63%
Water supply; sewerage, waste management and remediation activities
62.6%
Manufacturing
Manufacturing
46.4%
30%
Construction
Construction
23.7%
49%
Wholesale and retail trade; repair of motor vehicles and motorcycles
44.0%
Retail, Wholesale and Transport
42%
Transportation and storage
56.4%
Accommodation and food service activities
Accommodation & food services
25.5%
75%
Information and communication
Information & communication
27.3%
51%
Financial and insurance activities
Financial & insurance
32.2%
37%
Real estate activities
28.2%
Professional Services
40%
Professional, scientific and technical activities
25.6%
Administrative and support service activities
37.4%
Business
and Public Administration
31%
Public administration and defence; compulsory social security
32.1%
Education
Education
8.5%
35%
Human health and social work activities
Health and Care
17.0%
36%
Arts, entertainment and recreation
22.3%
Arts, entertainment, recreation & other services
47%
Other service activities
18.6%
Sources: ‘UK Economic Outlook, March 2017’, PwC; and ‘Where machines could replace humans - and where they can’t (yet)’, McKinsey Global Institute
28
4,000
Mining, Energy and Water
4,800
30,600
Manufacturing
15,800
8,300
Construction
17,500
70,000
Retail, Wholesale and Transport
63,200
4,000
Accommodation
Mining, Energy and Water
4,800
30,600
Information
Manufacturing
Total Jobs by
15,800
8,300
Finan
Construction
Sector ‘At Risk’ and
17,500
Retail, Wholesale and Transport
Profe
with ‘Automation
63,200
13,300
Business and Publ
Accommodation & food services
Potential’
47,500
4,600
Information & communication
Jobs 'At Risk' (PwC)
7,500
6,800
Jobs with Automation Potential (McKinsey)
Financial & insurance
7,600
12,300
Arts, entertainment, recreation
Professional Services
18,300
32,900
Sour
Business and Public Administration
28,400
29
4,800
Education
21,900
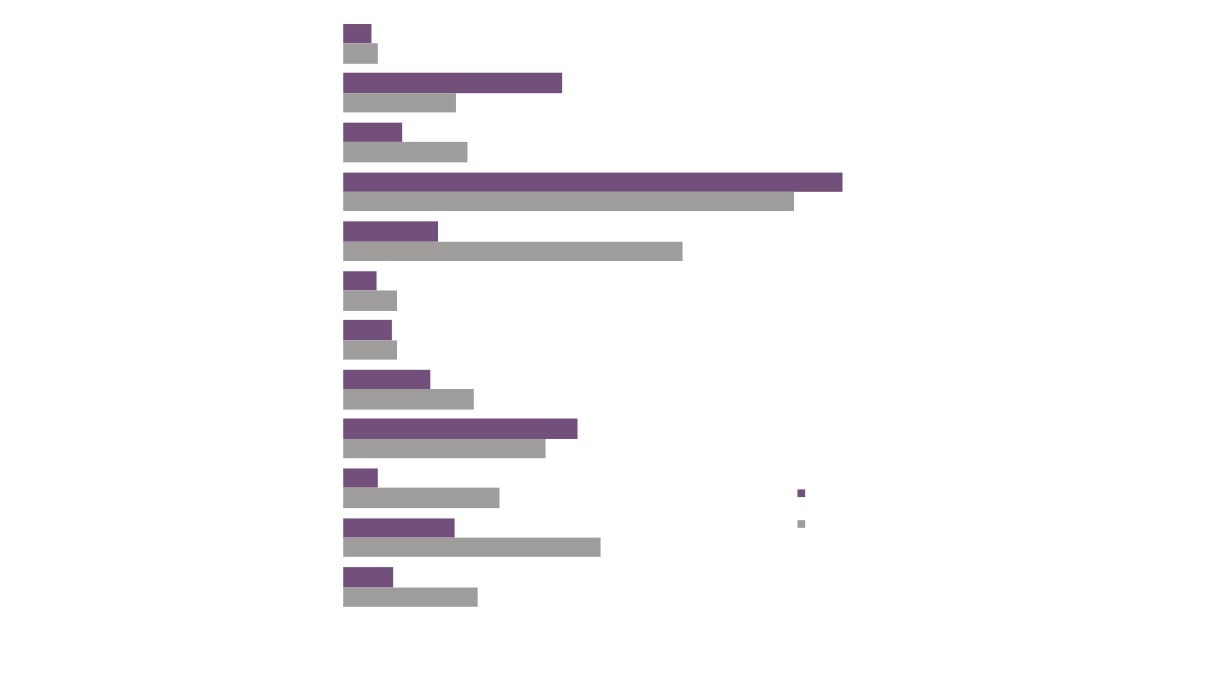
Comparison of PwC and McKinsey Research Based Outputs
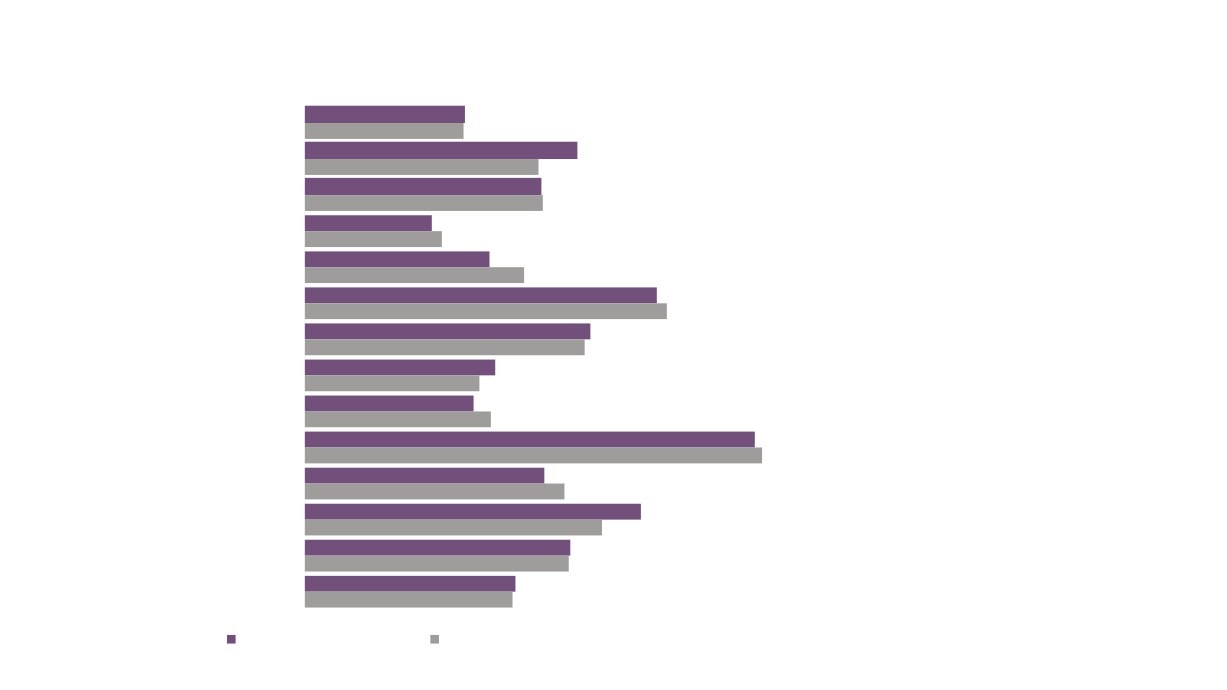
4.6%
for New Anglia
Babergh
4.6%
7.8%
Breckland
6.7%
6.8%
Broadland
6.9%
This chart shows the results for the
3.6%
Forest Heath
4.0%
two different analysis for New
5.3%
Great Yarmouth
Anglia jobs apportioned across the
6.3%
10.1%
Ipswich
New Anglia local authority areas.
10.4%
8.2%
There is generally little to choose
King's Lynn and West Norfolk
8.0%
5.5%
between the two but in three areas
Mid Suffolk
5.0%
(Breckland, Great Yarmouth, and
4.8%
North Norfolk
5.3%
St. Edmundsbury) we can see
13.0%
Norwich
13.2%
marked differences.
6.9%
South Norfolk
7.5%
9.7%
St Edmundsbury
8.5%
Sources: ‘UK Economic Outlook, March 2017’,
7.6%
PwC; ‘Where machines could replace humans -
Suffolk Coastal
7.6%
and where they can’t (yet)’, McKinsey Global
6.1%
Institute; Business Register and Employment
Waveney
6.0%
Survey, 2016, Office for National Statistics
PwC Based Analysis
McKinsey Based Analysis
30
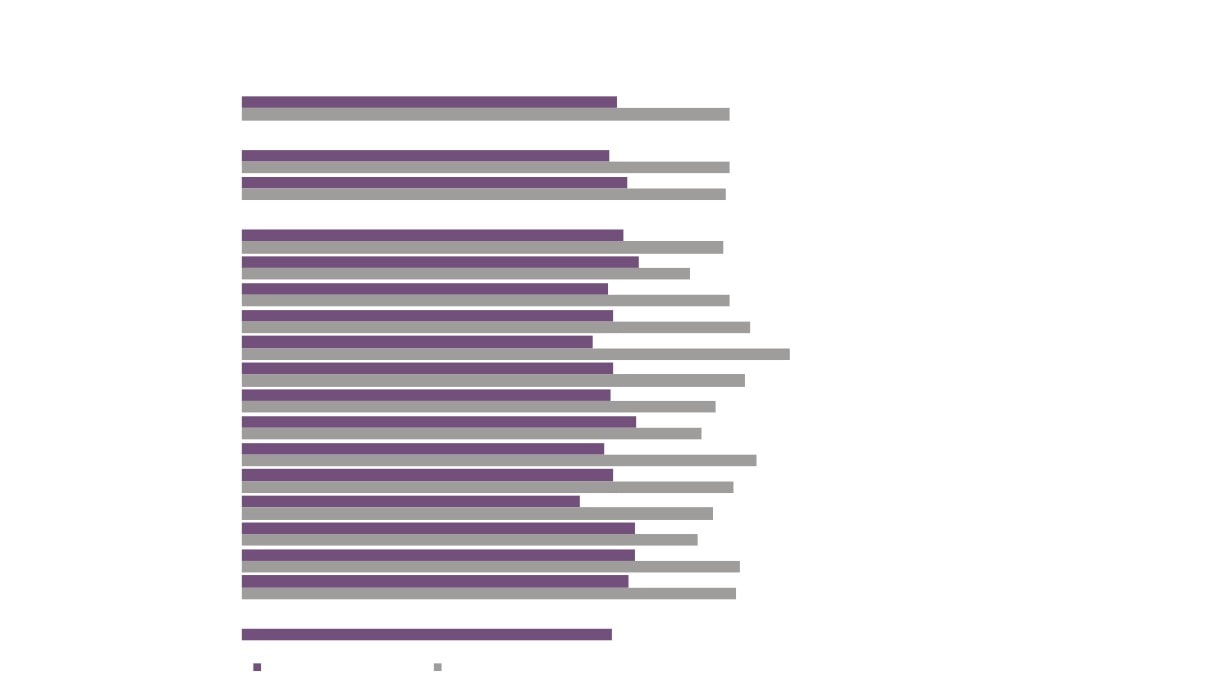
Comparison of PwC and McKinsey Research Based Outputs
for New Anglia (cont.)
31.0%
New Anglia
40.3%
This chart shows the results for the
30.3%
Norfolk
40.3%
31.8%
two different analysis results for the
Suffolk
40.0%
proportion of jobs at local authority
31.5%
Babergh
39.7%
level. On this basis we can see
32.8%
Breckland
37.1%
marked differences in two analyses
30.3%
Broadland
40.2%
across all area.
30.6%
Forest Heath
42.0%
29.0%
Great Yarmouth
45.2%
In general terms the PwC analysis
30.6%
Ipswich
41.5%
results in just over a third of jobs
30.4%
King's Lynn and West Norfolk
39.1%
32.6%
being ‘at risk’, with the McKinsey
Mid Suffolk
37.9%
29.9%
North Norfolk
analysis suggesting around two in
42.5%
30.7%
Norwich
40.6%
five jobs with the potential for
27.9%
South Norfolk
38.9%
automation.
32.5%
St Edmundsbury
37.7%
32.5%
Suffolk Coastal
41.1%
Sources: ‘UK Economic Outlook, March 2017’,
31.9%
Waveney
PwC; ‘Where machines could replace humans -
40.8%
and where they can’t (yet)’, McKinsey Global
Institute; Business Register and Employment
30.6%
England
Survey, 2016, Office for National Statistics
31
PwC Based Analysis
McKinsey Based Analysis
Analysis of Norwich’s
Regional Role in Retail
32
Norwich - A Strong Regional Centre for Retail
Rank
Centre
Retail Spend Potential
1
London West End
£9,141,226,044
Referring to retail specialists Harper Dennis
2
Glasgow
£4,260,877,222
Hobbs ‘2017 Vitality Rankings - Top 50 British
3
Birmingham
£3,738,666,154
4
Manchester
£3,534,636,565
Centres’ publication then we can see that
5
Leeds
£3,180,292,167
Norwich is ranked just outside the top 10 with a
6
Liverpool
£3,102,829,857
retail spend potential of approximately £2.3bn.
7
Nottingham
£3,003,776,127
8
Cardiff
£2,798,170,147
Only three other areas in the East of England
9
Newcastle upon Tyne
£2,796,940,154
region appear in the top 50, all with much lower
10
Edinburgh
£2,346,843,910
retail spend potentials.
11
Norwich
£2,318,506,810
26
Peterborough
£1,776,537,193
35
Ipswich
£1,570,249,828
40
Cambridge
£1,513,016,237
Source: 2017 Vitality Rankings - Top 50 British
Centres’, Harper Dennis Hobbs, June 2017
33
Norwich - A Strong Regional Centre for Retail
Retail Trade
Retail Units per
Despite having one of the lowest
Major Town/City
Population
Business Units
1,000 Population
populations of major towns and
cities in the East of England
Norwich
1,070
140,353
7.6
region, Norwich has the highest
Cambridge
755
124,919
6.0
number of retail business units.
Luton
1,030
214,658
4.8
This again implies that Norwich
Ipswich
630
138,480
4.5
services both a much wider area
St Albans
590
147,100
4.0
and larger population than other
Peterborough
795
198,914
4.0
major towns and cities in the
Chelmsford
540
176,200
3.1
region.
Sources: UK Business Counts 2017, Office for National Statistics; 2017 Mid-
year Population Estimates, Office for National Statistics
34
Analysis of STEM Subject
Student and Graduate
Destinations
35
South East
355
STUDY 2010/11 - 2014/15
London
255
GCGP
125
1,445
Hertfordshire
100
grew up outside New Anglia and
South East Midlands
75
studied STEM subjects in New
Coast to Capital
40
Anglia
Top 10 Origins of
Greater Lincolnshire
30
Students Coming to
eicester and Leicestershire
25
New Anglia and
Enterprise M3
15
Studying STEM
Subjects
D2N2
10
London
535
7,015
GCGP
400
grew up in New Anglia and
D2N2
365
studied STEM subjects in
Leicester and Leicestershire
335
England
South East
315
Top 10
West of England
255
Destinations for
Coventry and Warwickshire
250
Students Growing
Sheffield City Region
250
Up in New Anglia
5,100
and Studying
Solent
235
STEM Subjects
North Eastern
215
Elsewhere
(73%)
left and studied outside
New Anglia
Total studied STEM subjects in
Over the period 2010/11 - 2014/15
New Anglia
inclusive, New Anglia had a net flow of
students studying STEM subjects of
3,365
of which 43% came
36
- 3,650
from outside New Anglia
EMPLOYMENT 2010/11 - 2014/15
New Anglia
570
South East
120
1,155
GCGP
100
studied STEM subjects
London
100
outside New Anglia and
D2N2
75
subsequently found
employment in New Anglia
Leicester and Leicestershire
45
Heart of the South West
35
Top 10 Origins of
Coventry and Warwickshire
30
Students Studying
Leeds City Region
30
STEM Subjects and
North Eastern
30
Securing Employment
Solent
30
in New Anglia
1,100
studied STEM subjects in New
New Anglia
570
Anglia and subsequently
secured employment in
England
London
135
Top 10 Employment
80
South East
Destinations for
540
Students Studying
STEM subjects in New
(49%)
GCGP
60
Anglia
left and found
employment outside
Total studied STEM subjects and
Over the period 2010/11 - 2014/15
New Anglia
employed in New Anglia
inclusive, New Anglia had a net flow of
workers who studied STEM subjects of
1,715
of which 67% came
37
+615
from outside New Anglia
Creative
New
New
National
COMPARATORS
Industries
Anglia
Anglia
Subjects
Stay for study and employment
51.4%
87.6%
27.3%
29.3%
Leave for study, return for employment
30.2%
30.4%
Leave for study, do not return
38.7%
34.3%
Stay for study, leave for employment
48.6%
12.4%
3.9%
6.0%
NOTES ON DATA SOURCES & METHODOLOGY
- The data presented here is from the population of England-domiciled students who studied for a first degree at an English higher education provider between the
academic years 2010-11 and 2014-15 inclusive. Data comes from the Higher Education Statistics Agency (HESA) Student Record, the Education and Skills Funding
Agency’s Individualised Student Record (ILR) data and the Destinations of Leavers from Higher Education (DLHE) survey.
12%
- Creative Industries subjects defined here as ‘Biological Sciences’, ‘Chemistry’, ‘Computer Science’, ‘Engineering and Technology’, ‘Mathematical Sciences’, and
‘Physics and Astronomy’.
- Numbers are Full Person Equivalents. This is because individuals can be taught through collaborative arrangements at two (or more) institutions. In order to count
provision against both institutions, student counts have been divided between teaching institutions in proportion to the percentage of time taught at each.
- Data presented on mobility between home and study, where ‘home’ refers to the domicile of a student before they go to university, is for the population of students who
entered higher education between 2010-11 and 2014-15 and who have a valid postcode for both home and study. This is taken from the HESA Student Record and the
ILR. The total FPE for this population was 1,817,855.
- Data using employment location is restricted to students who left higher education between 2010-11 and 2014-15 and who provided a valid full or partial employment
postcode in response to the DLHE survey. The total FPE for this population was 710,800.
- Because these two populations differ significantly means that we are unable to make direct comparisons between the two i.e. calculate the true retention of students,
and movements into employment, for an area.
38