Creative Industries
Data Pack
Final Version 04.02.19
Contents
Introduction to the Sector Data Pack
Page 3
Introduction to and Definition of the Creative Industries / Plus Sector
Page 3
The Creative Industries in New Anglia
Page 4
Local Economic Contribution
Page 8
GVA
Page 11
Employment
Page 13
Enterprises
Page 39
Creative Industries Sector Skills Supply and Demand
Page 48
Further Education Learning Aims analysis
Page 49
Apprenticeships
Page 56
Higher Education
Page 57
Labour Insight Jobs tool sector analysis
Page 60
‘Where the Work is’ tool sector analysis
Page 67
A Future View of the Creative Industries Sector
Page 72
Results from the Creative Industries Sector Skills Planning Survey
Page 79
Appendices
Page 90
Creative Industries / Plus sector definition
Page 91
Creative Industries Plus Sub Sectors
Page 93
Creative Industries Occupations
Page 96
2
Introduction to the Sector Data Pack
The role of the Sector Data Pack is to bring together the latest socio-economic and labour market data and present both an up-to-date, and future view, of
the sector and any underlying issues within the area that could impact upon it. Data is presented in a navigable format without comment with
interpretation at this stage mainly left to the reader.
In most instances data has been analysed and presented down to local authority level. In some instances, and even where local authority data is
available, it has not been presented in the data pack due to issues of unreliability and small sample sizes. This is particularly the case with data from the
Annual Population Survey and the Annual Survey of Hours and Earnings.
Introduction to the Creative Industries Sector Definition
In order to arrive at a definition for the Creative Industries sector relevant to New Anglia we have started out with those Standard Industrial Classification
(SIC) codes used by the Department for Culture, Media and Sport (DCMS) to define the Creative Industries sector. From these codes, some have been
removed in order to reduce the overlap with the cultural element of the Visitor Economy sector. Full details of these codes and those removed can be
found in the Appendices on page 91.
In addition to a SIC code definition of the sector, DCMS also produced a definition based on Standard Occupational Classification (SOC) codes (refer to
the Appendices page 93 for details). If we consider occupational employment rather than industry employment then the figure is much higher given that
many creative roles are apparent with traditional non-creative industries. For example, nationally then approximately 1.8m people are employed in the
Creative Industries sector, whilst there are approximately 2.8m people employed in the ‘Creative Economy’ (creative roles). This ratio of industry to
occupational employment has been applied at the local level to arrive at the ‘Creative Economy’ employment figure presented on page 6.
3
The Creative Industries
Sector in New Anglia
4
Creative
Creative
18,800
2,300
Industries
Jobs
Industries Jobs
Plus
- Wired and wireless telecoms
- Reproduction of video, sound etc.
- Textiles
- Manufacture of furnishings,
clothing etc.
- Market Research
5
DCMS
Creative
Industries
- Library activities
New Anglia
Creative
- Archive activities
- Motion picture
Creative
Creative
projection
Economy
Industries
- Translation and
Industries
Creative roles in traditionally
Plus
interpretation
non-creative sectors
2,300
- Museum activities
18,800
Approximately
Jobs
- Cultural education
29,300
Jobs
Jobs
6
Advanced Manufacturing and Engineering
3,600 jobs
2,700 jobs
6,200 jobs
Visitor
Economy
(Tourism &
Creative
Culture)
Industries
6,300 jobs
Plus
Construction
and
Development
7
Local Economic
Contribution
4,260
3,995
7.0%
6.6%
£984m
21,100
18,800
£790m
2.8%
2.7%
2.4%
2.2%
GVA
Employment
Enterprises
Creative Industries
Creative Industries Plus
Source: New Anglia LEP Economic Strategy evidence base work
8
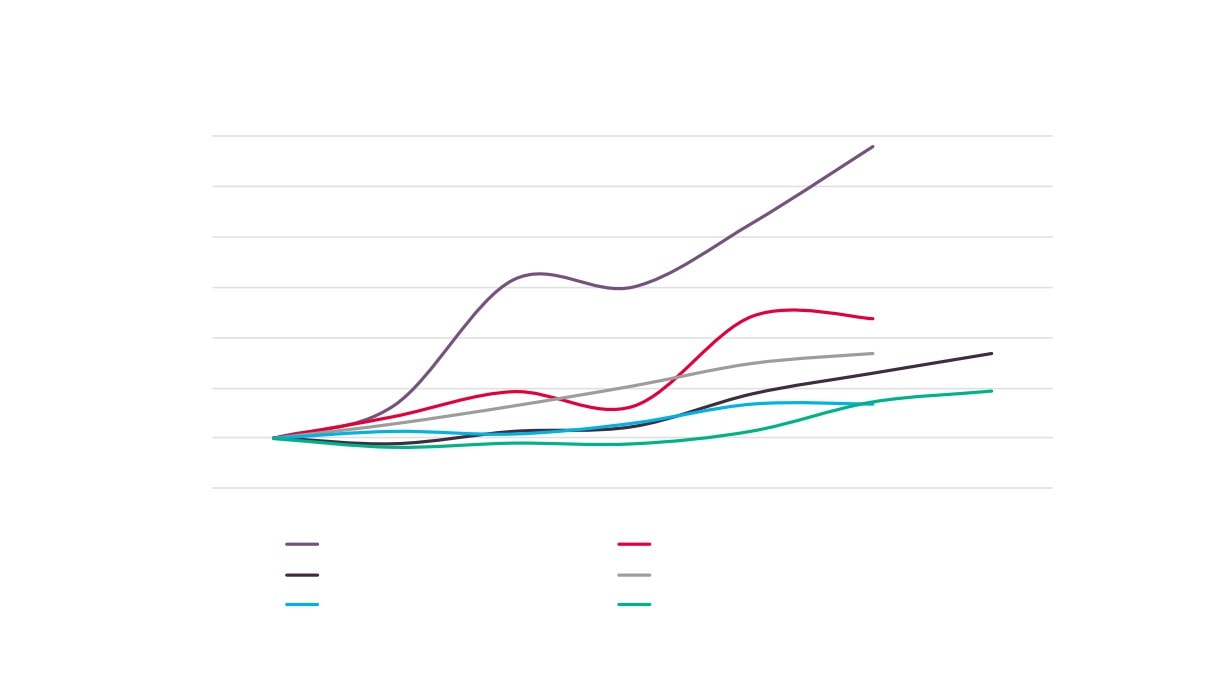
Creative Industries Sector Performance Over Time
150
140
130
120
110
100
90
2010
2011
2012
2013
2014
2015
2016
Creative Industries GVA
Creative Industries Employment
Creative Industries Enterprises
Total GVA
Total Employment
Total Enterprises
Source: New Anglia LEP Economic Strategy evidence base work
9
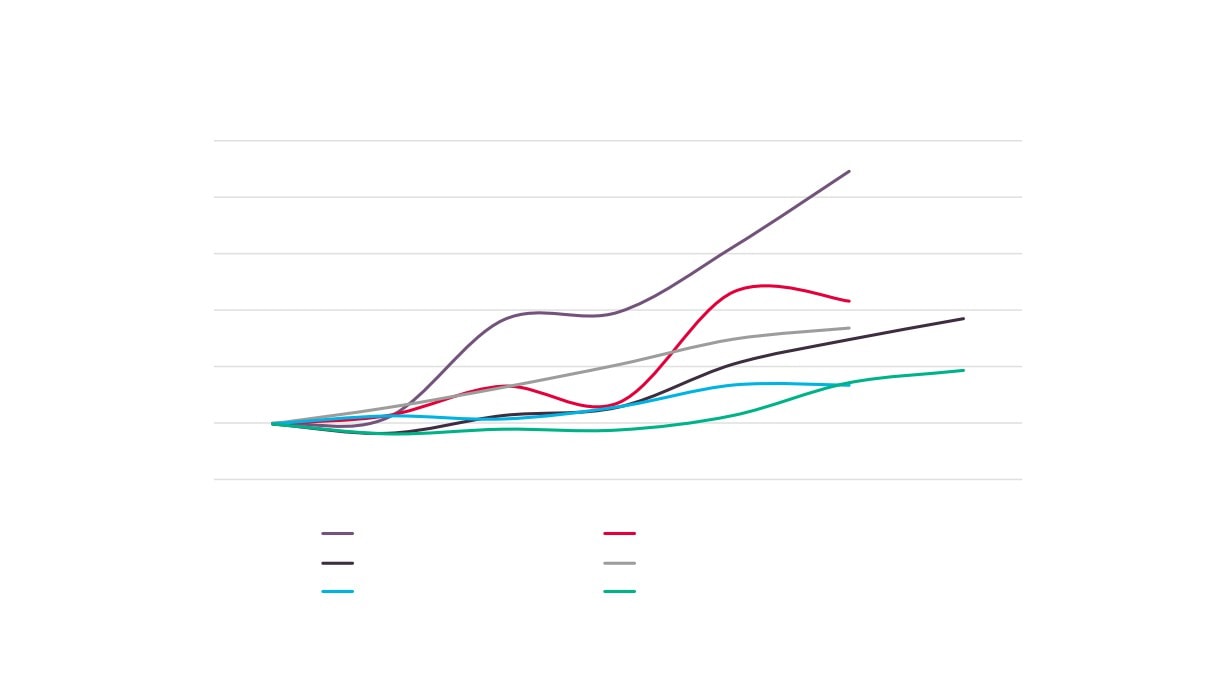
Creative Industries Plus Sector Performance Over Time
160
150
140
130
120
110
100
90
2010
2011
2012
2013
2014
2015
2016
Creative Industries Plus GVA
Creative Industries Plus Employment
Creative Industries Plus Enterprises
Total GVA
Total Employment
Total Enterprises
Source: New Anglia LEP Economic Strategy evidence base work
10
£19m
Gross Value
Fashion
£48m
Added
£43m
£57m
Textiles
Music, Performing & Visual
£174m
Arts
Crafts
GVA by Creative
Design
Industries Plus
£337m
Publishing
Subsector
Source: New Anglia LEP Economic
IT, Software & Computer
Strategy evidence base work
Services
Film, TV, Video, Radio &
£123m
Photography
£53m
Architectural activities
£128m
Advertising & Marketing
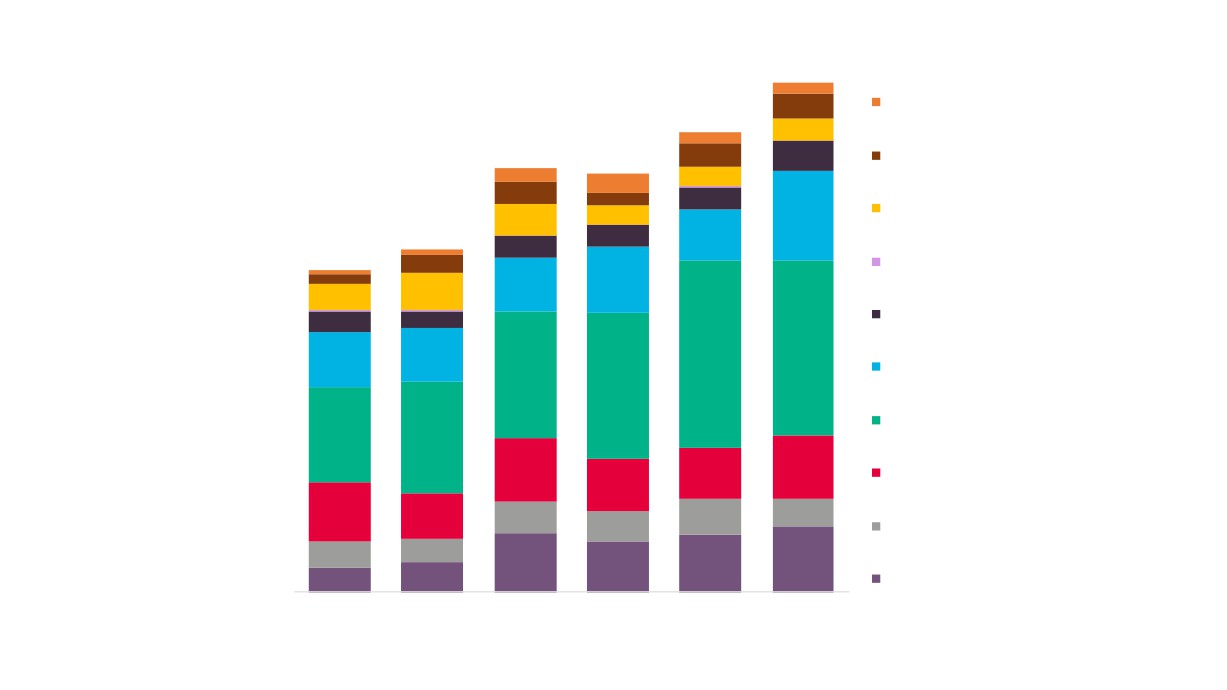
11
£19
£48
Fashion
GVA (£M)
£43
£23
£43
£57
Textiles
Over Time by
£27
£39
£37
£41
£26
£43
Creative
Music, Performing & Visual Arts
£36
£174
£61
£43
£100
Industries
£43
£37
Crafts
£20
£129
Plus
£103
£72
£49
Design
Subsector
£42
£33
£337
£103
£362
Source: New Anglia LEP
£106
Publishing
Economic Strategy evidence
£246
£282
base work
IT, Software & Computer Services
£183
£215
£123
£123
£97
Film, TV, Video, Radio & Photography
£99
£115
£53
£88
£60
£70
£59
Architectural activities
£46
£50
£128
£114
£99
£112
£48
£58
Advertising & Marketing
2010
2011
2012
2013
2014
2015
12
Employment
13,545
New Anglia
15,200
7,015
Norfolk
Creative Industries
7,710
Creative
Creative Industries Plus
6,835
Industries Sector
Suf folk
7,840
Employment by
25,420
Please note that the figure for New Anglia’s
LEP Comparator
Creative Industries / Plus sector employment is
GCGP LEP
different to that reported on page 8 due to a
27,470
different source being used for this information.
Areas
This is so to enable comparison with other
areas across the UK.
Source: Business Register and
5,195
Employment Survey, Office for
Greater Lincolnshire LEP
National Statistics
6,315
48,695
South East LEP
53,200
92,530
East of England
99,850
13
2.0%
New Anglia
2.2%
1.9%
Norfolk
2.1%
2.2%
Suf folk
Proportion of Total
2.5%
Employment
3.3%
Creative Industries
GCGP LEP
Provided by
3.6%
Creative Industries Plus
Creative Industries
1.2%
Great er Lincolnshire LEP
1.5%
Sector, by LEP
Comparator Areas
8.2%
London LEP
9.1%
Source: Business Register and
Employment Survey, Office for
National Statistics
3.0%
South East LEP
3.3%
3.4%
East of England
3.7%
4.0%
England
4.6%
14
Creative Industries Sector Employment by Additional LEP
Comparator Areas
Source: Business Register and Employment
Please note that the figure for New Anglia’s
Survey, Office for National Statistics
Creative Industries / Plus sector employment is
44,725
different to that reported on page 8 due to a
different source being used for this information.
This is so to enable comparison with other
areas across the UK.
31,355
27,805
27,960
16,850
15,035
Coast to Capital Greater Birmingham Greater Manchester
New Anglia
North East
West of England
and Solihull
15
Proportion of Total Employment Provided by Creative
Industries Sector, by Additional LEP Comparator Areas
Source: Business Register and Employment
Survey, Office for National Statistics
West of
England
Coast to
Greater
Greater
Capital
Birmingham
Manchester
and Solihull
New Anglia
4.9%
3.6%
3.4%
2.9%
2.1%
2.0%
North East
16
Creative Industries Sector Employment by Additional City
Comparator Areas
Source: Business Register and Employment
Survey, Office for National Statistics
17,580
14,975
15,135
7,680
6,585
3,335
1,955
Brighton and
Birmingham
Manchester
Ipswich
Norwich
Newcastle upon Bristol, City of
Hove
Tyne
17
Proportion of Total Employment Provided by Creative Industries Sector,
by Additional City Comparator Areas
Source: Business Register and Employment
Survey, Office for National Statistics
5.5%
4.8%
4.5%
4.1%
3.6%
2.8%
2.7%
18
525
Breckland
590
850
Broadland
885
285
2.0%
New Anglia
2.2%
Creative
1.9%
Industries Sectorfolk
2.1%
Employment by
2.2%
New Anglia LEP
Suf folk
2.5%
Local Authority
3.3%
Areas
Creative Industries
GCGP LEP
3.6%
Source: Business Register and
Employment Survey, Office for National
Creative Industries Plus
Statistics
1.2%
Great er Lincolnshire LEP
1.5%
8.2%
London LEP
9.1%
19
3.0%
South East LEP
2.2%
Suf folk
2.5%
3.3%
Creative Industries
GCGP LEP
3.6%
Proportion of
Creative Industries Plus
1.2%
Total
Great er Lincolnshire LEP
1.5%
Employment
8.2%
Provided by
London LEP
9.1%
Creative
Industries Sector,
3.0%
South East LEP
3.3%
by New Anglia
LEP Local
3.4%
Authority Areasf England
3.7%
Source: Business Register and
4.0%
Employment Survey, Office for National
England
Statistics
4.6%
Suffolk Coastal
2.6%
1.3%
Waveney
1.3%
20
20%
New Anglia
23%
26%
Norfolk
29%
Change in
15%
Suffolk
20%
Creative
Creative Industries
17%
Industries
Creative Industries Plus
GCGP
16%
Sector
-5%
Employment,
Greater Lincolnshire LEP
-13%
2010 - 2015,
26%
London LEP
by LEP
25%
Comparator
38%
South East LEP
Areas
31%
Source: Business Register and
Employment Survey, Office for
39%
National Statistics
East
30%
23%
England
19%
21
Employment Change by Additional LEP Comparator Areas
180
160
140
120
100
80
60
2009
2010
2011
2012
2013
2014
2015
2016
2017
Coast to Capital
Greater Birmingham and Solihull
Greater Manchester
New Anglia
North East
West of England
Source: Business Register and Employment Survey, Office for National Statistics
22
180
Empl
ds
180
160
140
120
100
80
60
2009
2010
2011
2012
2013
2014
2015
2016
2017
3
Coast to Capital
Greater Birmingham and Solihull
Greater Manchester
New Anglia
Employment Change by Additional City Comparator Areas
220
200
180
160
140
120
100
80
60
2009
2010
2011
2012
2013
2014
2015
2016
2017
Newcastle upon Tyne
Manchester
Brighton and Hove
Bristol, City of
Birmingham
Ipswich
Norwich
Source: Business Register and Employment Survey, Office for National Statistics
24
Employment Change by Additional City Comparator Areas - Trends
220
200
180
160
140
120
100
80
60
2009
2010
2011
2012
2013
2014
2015
2016
2017
Newcastle upon Tyne
Manchester
Brighton and Hove
Bristol, City of
Birmingham
Ipswich
Norwich
Linear (Newcastle upon Tyne)
Linear (Manchester)
Linear (Brighton and Hove)
Linear (Bristol, City of)
Linear (Birmingham)
Source: Business Register and Employment Survey, Office for National Statistics
5
Linear (Ipswich)
Linear (Norwich)
1.9%
Norfolk
2.1%
2.2%
Suf folk
2.5%
Change in
Creative
3.3%
Creative Industries
GCGP LEP
Industries
3.6%
Creative Industries Plus
Sector
1.2%
Employment,t er Lincolnshire LEP
1.5%
2010 - 2015,
8.2%
by New Anglia
London LEP
9.1%
LEP Local
3.0%
Authority
South East LEP
3.3%
Areas
Source: Business Register and
3.4%
Employment Survey, Office for
East of England
National Statistics
3.7%
4.0%
England
4.6%
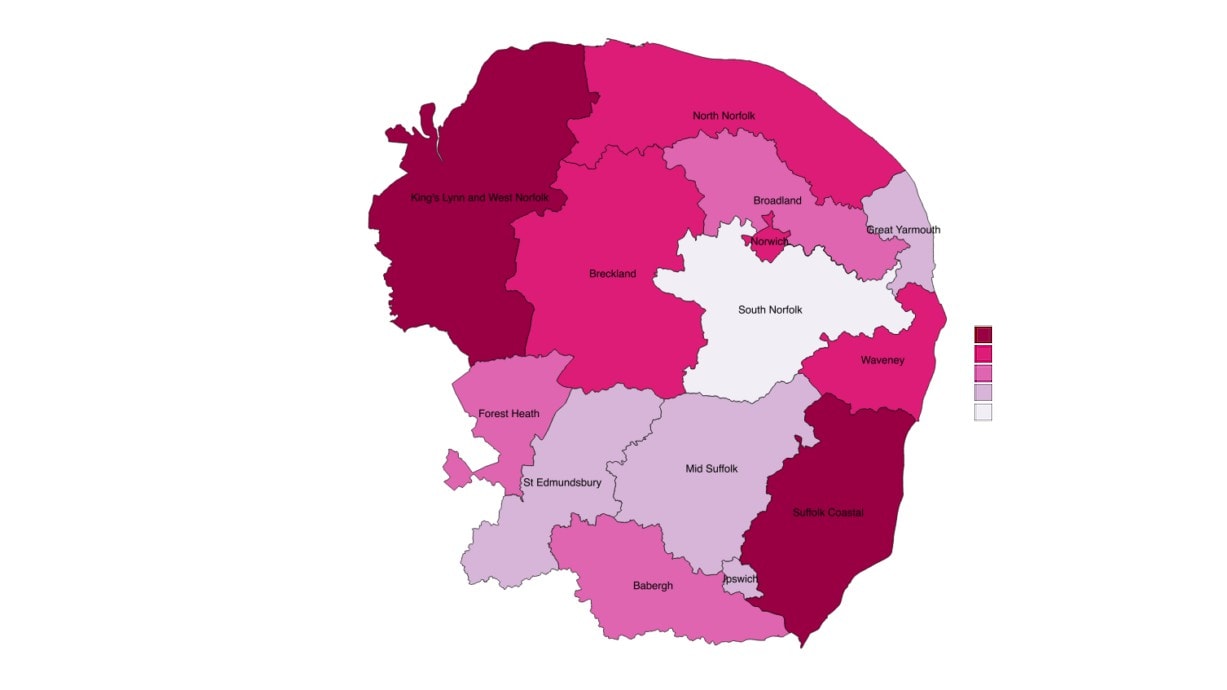
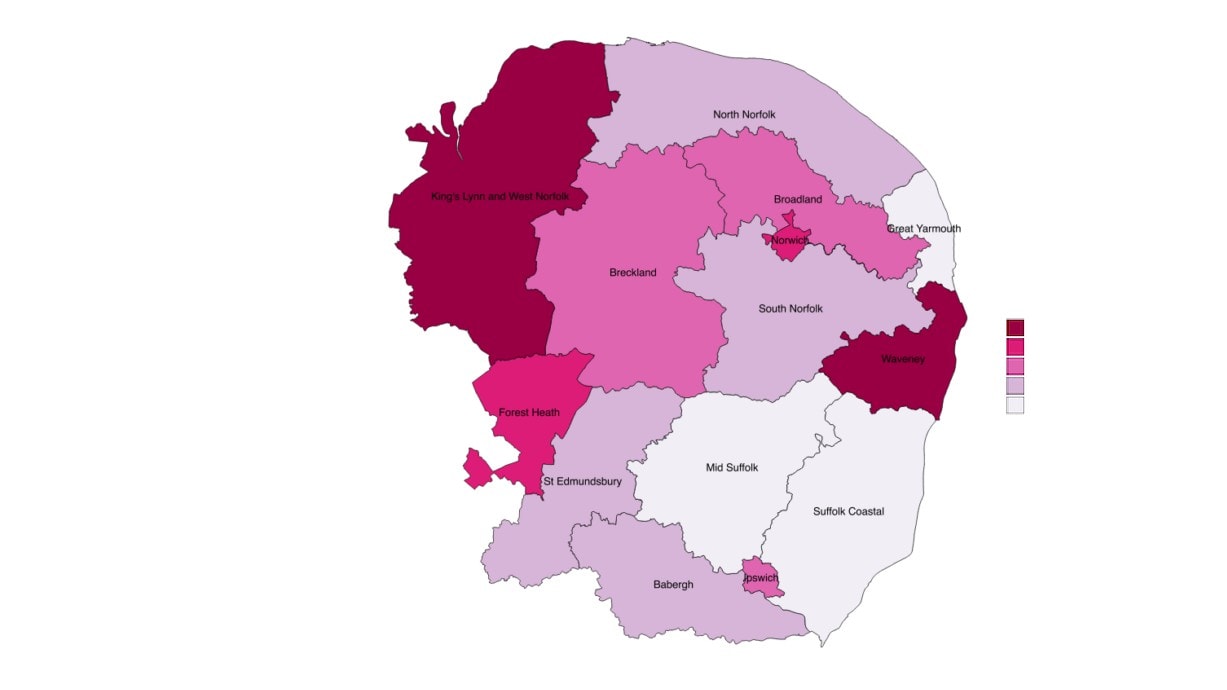
26
Change in
Creative
Industries Plus
Sector
Employment,
2010 - 2015,
47 - 57%
31 - 47%
by New Anglia
11 - 31%
0 - 11%
LEP Local
-3 - 0%
Authority
Areas
Source: Business Register and
Employment Survey, Office for
National Statistics
27
100%
5%
Fashion
4%
4%
6%
4%
Textiles
4%
8%
11%
Music, Performing &
Visual Arts
Crafts
Creative Industries
Plus, Employment by
Design
40%
48%
Sub Sector
Source: Business Register and
Publishing
Employment Survey, Office for
National Statistics
IT, Software & Computer
Services
6%
10%
Film, TV, Video, Radio &
10%
Photography
5%
Architectural activities
17%
15%
Advertising & Marketing
0%
New Anglia
England
28
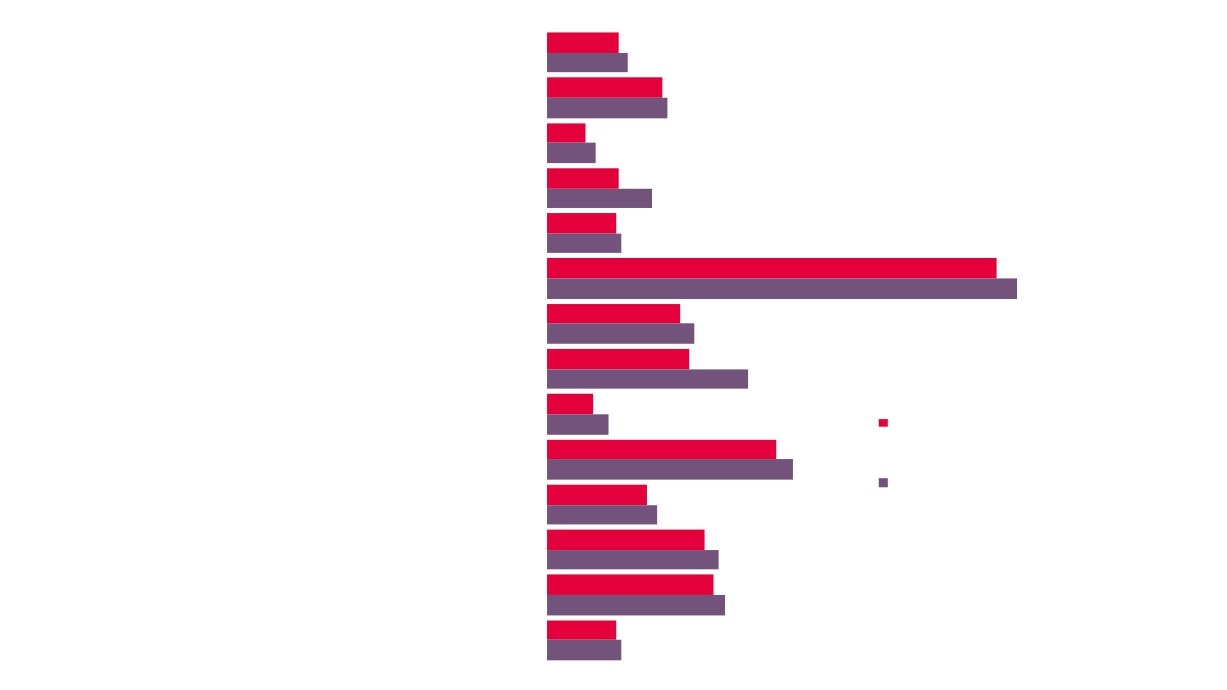
Top Creative Industries Plus Sub Sectors by Employment, 2015
% of total
Change in
Creative
Industry Sector Code
Industry Sector Name
Employment
employment 2010 -
Industries Plus
2015
employment
62020
Computer consultancy activities
4,300
20%
34%
62012
Business and domestic software development
2,000
10%
52%
58142
Publishing of consumer, business and professional journals and periodi
1,700
8%
325%
74100
Specialised design activities
1,700
8%
-3%
58130
Publishing of newspapers
1,500
7%
20%
73110
Advertising agencies
1,300
6%
1%
71111
Architectural activities
1,100
5%
-18%
90030
Artistic creation
70
3%
-39%
58110
Book publishing
70
3%
186%
58190
Other publishing activities
600
3%
82%
Source: New Anglia LEP Economic Strategy evidence base work
29
Top Creative Industries Plus Sub Sectors with 100+
Employees by Growth in Employment
% of total
Change in
Creative
Industry Sector Code
Industry Sector Name
Employment
employment
Industries Plus
2010 - 2015
employment
13960
Manufacture of other technical and industrial textiles
200
0.9%
2547%
28940
Manufacture of machinery for textile, apparel and leather production
100
0.3%
2456%
59112
Video production activities
200
1.1%
1893%
58210
Publishing of computer games
100
0.4%
1673%
61200
Wireless telecommunications activities
200
0.9%
1239%
14131
Manufacture of men's outerwear, other than leather clothes and workwear
100
0.7%
967%
58142
Publishing of consumer, business and professional journals and periodicals
1,700
8.0%
325%
59131
Motion picture distribution activities
100
0.6%
231%
13300
Finishing of textiles
100
0.5%
205%
59200
Sound recording and music publishing activities
300
1.3%
192%
58110
Book publishing
700
3.2%
186%
59113
Television programme production activities
300
1.5%
120%
58290
Other software publishing
100
0.7%
111%
59111
Motion picture production activities
400
1.7%
106%
61100
Wired telecommunications activities
100
0.5%
104%
Source: New Anglia LEP Economic Strategy evidence base work
30
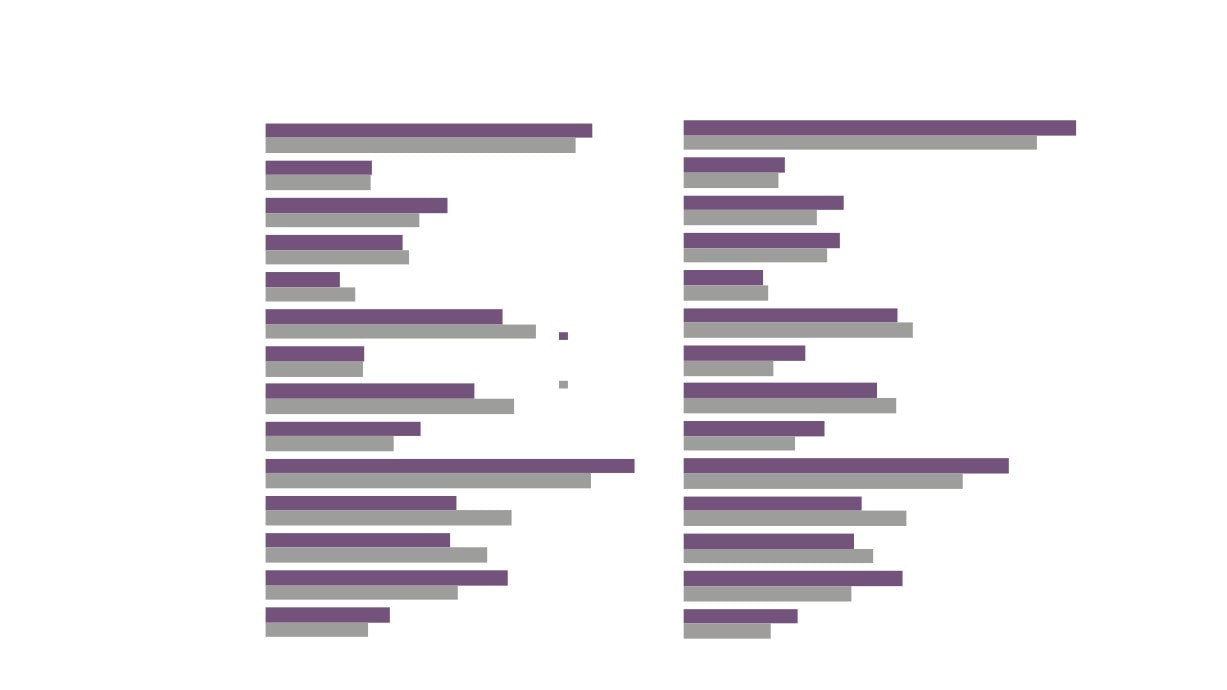
Creative Industries Location Quotients
Across Comparator Areas, 2010 and 2015
Creative Industries
Creative Industries Plus
0.5
0.5
New Anglia
New Anglia
0.5
0.5
Location quotients (LQs) are a
0.5
0.5
useful way of showing a sectors
Norfolk
Norfolk
0.5
0.4
importance to the local economy
relative to the national picture.
0.5
0.5
Suffolk
Suffolk
0.6
0.5
The analysis presented here
uses employment with an LQ
above 1 showing a higher
concentration than nationally,
0.9
0.8
and an LQ of below than 1 a
GCGP
GCGP
0.9
0.8
lower concentration.
0.3
0.3
Greater Lincolnshire
Greater Lincolnshire
0.4
0.4
2.0
London
London
2.1
0.8
0.7
South East
South East
0.7
0.6
0.9
0.8
East
East
0.8
0.7
Source: Business Register and Employment Survey, Office for National Statistics
31
Creative Industries Location Quotients Across New Anglia, 2015
Creative Industries
Creative Industries Plus
0.8
Babergh
h
0.8
0.9
0.3
0.3
Breckland
d
0.3
0.2
0.5
0.4
Broadland
d
0.4
0.3
0.3
0.4
Location quotients (LQs) are a
Forest Heath
h
0.4
0.4
useful way of showing a sectors
0.2
0.2
importance to the local economy
Great Yarmouth
h
0.2
0.2
relative to the national picture.
0.6
0.5
The analysis presented here
Ipswich
h
0.7
0.6
2015
uses employment with an LQ
0.2
0.3
above 1 showing a higher
King`s Lynn and West Norfolk
k
0.2
0.2
concentration than nationally,
2010
0.5
0.5
and an LQ of below than 1 a
Mid Suffolk
k
0.6
0.5
lower concentration.
0.4
0.4
North Norfolk
k
0.3
0.3
0.9
0.8
Norwich
h
0.8
0.7
0.5
0.5
South Norfolk
k
0.6
0.6
0.5
0.4
St Edmundsbury
y
0.6
0.5
0.6
0.6
Suffolk Coastal
l
0.5
0.4
0.3
0.3
Waveney
y
0.3
0.2
Source: Business Register and Employment Survey, Office for National Statistics
32
Creative Industries Plus Sub Sectors With Location
Quotients (LQs) Above 1
% of total Creative
Industry Sector Code
Industry Sector Name
Employment Industries Plus
LQ
employment
32200
Manufacture of musical instruments
150
1.0%
6.3
13200
Weaving of textiles
250
1.7%
2.4
13960
Manufacture of other technical and industrial textiles
150
1.0%
1.9
58142
Publishing of consumer, business and professional journals and periodicals
1,000
6.9%
1.2
61100
Wired telecommunications activities
300
2.1%
1.1
90040
Operation of arts facilities
450
3.1%
1.1
Source: Business Register and Employment Survey 2015, Office for National Statistics
33
Full time, part time, and self-employment in
the Creative Industries Plus sector, 2015
New Anglia
57%
29%
14%
Creative Industries
55%
16%
29%
0%
100%
Full time
Part time
Self Employed
Source: New Anglia LEP Economic Strategy evidence base work
34
Change in full time, part time, and self-employment
in Creative Industries, 2010 - 2015
39.2%
Full time
43.0%
8.7%
5.0%
Creative Industries
Part time
3.4%
2.1%
Creative Industries Plus
6.2%
New Anglia
Self employed
9.3%
10.0%
Source: New Anglia LEP Economic Strategy evidence base work
35
3%
Fashion
12%
Textiles
Music, Performing & Visual
15%
Arts
Crafts
Design
Self Employment by
29%
Creative Industries
Publishing
Plus Sub Sector
IT, Software & Computer
Source: New Anglia LEP Economic Strategy evidence
Services
base work
18%
Film, TV, Video, Radio &
Photography
Architectural activities
11%
3%
Advertising & Marketing
7%
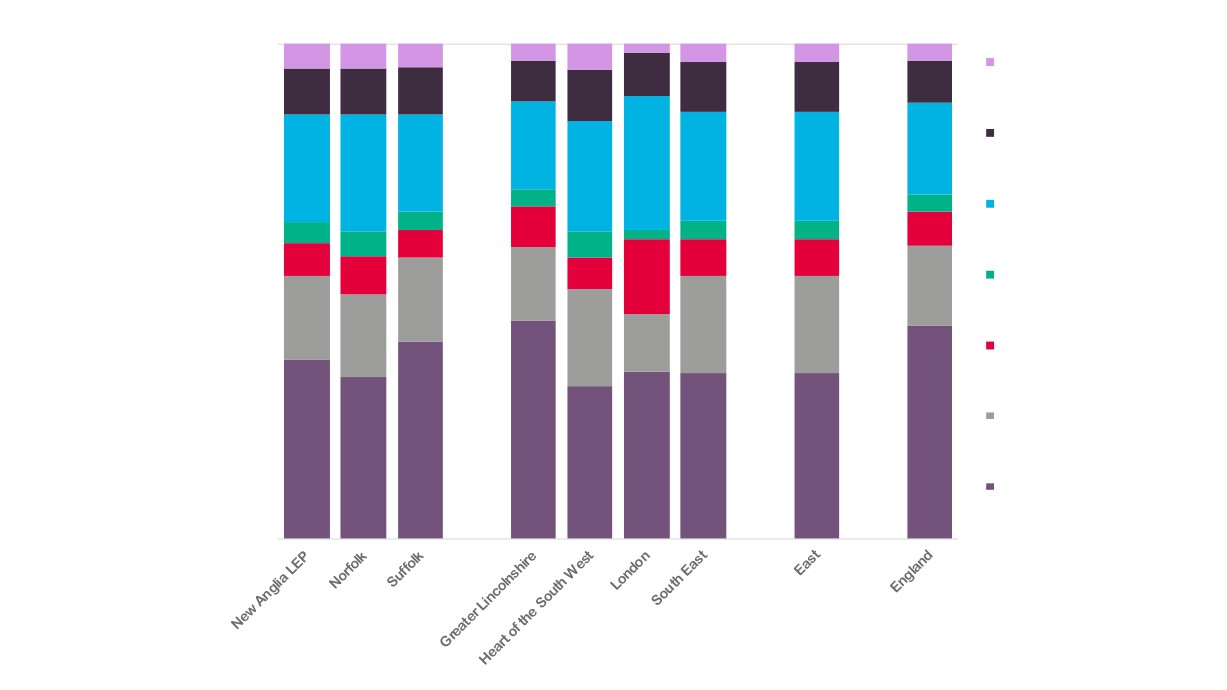
36
100%
2%
3%
4%
4%
3%
5%
5%
5%
5%
541 Textiles and Garments
Workplace
9%
Trades
8%
9%
10%
10%
9%
9%
9%
10%
Creative
342 Design Occupations
18%
Industries
18%
22%
20%
27%
22%
22%
24%
22%
Employment
3%
3%
341 Artistic, Literary and
4%
Media Occupations
4%
8%
4%
4%
7%
2011 by Broad
2%
5%
6%
5%
7%
7%
7%
8%
6%
312 Draughtspersons and
Standard
15%
15%
16%
Related Architectural
17%
Technicians
17%
Occupational
20%
20%
17%
20%
12%
247 Media Professionals
Classification
(SOC) Across
243 Architects, Town Planners
44%
43%
and Surveyors
40%
Comparator
36%
33%
34%
34%
34%
31%
213 Information Technology
Areas
and Telecommunications
Source: 2011 Census, Office
Professionals
for National Statistics
0%
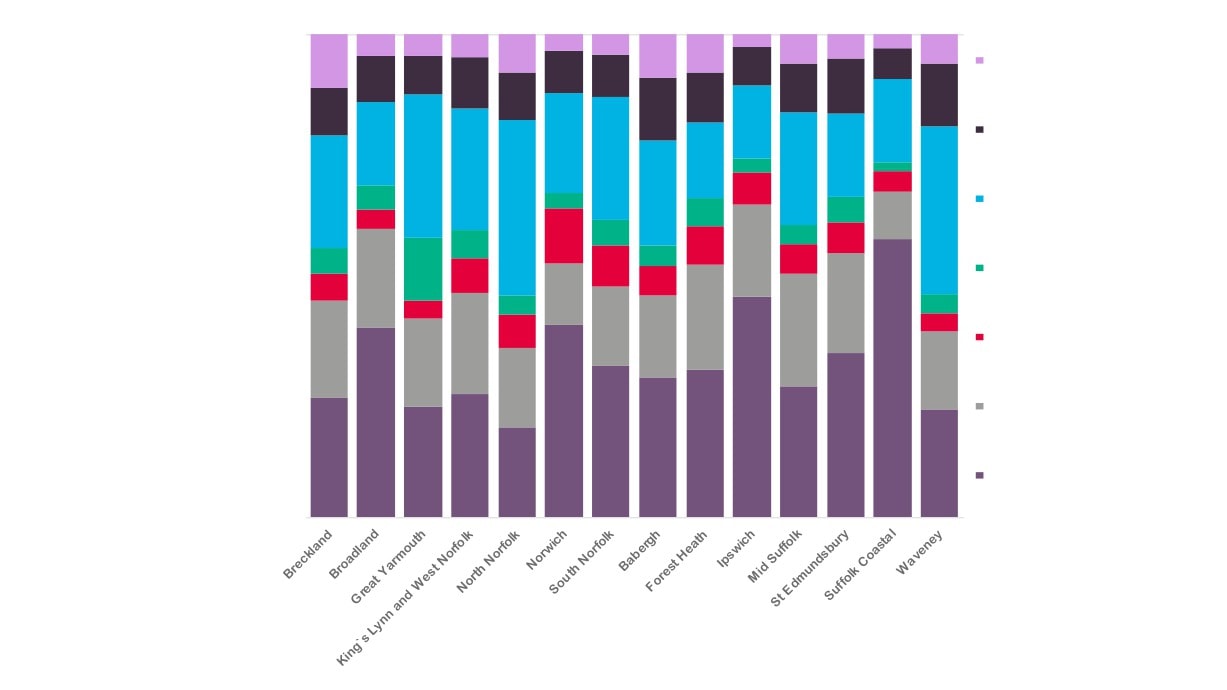
37
100%
3%
3%
3%
4%
4%
5%
4%
5%
6%
6%
8%
9%
8%
11%
6%
541 Textiles and Garments Trades
8%
Workplace
9%
8%
9%
10%
11%
10%
11%
10%
10%
13%
10%
13%
Creative
15%
17%
342 Design Occupations
17%
21%
Industries
17%
25%
16%
30%
3%
2%
25%
23%
4%
23%
7%
22%
Employment
5%
341 Artistic, Literary and Media
3%
37%
5%
35%
6%
10%
Occupations
4%
11%
6%
4%
6%
2011 by Broad
6%
8%
19%
4%
5%
6%
13%
8%
312 Draughtspersons and Related
20%
7%
Standard
6%
Architectural Technicians
6%
13%
4%
21%
4%
4%
22%
16%
4%
Occupational
7%
23%
17%
247 Media Professionals
21%
20%
18%
Classification
16%
58%
17%
46%
243 Architects, Town Planners and
(SOC) across
39%
40%
Surveyors
34%
31%
30%
29%
27%
New Anglia
25%
26%
23%
22%
19%
213 Information Technology and
Source: 2011 Census, Office
Telecommunications Professionals
for National Statistics
0%
38
2.0%
New Anglia
prises
2.2%
1.9%
Norfolk
2.1%
Number of
2.2%
Suf folk
Creative
2.5%
Industries
3.3%
Creative Industries
Enterprises by
3.6%
Comparator
Creative Industries Plus
1.2%
Great er Lincolnshire LEP
1.5%
8.2%
London LEP
9.1%
3.0%
South East LEP
3.3%
3.4%
39
East of England
3.7%
1.9%
Norfolk
2.1%
2.2%
Suf folk
2.5%
Proportion of
Total
3.3%
Creative Industries
GCGP LEP
3.6%
Enterprises
Creative Industries Plus
provided by
1.2%
Great er Lincolnshire LEP
1.5%
Creative
Industries, by
8.2%
London LEP
9.1%
Comparator
Areas, 2016
3.0%
South East LEP
Source: UK Business Counts,
3.3%
Office for National Statistics
3.4%
East of England
3.7%
4.0%
England
40
4.6%
235
Breckland
245
325
Broadland
2.0%
New Anglia
2.2%
Number of
1.9%
Creative
Norfolk
2.1%
Industries
2.2%
Suffolk
Enterprises by
2.5%
New Anglia
3.3%
Creative Industries
GCGP LEP
3.6%
2016
Creative Industries Plus
Source: UK Business Counts,
1.2%
Office for National Statistics olnshire LEP
1.5%
8.2%
London LEP
9.1%
41
3.0%
South East LEP
New Anglia
2.2%
1.9%
Norfolk
2.1%
2.2%
Suf folk
2.5%
C
3.3%
Creative Industries
GCGP LEP
C
3.6%
Creative Industries Plus
I
1.2%
Great er Lincolnshire LEP
E
1.5%
C
8.2%
London LEP
9.1%
2
Source: UK Business Counts,
3.0%
Office for National Statistics
South East LEP
3.3%
3.4%
East of England
3.7%
4.0%
England
42
4.6%
13%
Babergh
10%
24%
Breckland
20%
35%
Broadland
31%
42%
Forest Heath
Change in
40%
Creative
Great Yarmouth
0%
Industries
2.0%
En
New Anglia
2.2%
Ne
1.9%
Lo
Norfolk
2.1%
20
Source: UK Business Counts,
2.2%
Office for National Statistics
Suf folk
2.5%
3.3%
Creative Industries
GCGP LEP
3.6%
Creative Industries Plus
1.2%
Great er Lincolnshire LEP
1.5%
43
8.2%
Change in
Creative
Industries Plus
Sector
40 - 49%
Enterprises,
31 - 40%
13 - 31%
2010 - 2016, by
6 - 13%
0 - 6%
New Anglia Local
Authority
Source: UK Business Counts,
Office for National Statistics
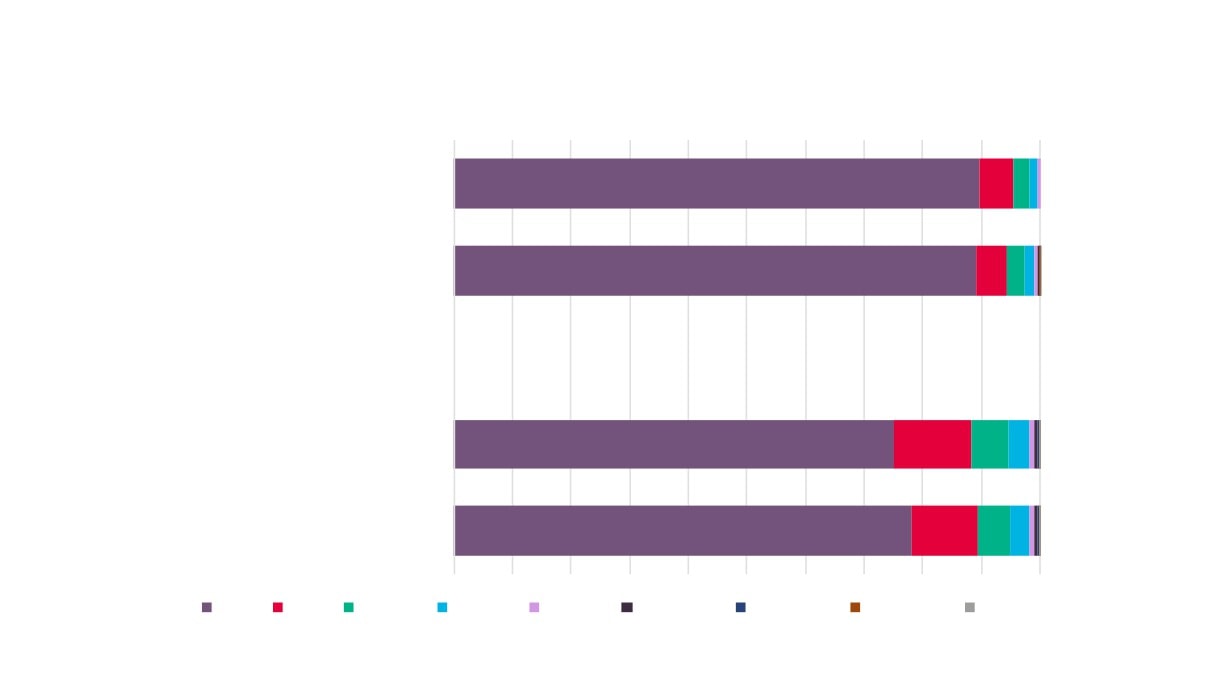
44
Business (Enterprise) Size by Employee Numbers
0%
10%
20%
30%
40%
50%
60%
70%
80%
90% 100%
New Anglia Creative Industries +
89.7%
5.8%
England Creative Industries +
89.1%
5.4%
All Businesses - New Anglia
75.1%
13.1%
6.3%
All Businesses - England
78.0%
11.2%
5.7%
0 to 4
5 to 9
10 to 19
20 to 49
50 to 99
100 to 249
250 to 499
500 to 999
1000+
Source: UK Business Counts, Office for National Statistics
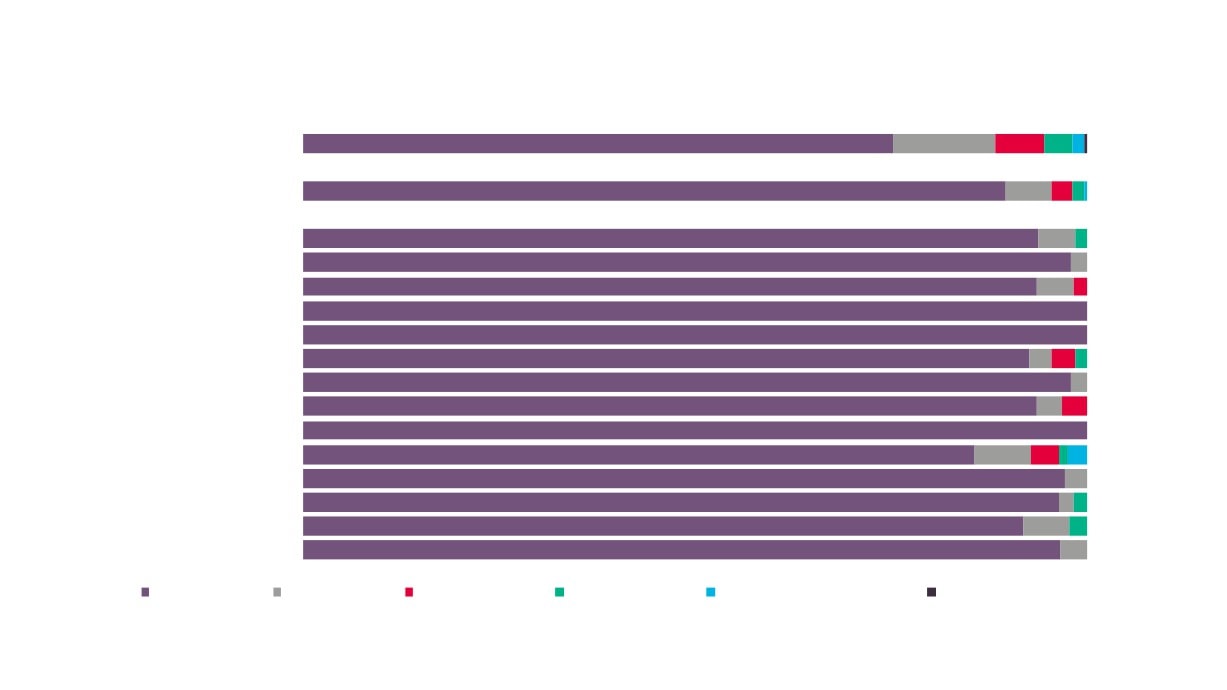
45
Creative Industries Plus Enterprises by Size
(employee numbers)
New Anglia
75%
13%
6%
4%
Creative Industries Plus
90%
6%
3%
Babergh
94%
5%
Breckland
98%
2%
Broadland
94%
5%
Forest Heath
100%
Great Yarmouth
100%
Ipswich
93%
3%3%
King`s Lynn and West Norfolk
98%
2%
Mid Suffolk
94%
3%3%
North Norfolk
100%
Norwich
86%
7%
4% 2%
South Norfolk
97%
3%
St Edmundsbury
96%
Suffolk Coastal
92%
6%
2%
Waveney
97%
3%
Micro (0 to 4)
Micro (5 to 9)
Small (10 to 19)
Small (20 to 49)
Medium-sized (50 to 249)
Large (250+)
Source: UK Business Counts, Office for National Statistics
46
100%
Waveney
4%
4%
Suffolk Coastal
9%
11%
St Edmundsbury
8%
7%
South Norfolk
7%
9%
Norwich
12%
North Norfolk
24%
Employment and
5%
Mid Suffolk
Enterprise Numbers by
8%
King`s Lynn and
4%
New Anglia Local
West Norfolk
5%
6%
Ipswich
Authority Area
4%
9%
Great Yarmouth
12%
2%
3%
Forest Heath
2%
2%
8%
Broadland
6%
6%
4%
Breckland
8%
8%
Babergh
0%
47
Employment
Enterprises
Creative Industries
Skills Supply and
Demand
48
FE Learning
Aims
All data (unless stated otherwise) is sourced from the Department for Education’s Further Education data
In order to present information that is relevant to New Anglia LEPs high performing and underpinning sectors
then we have identified FE and skills provision data split by Sector Lead Body and aligned a best-fit with each
sector.
The Sector Lead Bodies identified as being the most relevant to the Creative Industries sector are: Creative
and Cultural; Creative Media; Business Information Technology and Telecommunication; and Fashion and
Textiles.
However, not all FE and Skills learning aims align with a sector lead body. In fact, on average around two thirds
are classed as unknown. This means that we are basing results here on roughly a third of the data.
Please note that all data is rounded to the nearest 10 and that therefore some figures presented may not add
to the sum totals presented.
49
Creative Industries Sector Learning Aims Delivered to
Domiciled Learners by Sector Lead Body 2012/13
9,690 (4.6%)
443,100 (4.8%)
Total Learners
100%
(% of All Learners)
90%
Fashion & Textiles
80%
4,590
251,500
70%
Business Information Technology &
60%
Telecommunication
50%
1,080
40%
Creative Media
48,800
30%
4,020
20%
142,800
Creative & Cultural
10%
0%
New Anglia
England
50
Creative Industries Sector Learning Aims Delivered to New
Anglia Learners by Sector Lead Body, 2010/11 and 2012/13
6,650
2010/11
2012/13
4,590
4,290
4,020
1,080
920
50
Business Information
Creative & Cultural
Creative Media
Fashion & Textiles
Technology &
Telecommunication
51
Change in Creative Industries Sector Learning Aims
Delivered to Resident Learners by Sector Lead Body
2010/11 - 2012/13
11%
Total inc. Unknown
9%
-19%
Creative Industries
6%
-31%
Business Information Technology &
Telecommunication
6%
-6%
Creative & Cultural
5%
17%
Creative Media
23%
New Anglia National
52
Creative Industries Learning Aims Delivered to New Anglia Residents by
New Anglia Based and External Providers by Sector Lead Body, 2012/13
0%
10%
20%
30%
40%
50%
60%
70%
80%
90%
100%
Creative Industries
7,400
3,010
Business Information Technology &
2,800
1,790
Telecommunication
Creative & Cultural
3,600
420
Creative Media
1,000
80
Fashion & Textiles
-
Total inc. unknown
158,480
52,170
Total with unknown removed
55,340
24,770
New Anglia Provider
External Provider
53
Creative Industries Learning Aims Delivered to New Anglia Learners by
New Anglia Providers by Sector Lead Body, 2010/11 and 2012/13
3,600
3,260
2,800
2010/ 11
2012/13
2,110
1,000
870
310
-
Business Information
Creative & Cultural
Creative Media
Fashion & Textiles
Technology &
Telecommunication
54
Change in Creative Industries Learning Aims Delivered to Resident
Learners by Domiciled Providers by Sector Lead Body, 2010/11 - 2012/13
5%
Total inc. Unknown
9%
-38%
Total not inc. Unknown
7%
13%
Creative Industries
7%
-14%
Business Information Technology & Telecommunication
6%
71%
Creative & Cultural
5%
15%
Creative Media
23%
New Anglia National
55
Apprenticeships
Apprenticeship Starts by Creative Industries
Related Framework
Apprenticeship Framework
2011/12
2012/13
2013/14
2014/15
2015/16
2016/17
2017/18
Broadcasting Technology
-
-
-
-
-
-
-
Community Arts
-
5
5
5
-
-
-
Creative and Digital Media
-
10
5
5
10
-
-
Cultural and Heirtage Venue Operation
-
-
-
-
-
-
-
Design
5
5
-
-
-
-
-
Digital Learning Design
-
-
-
-
-
-
-
Fashion and Textiles
-
-
-
-
-
-
-
Furniture, Furnishing and Interiors Manufacturing
-
-
-
-
10
10
-
Glass Industry
-
-
-
-
30
60
30
IT Application Specialist
165
120
60
65
70
30
20
IT, Software, Web & Telecoms Professional
100
120
120
170
180
130
170
Jewellery, Silversmithing and Allied Trades
-
-
-
-
-
-
-
Journalism
-
-
5
5
-
-
-
Live Events and Promotion
5
-
-
5
-
-
-
Marketing
15
25
25
15
20
20
10
Photo Imaging
-
-
-
-
-
-
-
Public Relations
-
-
-
-
-
-
-
Social Media and Digital Marketing
-
-
5
35
50
40
20
Technical Theatre, Lighting, Sound & Stage
-
-
-
-
-
-
-
Total
290
285
225
305
370
290
250
56
South East
715
Higher
STUDY 2010/11 - 2014/15
London
365
Education
GCGP
290
2,690
Hertfordshire
160
grew up outside New Anglia and
South East Midlands
150
studied Creative Industries
Greater Lincolnshire
110
subjects in New Anglia
Coast to Capital
65
Top 10 Origins of
Students Coming to
D2N2
55
New Anglia and
Leicester and Leicestershire
55
Studying Creative
Enterprise M3
30
Industries Subjects
London
1,425
9,740
South East
630
grew up in New Anglia and
studied Creative Industries
GCGP
525
subjects in England
Greater Lincolnshire
445
D2N2
380
Leeds City Region
335
Top 10 Destinations
6,730
Leicester and Leicestershire
265
for Students
Solent
225
Growing Up in New
(69%)
Anglia and Studying
Coast to Capital
220
Creative Industries
left and studied outside
West of England
215
Subjects Elsewhere
New Anglia
Total studied Creative Industries
Over the period 2010/11 - 2014/15
subjects in New Anglia
inclusive, New Anglia had a net flow of
students studying Creative Industries
subjects of
5,705
of which 47% came
-4,035
57
from outside New Anglia
New Anglia
1455
EMPLOYMENT 2010/11 - 2014/15
South East
255
London
225
1,820
Greater Lincolnshire
155
studied Creative Industries subjects
GCGP
150
outside New Anglia and subsequently
D2N2
105
found employment in New Anglia
Top 10 Origins of
Leicester and Leicestershire
70
Students Studying
Creative Industries
Leeds City Region
65
Subjects (and
Solent
65
Securing Employment
Coast to Capital
40
in New Anglia
Enterprise M3
35
2,620
New Anglia
1455
studied Creative Industries
London
440
subjects in New Anglia and
South East
200
subsequently secured
GCGP
125
employment in England
Hertfordshire
35
Coast to Capital
25
Greater Lincolnshire
20
1,160
Top 10 Employment
South East Midlands
20
Destinations for
Students Studying
(44%)
Heart of the South West
15
Creative Industries in
left and found
Leeds City Region
15
New Anglia
employment outside
Leicester and Leicestershire
15
New Anglia
Total studied Creative Industries
Over the period 2010/11 - 2014/15
subjects and employed in New Anglia
inclusive, New Anglia had a net flow of
workers who studied Creative
Industries subjects of
3,275
of which 56% came
+655
from outside New Anglia
58
Creative
New
New
COMPARATORS
Industries
National
Anglia
Anglia
Subjects
Stay for study and employment
55.6%
87.6%
27.3%
29.3%
Leave for study, return for employment
30.2%
30.4%
Leave for study, do not return
38.7%
34.3%
Stay for study, leave for employment
44.4%
12.4%
3.9%
6.0%
NOTES ON DATA SOURCES & METHODOLOGY
- The data presented here is from the population of England-domiciled students who studied for a first degree at an English higher education
provider between the academic years 2010-11 and 2014-15 inclusive. Data comes from the Higher Education Statistics Agency (HESA) Student
Record, the Education and Skills Funding Agency’s Individualised Student Record (ILR) data and the Destinations of Leavers from Higher Education
(DLHE) survey.
12%
- Creative Industries subjects defined here as ‘Architecture, building and planning’, ‘Computer Science’, ‘Creative arts and design’, and ‘Media
Studies’
- Numbers are Full Person Equivalents. This is because individuals can be taught through collaborative arrangements at two (or more) institutions.
In order to count provision against both institutions, student counts have been divided between teaching institutions in proportion to the percentage
of time taught at each.
- Data presented on mobility between home and study, where ‘home’ refers to the domicile of a student before they go to university, is for the
population of students who entered higher education between 2010-11 and 2014-15 and who have a valid postcode for both home and study. This is
taken from the HESA Student Record and the ILR. The total FPE for this population was 1,817,855.
- Data using employment location is restricted to students who left higher education between 2010-11 and 2014-15 and who provided a valid full or
partial employment postcode in response to the DLHE survey. The total FPE for this population was 710,800.
- Because these two populations differ significantly means that we are unable to make direct comparisons between the two i.e. calculate the true
59
retention of students, and movements into employment, for an area.
Labour Insight
Jobs
The following section presents data from Labour Insight, a Burning Glass analytical tool. This tool collects details
of online job postings from multiple sources and enables the analysis of these postings based on specific skills,
educational requirements, and job titles, for example.
Please note that whilst Labour Insight will capture more information on the jobs market than more traditional
Department for Work and Pensions vacancy data, the fact that not all job vacancies are advertised means that
there will still be gaps in the findings.
In terms of Creative Industries occupations then, according to the Labour Insight Jobs tool, there were 80,730
postings for the sector in New Anglia between Jan. 1, 2012 and Dec. 31, 2018.
The Standard Occupational Classification codes used to capture this Creative Industries recruitment activity are
those set out by the Department for Culture, Media and Sport and are detailed in the Appendices on page 93.
60
Burning Glass Labour Market Analysis of Creative Industries
Occupations for Year Ending 30th November 2018
Rank Work Area
Job Postings Job Postings per 1,000 employed Location Quotient
1
London
330,619
77
Much higher demand than average
2
Cambridge
19,536
53
Higher demand than average
3
Bristol
20,207
47
Higher demand than average
6
Birmingham
31,676
43
Average demand
13
Manchester
41,266
34
Average demand
14
Brighton
5,642
32
Average demand
41
Ipswich
2,987
18
Much lower demand than average
49
Newcastle
7,896
16
Much lower demand than average
51
Norwich
3,579
16
Much lower demand than average
66
Bury St Edmunds
956
14
Much lower demand than average
130
King's Lynn
360
6
Much lower demand than average
133
Lowestoft
269
5
Much lower demand than average
135
Great Yarmouth
224
5
Much lower demand than average
163
Thetford & Mildenhall
208
3
Much lower demand than average
214
Cromer & Sheringham
21
1
Much lower demand than average
61
2%
16%
Postgraduate Degrees, Level 5
Certificates/Diplomas, Level 5 S/NVQs
Bachelor's Degrees, Graduate
Certificates/Diplomas
10%
Education (minimum
Foundation Degrees, HNDs
advertised) for Creative
Industries Occupations
2012 - 2018
HNCs, Level 4 Certificates/Diplomas, Level 4
5%
S/NVQs
2%
64%
A-Levels, Highers, Level 3 S/NVQs
GCSEs, Standard Grades, Level 2 S/NVQs
62
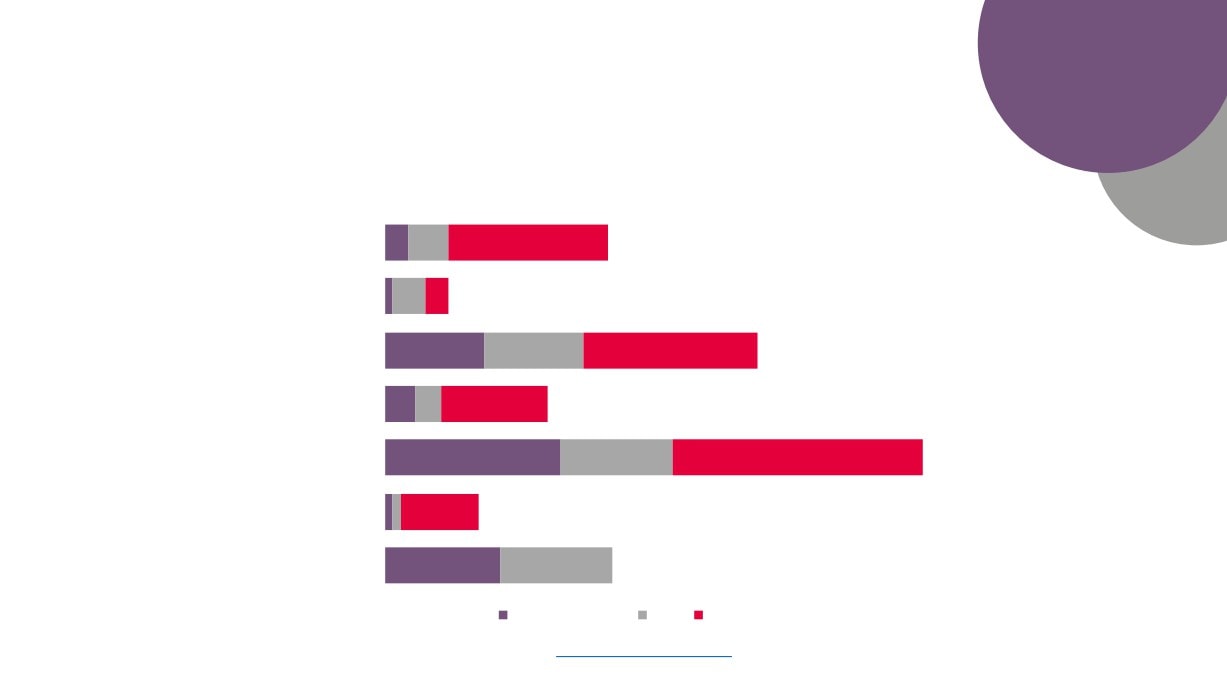
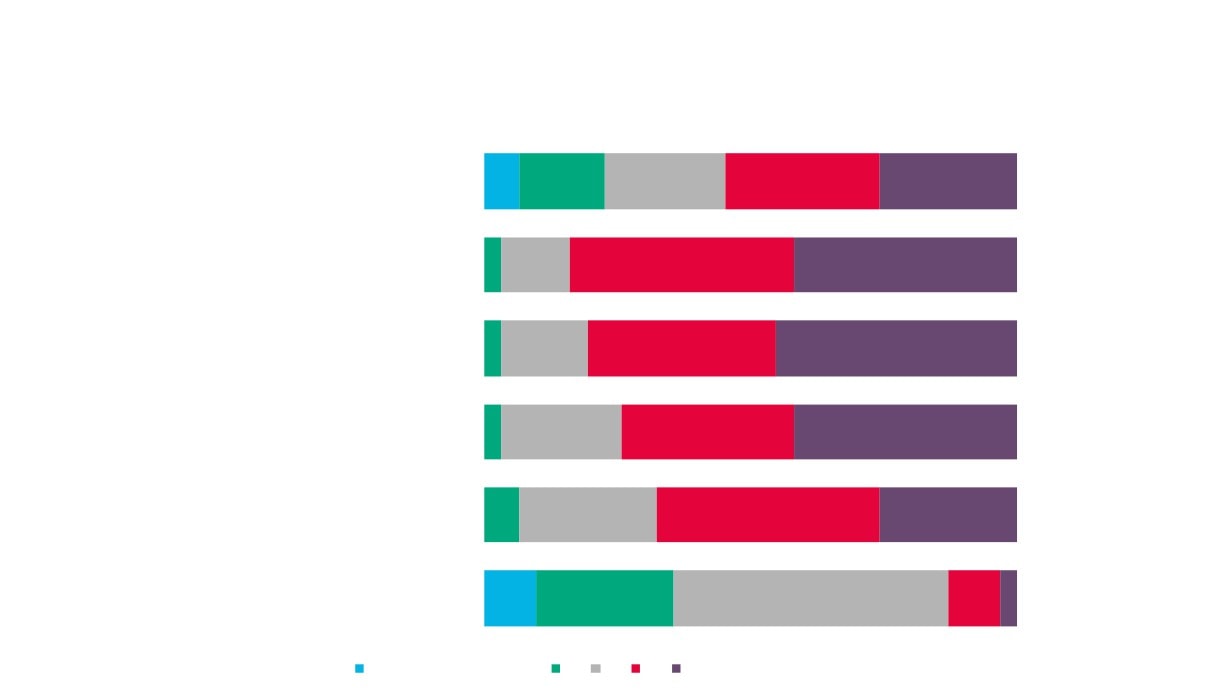
Education (minimum advertised) for Creative Industries (Sub
Sectors) Occupations in New Anglia, 2012 - 2018
0%
50%
100%
Creative Industries
64%
5%
10%
16%
Advertising & Marketing
65%
3%
9%
20%
Architecture
43%
4%
32%
10%
9%
Crafts
4%
36%
9%
10%
36%
Design
61%
7%
6%
5%
19%
Film
6%
32%
13%
8%
27%
15%
IT
70%
5%
10%
11%
Performing Arts
9%
26%
4% 3%
15%
43%
Publishing
66%
5%
18%
9%
Postgraduate Degrees, Level 5 Certificates/Diplomas, Level 5 S/NVQs
Bachelor's Degrees, Graduate Certificates/Diplomas
Foundation Degrees, HNDs
HNCs, Level 4 Certificates/Diplomas, Level 4 S/NVQs
A-Levels, Highers, Level 3 S/NVQs
GCSEs, Standard Grades, Level 2 S/NVQs
Level 1 S/NVQs
63
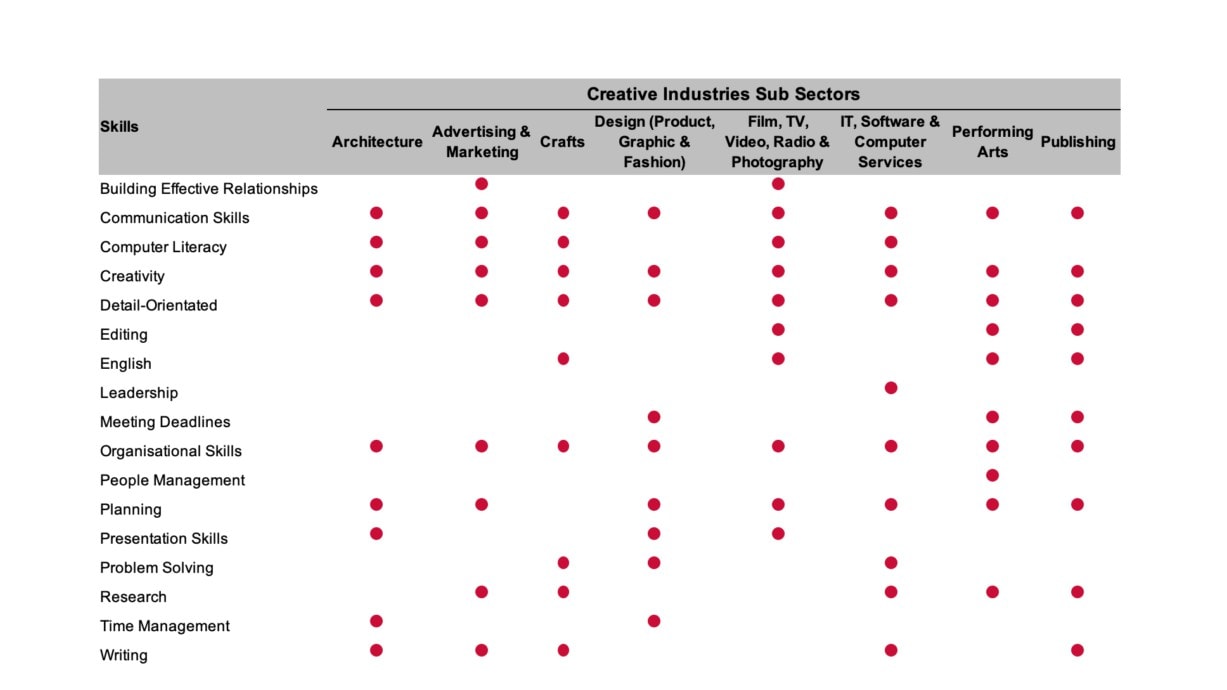
Top 20 ‘Core’ Skills for Creative
Top 20 ‘Specialised’ Skills for Creative
Industries Occupations 2018
Industries Occupations 2018
Skills
Job Postings
Skills
Job Postings
Communication Skills
2,125
Microsoft C#
1,575
Creativity
1,625
SQL
1,538
Planning
1,175
JavaScript
1,492
Organisational Skills
962
Software Development
1,391
Writing
954
Marketing
1,196
Detail-Orientated
787
.NET
1,151
Problem Solving
780
Teamwork / Collaboration
1,134
Microsoft Excel
631
Sales
979
Research
556
Social Media
914
Building Effective Relationships
526
Web Development
903
Microsoft Office
423
Budgeting
876
Leadership
422
Active Server Pages (ASP)
702
Meeting Deadlines
340
Business Development
656
Time Management
324
Software Engineering
655
Editing
320
jQuery
645
Presentation Skills
318
Java
636
English
298
SQL Server
610
Mentoring
265
ASP.NET
597
Energetic
247
Customer Service
594
Troubleshooting
219
Hypertext Preprocessor (PHP)
584
64
Top 5 ‘Specialised’ Skills by Creative Industries Sub Sector 2012 - 2018
Skills
Job Postings
Skills
Job Postings
Film, TV, Video,
Photography
225
Advertising and
Marketing
1,106
Radio and
Sales
853
Music
93
Marketing
Social Media
744
Adobe Photoshop
76
Photography
Occupations
Business Development
602
Customer Service
56
Occupations
Sales Management
506
Teamwork / Collaboration
53
Budgeting
496
Teaching
52
Skills
Job Postings
Skills
Job Postings
AutoCADto-Business
891
SQLs
11,762
IT, Software and
Revitwork / Collaboration
445
Microsoft C#
11,070
Architecture
Computer Services
Project Managementnt
290
JavaScriptesign
11,005
Occupations
.NET
9,947
Occupations
Landscape Architecture
251
SketchUp
239
Software Development
8,912
Web Development
7,785
Adobe Photoshop
189
Skills
Job Postings
Skills
Job Postings
Adobe Photoshop
169
Paint Sprayer
491
ASP.NET
6,120
Scheduling
165
Performing Arts
Cabinetry
190
Teachinger
9
5,916
Project Architecture
161
Painting
187
Singing
5
Occupations
Craft Occupations
5,716
Adobe Indesign
126
Teamwork / Collaboration
186
Adobe Indesign
143
Automotive Painting
179
Music
113
Customer Service
91
Skills
Job Postings
Skills
Job Postings
Design Occupations
Graphic Design
720
Journalism
296
Publishing
Adobe Photoshop
631
Social Media
254
(Product, Graphic
Adobe Indesignment
501
Copy Writing
199
Occupations
and Fashion)
Adobe Acrobat
341
Customer Service
174
Adobe Illustrator
328
Technical Writing / Editing
125
65
Adobe Creative Suite
326
Top 10(ish) ‘Core’ Skills 2012 - 2018
66
Where the
Work is
The following analysis makes use of data and findings available via the online toolkit http://wheretheworkis.org/ . The findings presented
are a result of combining data from the UKCES ‘Working Futures’ programme and job vacancy data from the Labour Market Insight tool
developed by Burning Glass.
Limitations
Though the ‘Where the work is’ tool provides a comprehensive and detailed free-to-use dashboard of supply and demand in the UK, the
following limitations should be taken into account when interpreting the data:
- Senior Management and Elementary roles
Occupations not open to recent HR graduates or FE finishers are not considered. Similarly, occupations that do not require any formal
qualifications or training are also excluded from this tool, since the number of job-seekers cannot be meaningfully quantified.
- Matching supply and demand
Some occupations do not have specific qualifications or subject-specific requirements (such as sales, marketing and related associate
professionals). As a result of this, and despite the fact that many people with a broad range of qualifications can apply for these
occupations, they frequently appear ‘undersupplied’ in the tool, i.e. when the “job opportunity” is low. Occupations with very small sample
sizes (either of finishers or job postings) are excluded from the dataset.
- Internal and international migration
Some occupations do not rely solely on FE finishers or HE graduates from their immediate location. Many people travel to find work, often
moving across the country. Other occupations, such as those on the Migration Advisory Committee’s shortage occupation list, may rely
more heavily on jobseekers arriving from outside the UK.
- Online and offline postings
Burning Glass Technologies (BGT) acknowledge that not all jobs are posted online, although a comparison of the Annual Survey of Hours
and Earnings (ASHE) employment data and BGT postings data for UK in 2014 showed a 94 per cent correlation between ASHE and BGT
occupational distributions. The BGT posting data slightly overestimate the proportion of professional and associate professional
occupations, while slightly underestimating the proportion of elementary occupations.
67
Location
Location Quotient - Measure of Job Posting
Quotient
Density relative to employment indexed to the
national density relative to employment
Architects/Surveyors
0.76
Architectural Techs
1.10
Artistic/Media Occs
0.57
Design Occs
0.71
IT Techs
0.57
Media Profnls
0.45
Printing Trades
2.69
Textiles Trades
0.91
68
Vacancies by
Number of Job Postings asking for entry-level
Opportunity
(2 years of experience or fewer) and school
leaver education levels, further education
levels, and higher education levels
Architects/Surveyors
37
69
271
Architectural Techs
56
38
Artistic/Media Occs
167
167
295
Design Occs
50
45
180
IT Techs
295
190
423
Media Profnls
133
Printing Trades
194
190
School leaver
FE HE
69
Average
Advertised Salaries for Job Postings in 2015
Wages
£41,800
Architects/Surveyors
£45,800
£53,500
£31,200
Architectural Techs
£40,200
£49,400
£37,900
Artistic/Media Occs
£39,500
£47,100
£38,800
Design Occs
£41,900
£47,300
£30,100
IT Techs
£35,200
£38,800
£29,400
Media Profnls
£37,000
£44,100
£31,000
Printing Trades
£29,300
£42,400
£25,800
Textiles Trades
£27,600
£38,200
New Anglia
East of England
England
70
Opportunity Score - Score based on the Demand Opportunity
Supply Ratio of FE / HE postings within a
Scores
geography, from Very Low (0) to Very High (100)
Further Education
Higher Education
42
Architects/Surveyors
51
Architects/Surveyors
99
94
51
40
Architectural Techs
61
Architectural Techs
95
61
49
56
28
75
Artistic/Media Occs
36
Artistic/Media Occs
82
45
80
57
Design Occs
22
Design Occs
79
19
67
48
IT Techs
61
IT Techs
99
56
99
61
56
Media Profnls
58
Media Profnls
99
66
94
58
83
66
Printing Trades
Printin79Trades
70
83
79
75
70
Textiles Trades
Textiles Trades
79
94
71
and
New Anglia
East of England
England
New Anglia
East of England
England
A Future View of the
Creative Industries
Sector
72
Forecasting
Models
The following analysis uses data from the East of England Forecasting Model (EEFM) and the UKCES Working Futures
data (WF). In previous data analysis for other New Anglia LEP key sectors then we have been able to approximate their
workforces using the sector breakouts provided by the models. Unfortunately, given the sub sector and cross cutting
nature of the Creative Industries sector across multiple broad sectors, then this level of analysis has not been possible
for the Creative Industries sector.
Instead, we present in this section the results for each of the sub sectors that captures Creative Industries activity. In
the case of the East of England Forecasting Model then results for ‘Computer Related Activity’ and ‘Publishing and
Broadcasting’ and ‘Arts and Entertainment’ are shown. For the Working Futures data, results are presented for the
sectors of ‘Media’, “Information Technology’ and ‘Arts and Entertainment’. It should be noted that these sub sectors
have not been totalled to create results for the Creative Industries sector as the resulting numbers are much higher than
those seen for the sector.
Please also note that neither model, or the projections they produce, take into account the New Anglia LEPs ambitions
for growth in Gross Value Added (GVA) and employment.
73
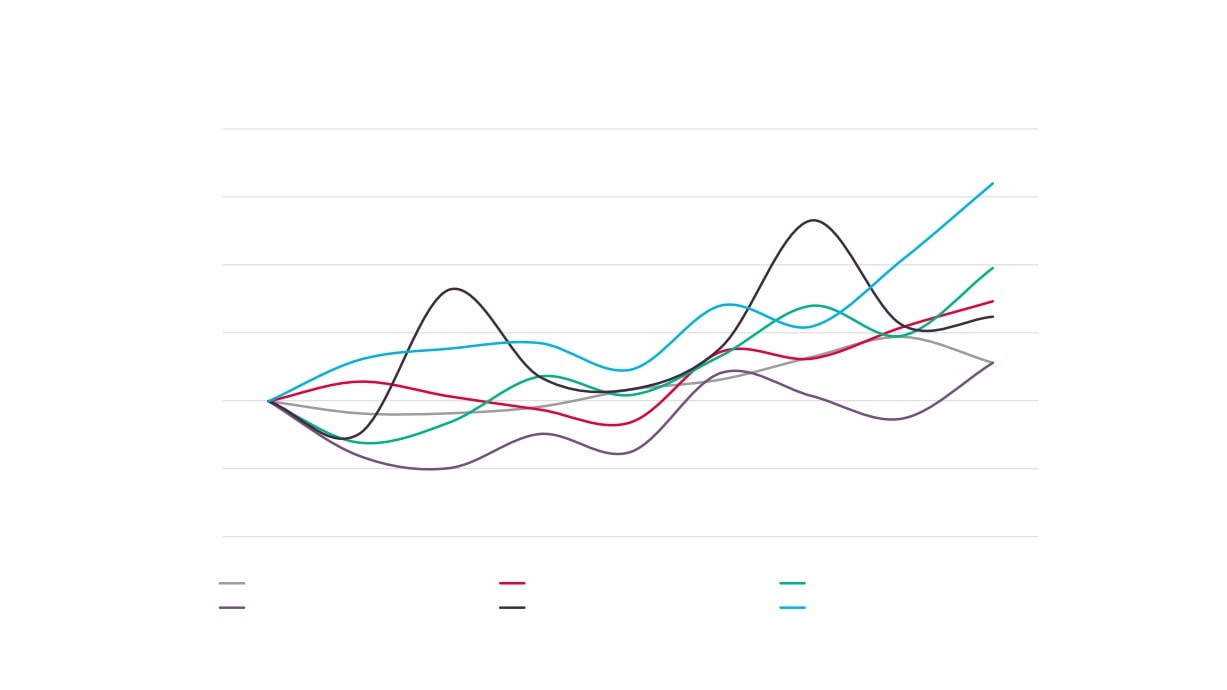
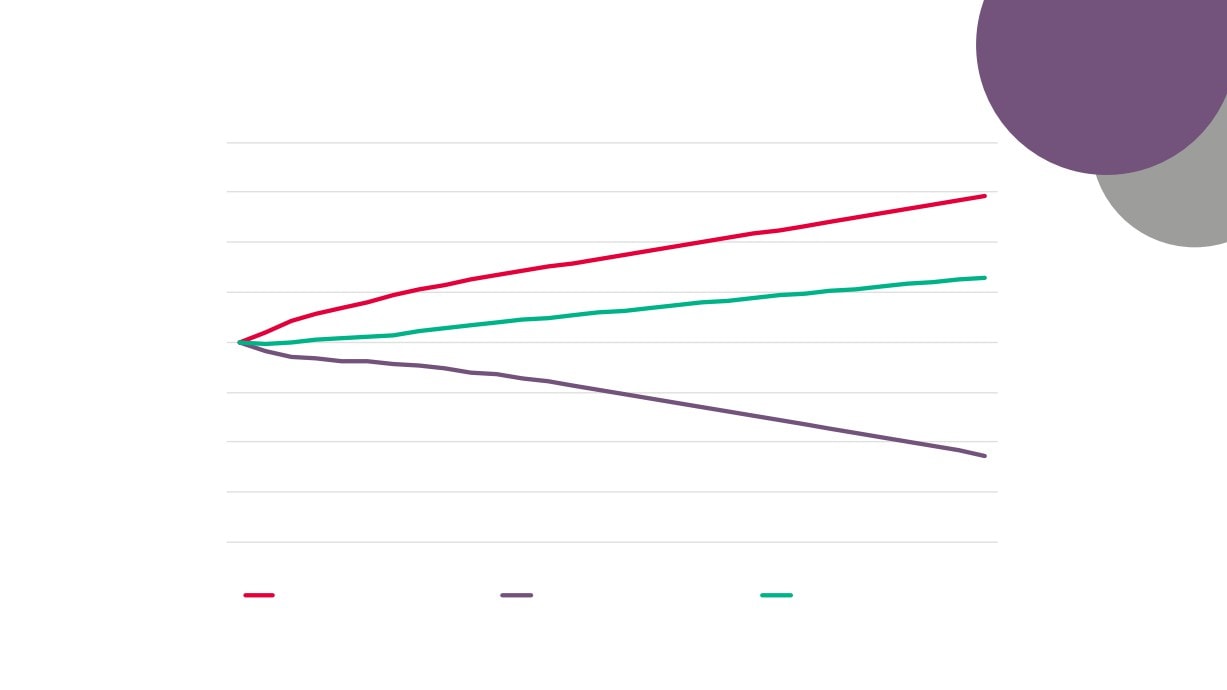
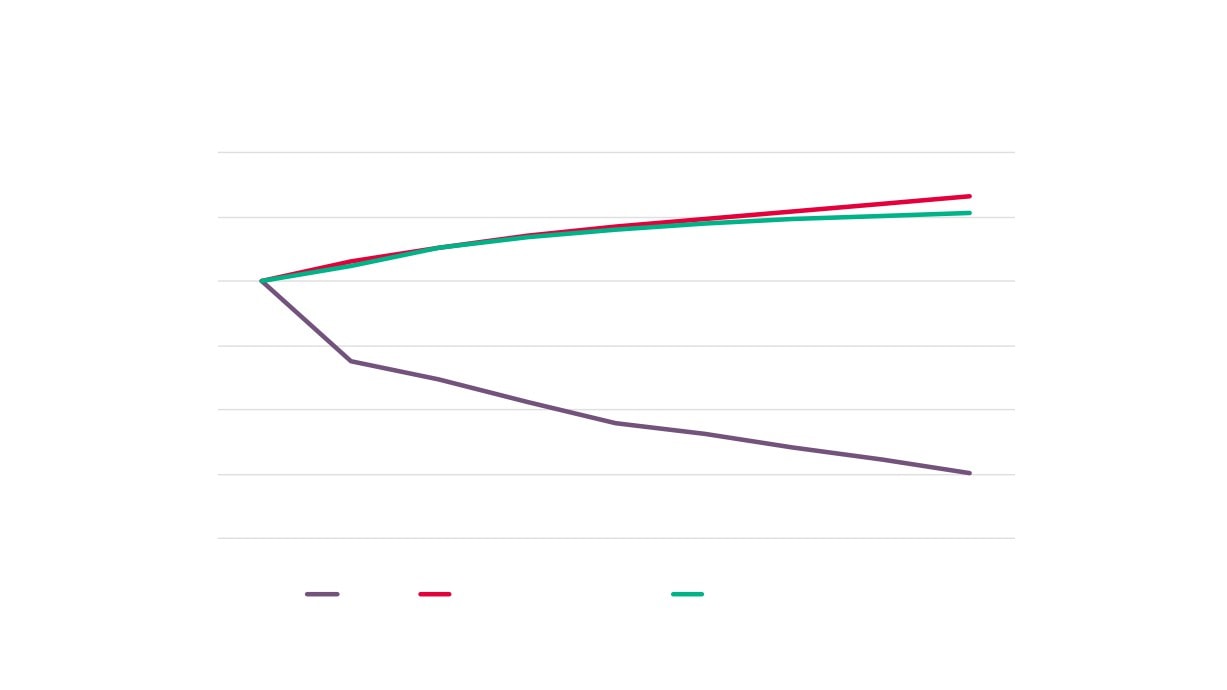
Employment
Employment Projections Index (2016 = 100)
Projections
for Sectoral Elements of Creative Industries
140
130
120
110
100
90
80
70
60
2016
2020
2024
2028
2032
2036
2040
2044
Computer Related Activity
Publishing & Broadcasting
Arts & Entertainment
Source: East of England Forecasting Model
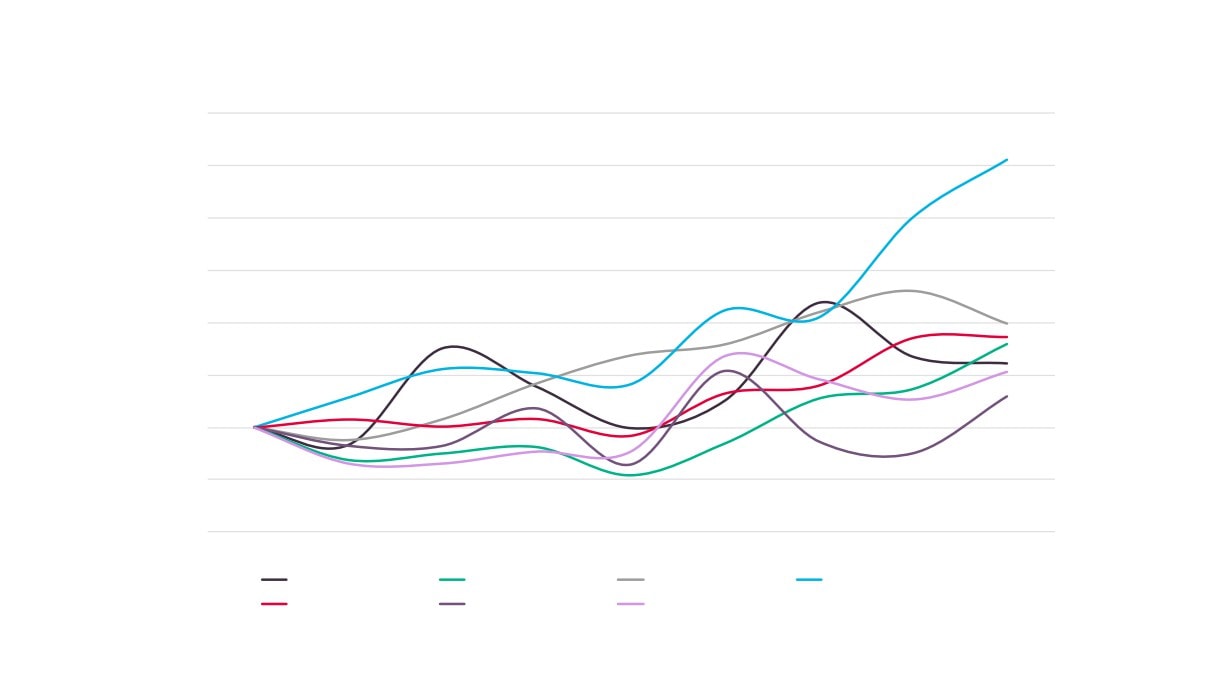
74
Employment Projections Index (2016 = 100) for
Sectoral Elements of Creative Industries
110
105
100
95
90
85
80
2016
2017
2018
2019
2020
2021
2022
2023
2024
Media
Information Technology
Arts and Entertainment
Source: Working Futures 2014 - 2024, UK Commission for Employment and Skills
75
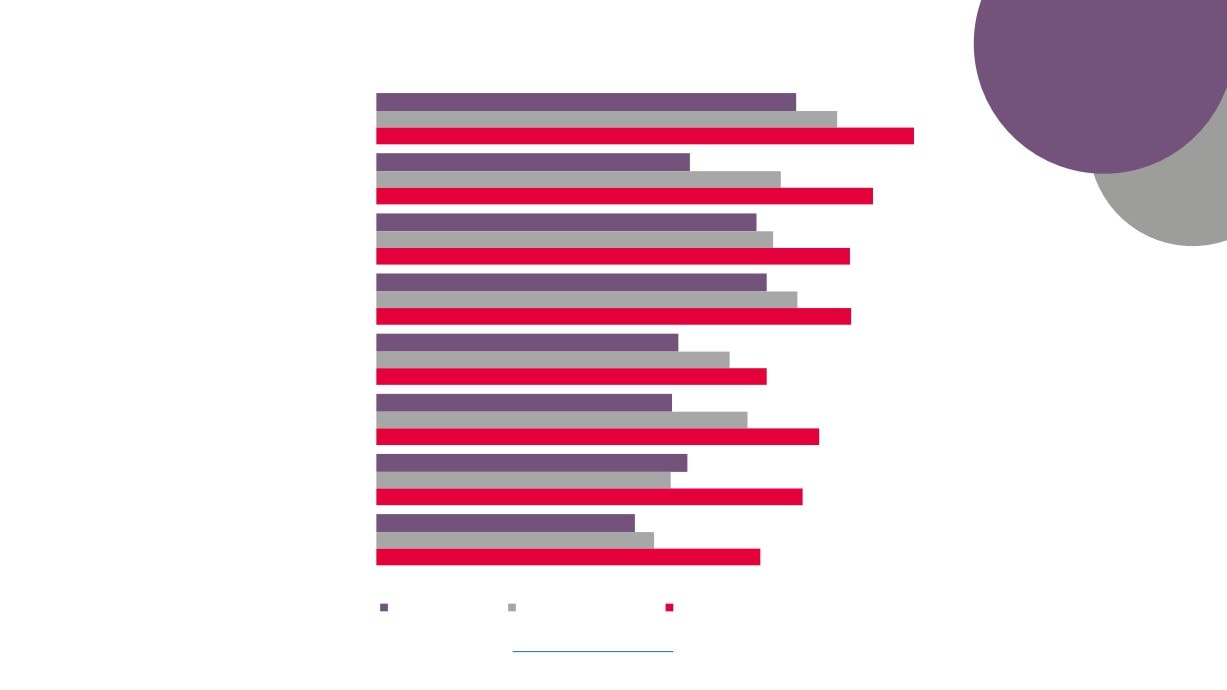
Qualification
2024
15%
48%
15%
14%
6%
Projections
Media
2014
12%
39%
18%
17%
10%
4%
0%
QCF 7-8
QCF 4-6
QCF 3
QCF 2
QCF 1
No Qual
100%
Shifts in
2024
16%
56%
9%
9%
8%
Qualifications for
Information
Sectoral Elements of
Technology
2014
13%
46%
15%
13%
10%
Creative Industries
Source: Working Futures 2014 - 2024, UK
0%
QCF 7-8
QCF 4-6
QCF 3
QCF 2
QCF 1
No Qual
100%
Commission for Employment and Skills
2024
11%
46%
18%
18%
5%
Arts and
Entertainment
2014
9%
34%
21%
22%
10%
4%
76
0%
QCF 7-8
QCF 4-6
QCF 3
QCF 2
QCF 1
No Qual
100%
11%
12%
16%
17%
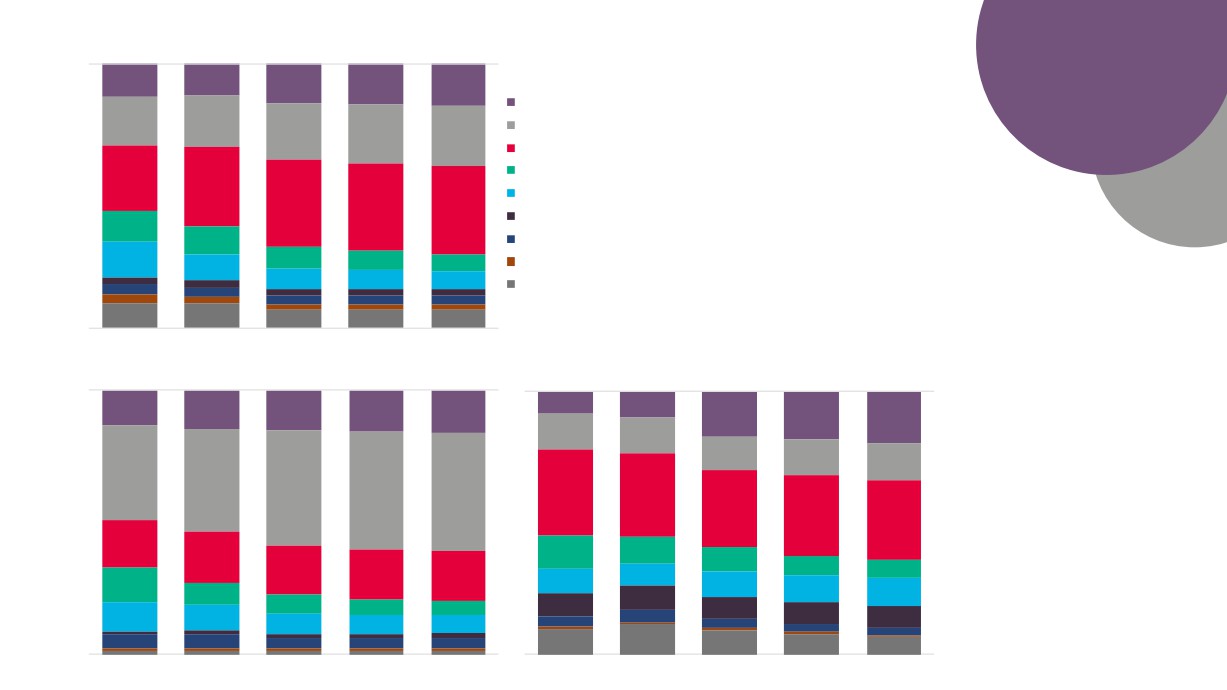
18%
Occupation
20%
0%
22%
24%
24%
24%
24%
Projections
Managers, directors and senior officials
40%
Professional occupations
26%
27%
Associate professional and technical
26%
27%
27%
60%
Administrative and secretarial
13%
10%
Skilled trades occupations
Shifts in
8%
7%
6%
Caring, leisure and other service
10%
9%
80%
9%
9%
9%
Sales and customer service
Occupations for
4%
5%
4%
Process, plant and machine operatives
3%
3%
7%
7%
6%
6%
5%
100%
Elementary occupations
Sectoral Elements of
100%
Creative Industries
Source: Working Futures
19
2024
2014 - 2024, UK Commission
0%
for Employment and Skills
13%
14%
15%
15%
16%
17%
18%
20%
14%
14%
13%
14%
14%
36%
39%
44%
45%
45%
33%
32%
29%
30%
31%
18%
13%
10%
19%
9%
8%
19%
6%
19%
19%
8%
13%
9%
9%
10%
8%
11%
9%
7%
9%
6%
6%
8%
8%
11%
10%
4%
8%
8%
7%
7%
4%
4%
3%
3%
5%
5%
4%
4%
4%
10%
12%
9%
8%
7%
100%
100%
77
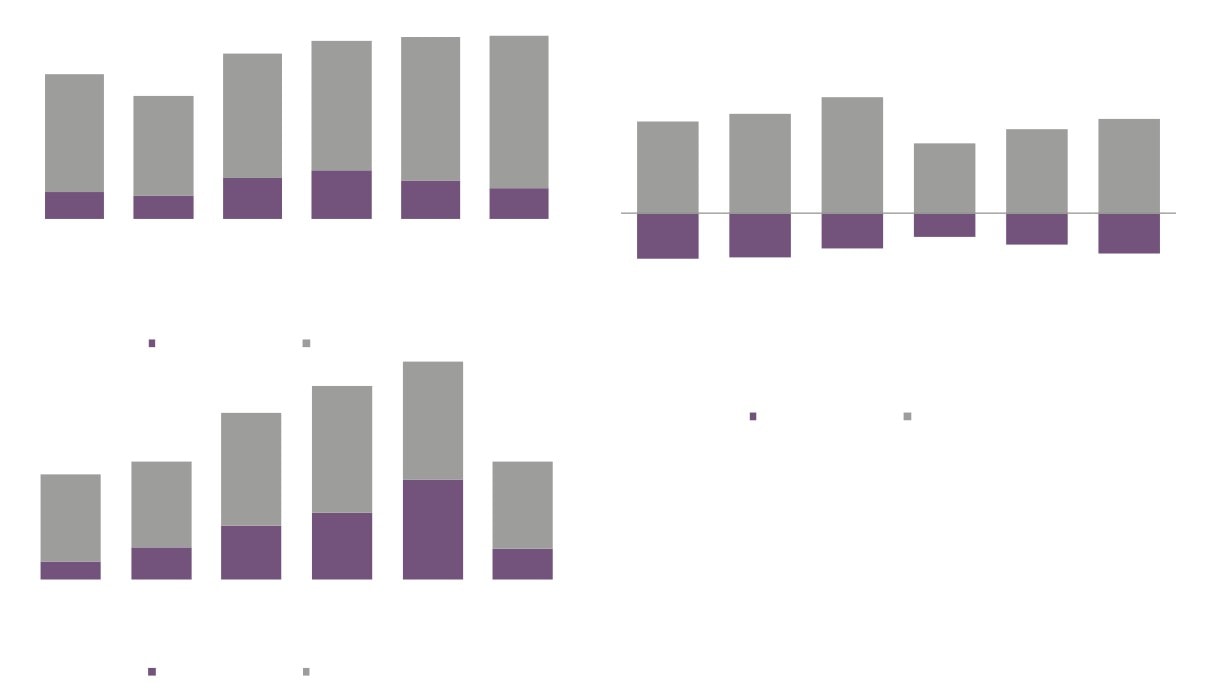
Information Technology
Arts & Entertainment
Information
Technology
Media
38%
42%
45%
37%
35%
30%
44%
35%
38%
36%
32%
27%
14%
12%
11%
8%
9%
6%
-9%
-12%
All
21 Science,
11 Corporate
35 Business
24 Business,
41
-17%
-17%
-13%
-15%
occupations research,
managers
and public
media and
Administrative
engineering
and directors
service
public service
occupations
and
associate
professionals
technology
professionals
All
34 Culture,
12 Other
21 Science,
11 Corporate
24 Business,
professionals
occupations
media and
managers and
research,
managers and
media and
sports
proprietors
engineering
directors
public service
occupations
and
professionals
technology
professionals
Arts &
Expansion demand
Replacement demand
Entertainment
60%
64%
57%
Expansion and Replacement
44%
44%
Demand as a Proportion of Current
44%
50%
34%
27%
Workforce by Sectoral Elements of
16%
15%
9%
All
34 Culture,
12 Other
51 Skilled
54 Textiles,
24 Business,
Creative Industries
occupations media and
managers and
agricultural
printing and
media and
sports
proprietors
and related
other skilled
public service
Source: Working Futures 2014 - 2024, UK Commission for
occupations
trades
trades
professionals
Employment and Skills
78
Expansion demand
Replacement demand
Results from the Creative
Industries Sector Skills
Planning Survey
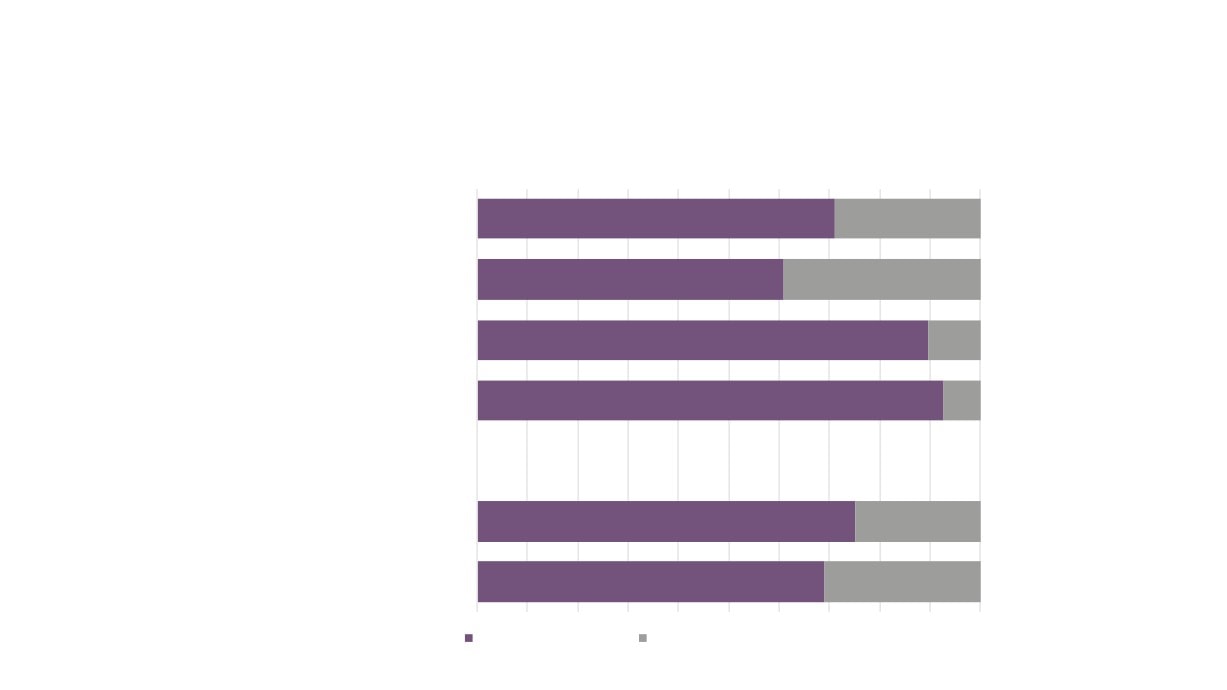
79
Does the local education and
32%
skills 'system' as a whole
(including schools, universities,
colleges, independent training
providers) meet
your business
needs?
68%
31 responses
No
Yes
80
Yes - Both immediate and longer term business
13%
needs
Is there a
significant gap
Yes - in terms of longer term business needs
between your
26%
only
current
employee skills
Yes - in terms of immediate business needs only
23%
base and the
skills needed
to meet your
No
35%
business
needs?
31 responses
Don't know
3%
81
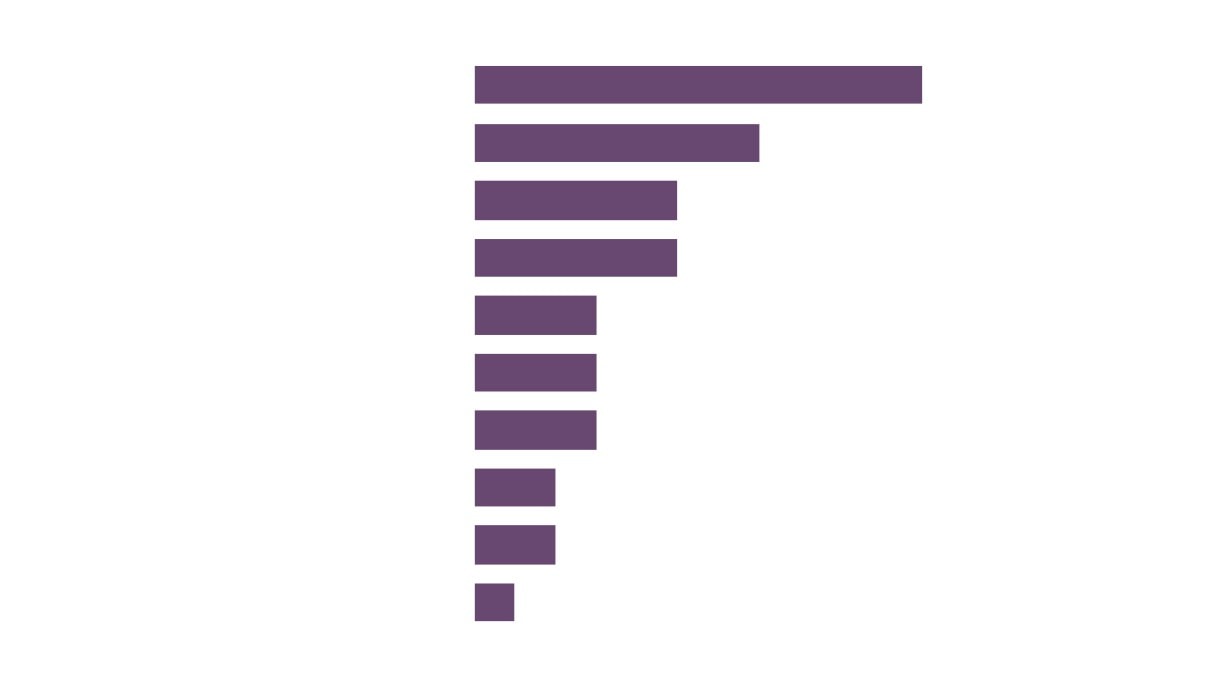
Creative business skills
26%
Designers
17%
UI/UX skills
12%
Film and TV production skills
12%
Web / Front End Developers
7%
Please provide details
Experience
7%
of any skills gaps within
your current workforce
Marketing / Branding Skills
7%
42 responses
NA
5%
Data
5%
Coders
2%
82
On a scale of 1 to 5, with 1 being 'not important at all' to 5 being 'very
important', how important are the following to the local Creative
Industries sector? 31 responses
Apprenticeships
6%
16%
23%
29%
26%
Under/graduate placements and internships
3%
13%
42%
42%
New and recent graduate employees 3%
16%
35%
45%
Training for existing workforce
3%
23%
32%
42%
Leadership/management development
6%
26%
42%
26%
Formal qualifications
10%
26%
52%
10% 3%
83
1 - Not important at all
2
3
4
5 - Very important
Creative Business skills
16%
Film / TV skills
12%
Other
9%
UI / UX skills
7%
Production Skills
7%
Personal Skills
7%
SFX Skills
6%
Which three skills (specific to the
Programmers
6%
Creative Industries sector) do you
Marketing
6%
expect to see the largest increase in
Designers
4%
skills demand over the next 10 years?
Finance Skills
4%
68 responses
Editing Skills
4%
Developer Skills
4%
Digital Skills
3%
AI / VR Skills
3%
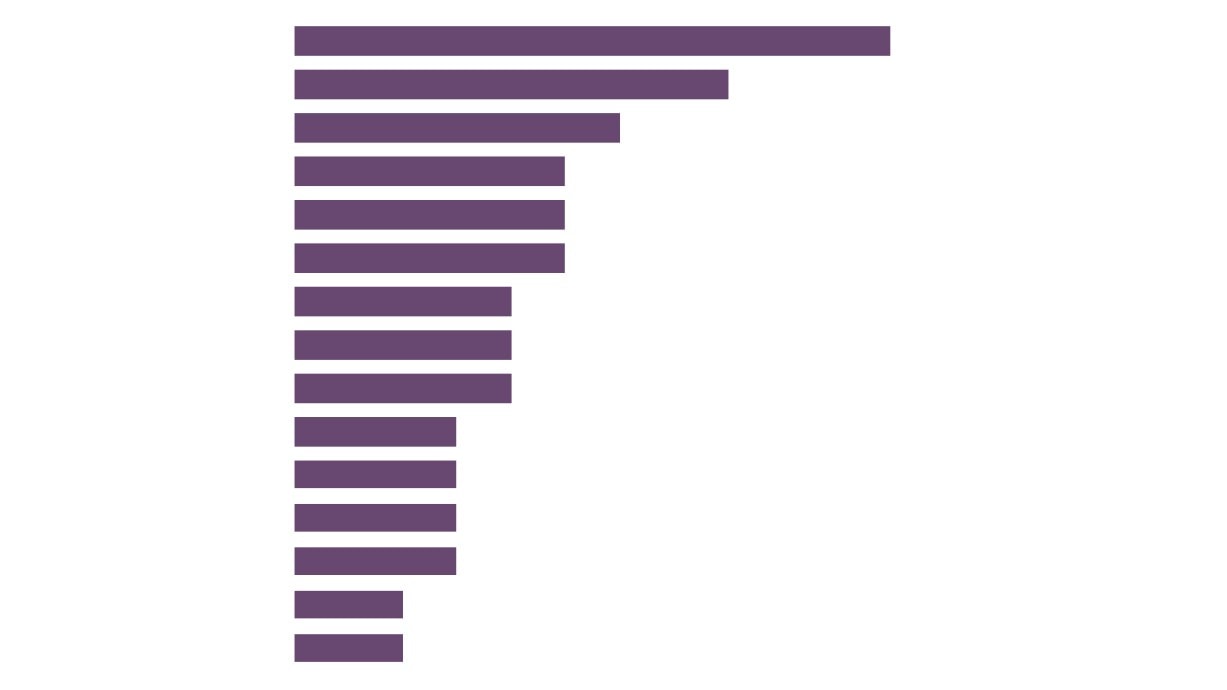
84
Production roles
17%
Developer roles
17%
Other
12%
On Set roles
10%
Senior business roles
10%
Design roles
7%
Which jobs, if any, do you find it
Editor roles
7%
most difficult to recruit to?
Marketing
5%
41 responses
Programmers
5%
SFX roles
5%
N/A
2%
Finance
2%
85
Local leadership / Ambition
21%
Funding
21%
Other
18%
Geography
12%
Skills
9%
What is the main threat to
London
6%
growth of the Creative Industries
sector in Norfolk and Suffolk?
Image
6%
33 responses
Brexit
6%
86
Which of the Creative Industries sub sectors (self
defined) best describes your business? 31 responses
Performing arts and
heritage (17%)
Film, TV and video
production (17%)
Audio-Visual
Advertising /
(13%)
PR (13%)
Software / Multi-media
Multiple Sub-
Library service
Design (17%)
(13%)
sectors (7%)
(3%)
87
How many people do you employ in Norfolk and Suffolk? 31 responses
10-49 employees (27%)
250+
employees
1-9 employees (63%)
50-249 employees (7%)
(3%)
88
How long has the business been trading? 31 responses
35%
45%
19%
0%
50%
100%
Up to 5 years
5 - 20 years
More than 20 years
89
Creative Industries / Plus Sector Definition
The Standard Industrial Classification (SIC) codes detailed below are those used by the Department for Culture, Media and Sport to define the
Creative Industries sector. These same SIC codes are used to form the basis of the New Anglia ‘Creative Industries’ sector definition but with
those highlighted in red removed.
70210 : Public relations and communication activities
58110 : Book publishing
73110 : Advertising agencies
58120 : Publishing of directories and mailing lists
73120 : Media representation
58130 : Publishing of newspapers
71111 : Architectural activities
58141 : Publishing of learned journals
32120 : Manufacture of jewellery and related articles
58142 : Publishing of consumer, business and professional journals and periodicals
59111 : Motion picture production activities
58190 : Other publishing activities
59112 : Video production activities
58210 : Publishing of computer games
59113 : Television programme production activities
58290 : Other software publishing
59120 : Motion picture, video and television programme post-production activities
74100 : Specialised design activities
59131 : Motion picture distribution activities
74201 : Portrait photographic activities
59132 : Video distribution activities
74202 : Other specialist photography (not including portrait photography)
59133 : Television programme distribution activities
74203 : Film processing
59140 : Motion picture projection activities
74209 : Other photographic activities (not including portrait and other specialist
59200 : Sound recording and music publishing activities
photography and film processing) nec
60100 : Radio broadcasting
74300 : Translation and interpretation activities
60200 : Television programming and broadcasting activities
91011 : Library activities
62011 : Ready-made interactive leisure and entertainment software development
91012 : Archive activities
62012 : Business and domestic software development
91020 : Museum activities
62020 : Computer consultancy activities
85520 : Cultural education
90010 : Performing arts
90020 : Support activities to performing arts
90030 : Artistic creation
90040 : Operation of arts facilities
91
The following SIC codes, when added to those on the previous page, combine to create a ‘Creative Industries Plus’ sector:
61100 : Wired telecommunications activities
13960 : Manufacture of other technical and industrial textiles
61200 : Wireless telecommunications activities
13990 : Manufacture of other textiles nec
78101 : Motion picture, television and other theatrical casting
14110 : Manufacture of leather clothes
18201 : Reproduction of sound recording
14120 : Manufacture of workwear
18202 : Reproduction of video recording
14131 : Manufacture of men's outerwear, other than leather clothes and workwear
18203 : Reproduction of computer media
14132 : Manufacture of women's outerwear, other than leather clothes and workwear
13100 : Preparation and spinning of textile fibres
14141 : Manufacture of men's underwear
13200 : Weaving of textiles
14142 : Manufacture of women's underwear
13300 : Finishing of textiles
14190 : Manufacture of other wearing apparel and accessories
13910 : Manufacture of knitted and crocheted fabrics
14200 : Manufacture of articles of fur
13921 : Manufacture of soft furnishings
14310 : Manufacture of knitted and crocheted hosiery
13922 : Manufacture of canvas goods, sacks etc
14390 : Manufacture of other knitted and crocheted apparel
13923 : Manufacture of household textiles (other than soft furnishings of 13921)
20302 : Manufacture of printing ink
13931 : Manufacture of woven or tufted carpets and rugs
28940 : Manufacture of machinery for textile, apparel and leather production
13939 : Manufacture of carpets and rugs (other than woven or tufted) nec
32130 : Manufacture of imitation jewellery and related articles
13940 : Manufacture of cordage, rope, twine and netting
32200 : Manufacture of musical instruments
13950 : Manufacture of non-wovens and articles made from non-wovens, except
73200 : Market research and public opinion polling
apparel
92
Creative Industries Plus Sub Sectors
These SIC codes have then been grouped to form sub sectors as follows:
Advertising & Marketing
70210 : Public relations and communication activities
73110 : Advertising agencies
73120 : Media representation
73200 : Market research and public opinion polling
Architecture
71111 : Architectural activities
Film, TV, Video, Radio & Photography
59111 : Motion picture production activities
59112 : Video production activities
59113 : Television programme production activities
59120 : Motion picture, video and television programme post-production activities
59131 : Motion picture distribution activities
59132 : Video distribution activities
59133 : Television programme distribution activities
60100 : Radio broadcasting
60200 : Television programming and broadcasting activities
18201 : Reproduction of sound recording
18202 : Reproduction of video recording
74201 : Portrait photographic activities
74202 : Other specialist photography (not including portrait photography)
74203 : Film processing
74209 : Other photographic activities (not including portrait and other specialist photography and film processing) nec
78101 : Motion picture, television and other theatrical casting
93
IT, Software & Computer Services
62011 : Ready-made interactive leisure and entertainment software development
62012 : Business and domestic software development
62020 : Computer consultancy activities
18203 : Reproduction of computer media
61100 : Wired telecommunications activities
61200 : Wireless telecommunications activities
58210 : Publishing of computer games
58290 : Other software publishing
Publishing
58110 : Book publishing
58120 : Publishing of directories and mailing lists
58130 : Publishing of newspapers
58141 : Publishing of learned journals
58142 : Publishing of consumer, business and professional journals and periodicals
58190 : Other publishing activities
Design
74100 : Specialised design activities
Music, Performing & Visual Arts
32200 : Manufacture of musical instruments
59200 : Sound recording and music publishing activities
90030 : Artistic creation
90040 : Operation of arts facilities
94
Textiles
20302 : Manufacture of printing ink
13100 : Preparation and spinning of textile fibres
13200 : Weaving of textiles
13300 : Finishing of textiles
13910 : Manufacture of knitted and crocheted fabrics
13921 : Manufacture of soft furnishings
13922 : Manufacture of canvas goods, sacks etc
13923 : Manufacture of household textiles (other than soft furnishings of 13921)
13931 : Manufacture of woven or tufted carpets and rugs
13939 : Manufacture of carpets and rugs (other than woven or tufted) nec
13940 : Manufacture of cordage, rope, twine and netting
13950 : Manufacture of non-wovens and articles made from non-wovens, except apparel
13960 : Manufacture of other technical and industrial textiles
13990 : Manufacture of other textiles nec
28940 : Manufacture of machinery for textile, apparel and leather production
Fashion
14110 : Manufacture of leather clothes
14120 : Manufacture of workwear
14131 : Manufacture of men's outerwear, other than leather clothes and workwear
14132 : Manufacture of women's outerwear, other than leather clothes and workwear
14141 : Manufacture of men's underwear
14142 : Manufacture of women's underwear
14190 : Manufacture of other wearing apparel and accessories
14200 : Manufacture of articles of fur
14310 : Manufacture of knitted and crocheted hosiery
14390 : Manufacture of other knitted and crocheted apparel
Crafts
32120 : Manufacture of jewellery and related articles
95
32130 : Manufacture of imitation jewellery and related articles
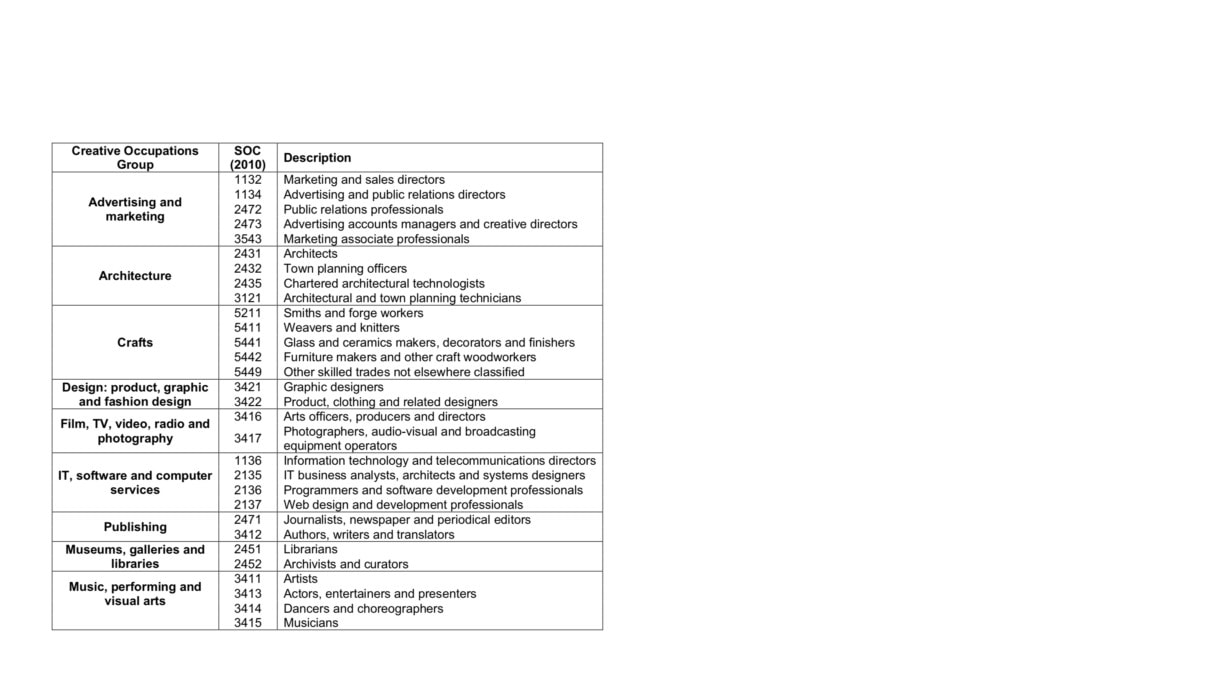
Creative Industries Occupations
The Standard Industrial Classification (SOC) codes detailed below are those used by the Department for Culture, Media and Sport.
96