Clean Energy
Data Pack
Final Version - March 2019
Contents
Introduction to the Sector Data Pack
Page 3
Introduction to and Definition of the Clean Energy Sector
Page 3
Low Carbon & Renewable Energy (LCRE) Sector Definition
Page 4
National LCRE Sector Analysis
Page 7
Norfolk and Suffolk LCRE Sector Estimates
Page 19
Renewable Electricity Statistics Analysis
Page 25
Labour Insight Jobs tool sector analysis
Page 38
A Future View of the LCRE Sector in Norfolk and Suffolk
Page 49
2
Introduction
Introduction to the Sector Data Pack
The role of the Sector Data Pack is to bring together the latest socio-economic and labour market data and present
both an up-to-date, and future view, of the sector and any underlying issues within the area that could impact upon it.
Data is presented in a navigable format without comment with interpretation at this stage mainly left to the reader. In
most instances data has been analysed and presented down to local authority level. In some instances, and even
where local authority data is available, it has not been presented in the data pack due to issues of unreliability and
small sample sizes.
Introduction to the Clean Energy Sector
Defining the Clean Energy sector is particularly difficult given that it is a relatively new sector. As a result, Standard Industrial
Classification (SIC) codes (which do a great job in measuring traditional sectors such as manufacturing and construction) are yet to
catch up and as such do not adequately capture the sectors activity. Activity within the sector can also be hidden due to the fact that
it is not always a firms main operating activity (meaning that it can get recorded against a less suitable SIC code and lost within
official statistics). Further complicating matters is the fact that it also cuts across many traditional sectors.
The Office for National Statistics recognise these issues and to combat this, in recent years they have conducted a national survey
of Low Carbon and Renewable Energy businesses. We have drawn on this source of sector information heavily within this data
pack, with the assumption that national trends in employment and turnover will be broadly reflected at the local level. In addition, we
have used this information to arrive at employment estimates for Norfolk and Suffolk, and a number of comparator areas.
3
LCRE Sector
Definition
Low Carbon & Renewable Energy (LCRE) Sector Definition
• ONS define the low carbon economy as ‘economic activities that deliver goods and
services that generate significantly lower emissions of greenhouse gases; predominantly
carbon dioxide’.
• The low carbon sectors are: offshore wind, onshore wind, solar photovoltaic, hydropower,
other renewable energy, bioenergy, alternative fuels, renewable heat, renewable
combined heat and power, energy efficient lighting, energy efficient products, energy
monitoring, saving or control systems, low carbon financial and advisory services, low
emission vehicles and infrastructure, carbon capture and storage, nuclear power, fuel
cells and energy storage systems.
• These low carbon sectors are then subsequently grouped into six low carbon groups: low
carbon electricity, low carbon heat, energy from waste and biomass, energy efficient
products, low carbon services, and low emission vehicles etc.
4
LCRE Group
LCRE Sector
Offshore wind
Onshore wind
Solar photovoltaic
Hydropower
Low Carbon Electricity
Other renewable electricity
Carbon capture and storage
Nuclear
Renewable heat
Low Carbon Heat
Renewable combined heat and power
Bioenergy
Energy from waste and biomass
Alternative fuels
Energy efficient lighting
Other energy efficient products
Energy efficient products
Energy monitoring, saving or control systems
Low Carbon financial and advisory services
Low Carbon Services
Low emission vehicles and infrastructure
Low emission vehicles, infrastructure,
fuel cells, and energy storage
Fuel cells and energy storage
5
d
3%
3%
Onshore wind
15%
ic
2%
Hydropower
ar
6%
3%
d
2%
Renewable heat
er
5%
4%
Bioenergy
s
Proportions
Energy efficient
13%
LCRE direct
lighting
employment
(FTEs) by L
Group and
sector, 2017
68%
y
47%
s
Source: Office for National
Statistics, Low Carbon and
Renewable Energy Sector
Survey
Energy monitoring, saving
8%
or control systems
al
4%
4%
s
Low emission vehicles
4%
5%
and infrastructure
6
e
National LCRE
Sector Analysis
The following section uses the results from the latest 2017 Low Carbon and Renewable Energy sector (LCRE) business
survey to show the size, shape, and direction of the sector at the national level. This information can be accessed at
The figures provided by this Office for National Statistics (ONS) release are survey-based estimates. Surveys gather
information from a sample rather than from the whole population. The sample is designed to allow for this, and to be as
accurate as possible given practical limitations such as time and cost constraints, but results from sample surveys are
always estimates and not precise figures. This means that they are subject to some uncertainty.
Activity in the low carbon and renewable energy (LCRE) economy is spread across a wide range of industries. Many
sectors are small but growing and for many businesses LCRE activity is secondary rather than primary. For this reason,
estimates of the number of businesses are subject to particular volatility.
Trends in the data are presented as far back as 2014, when the survey was first set up. A more complete picture of how
the LCRE economy is changing over time will be possible once longer-term trends are available.
Estimates rely on businesses self-reporting their activity. Where a business is active in the low carbon services sector, if
they provide services entirely in relation to another low carbon sector then they may choose to report their estimates
there. For example, a business that provides financial services to the onshore wind sector may report their estimates
under onshore wind only. Estimates of low carbon financial services may therefore be an underestimate.
7
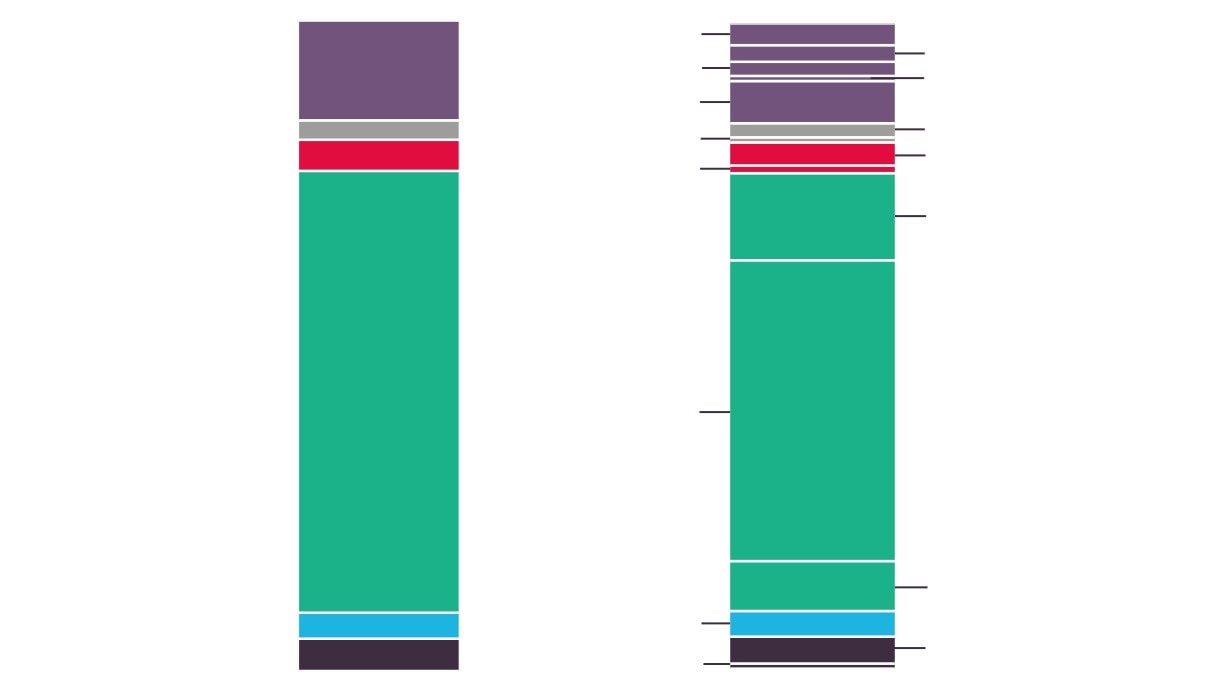
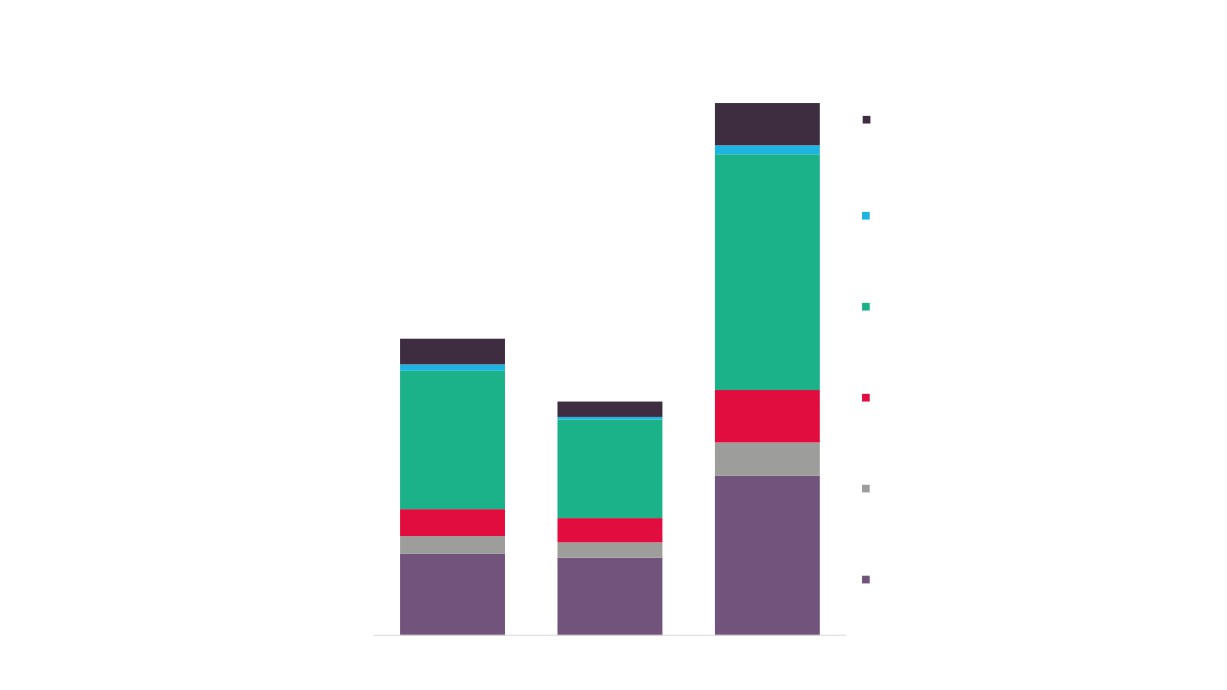
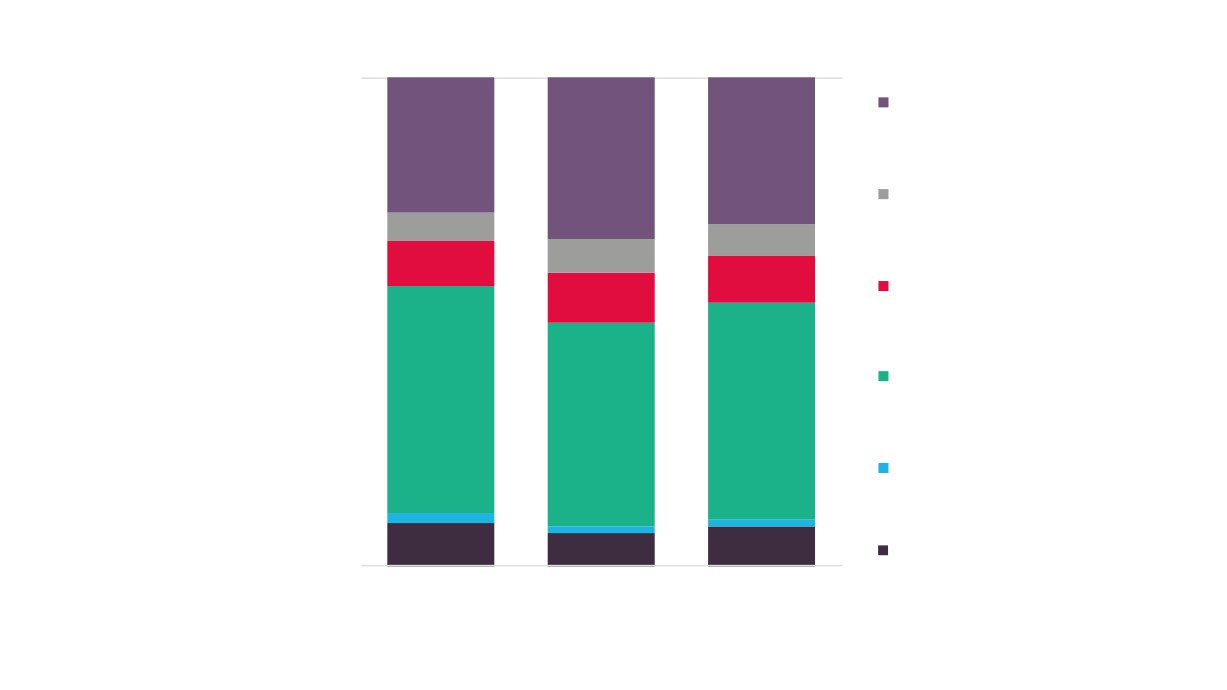
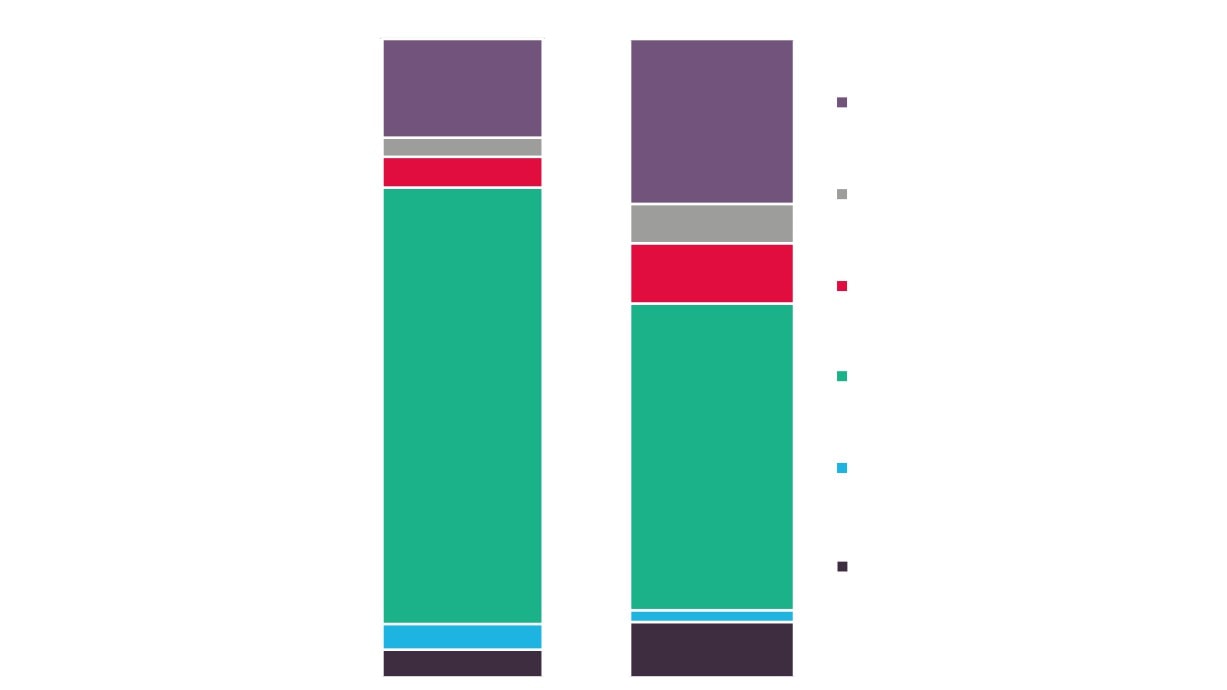
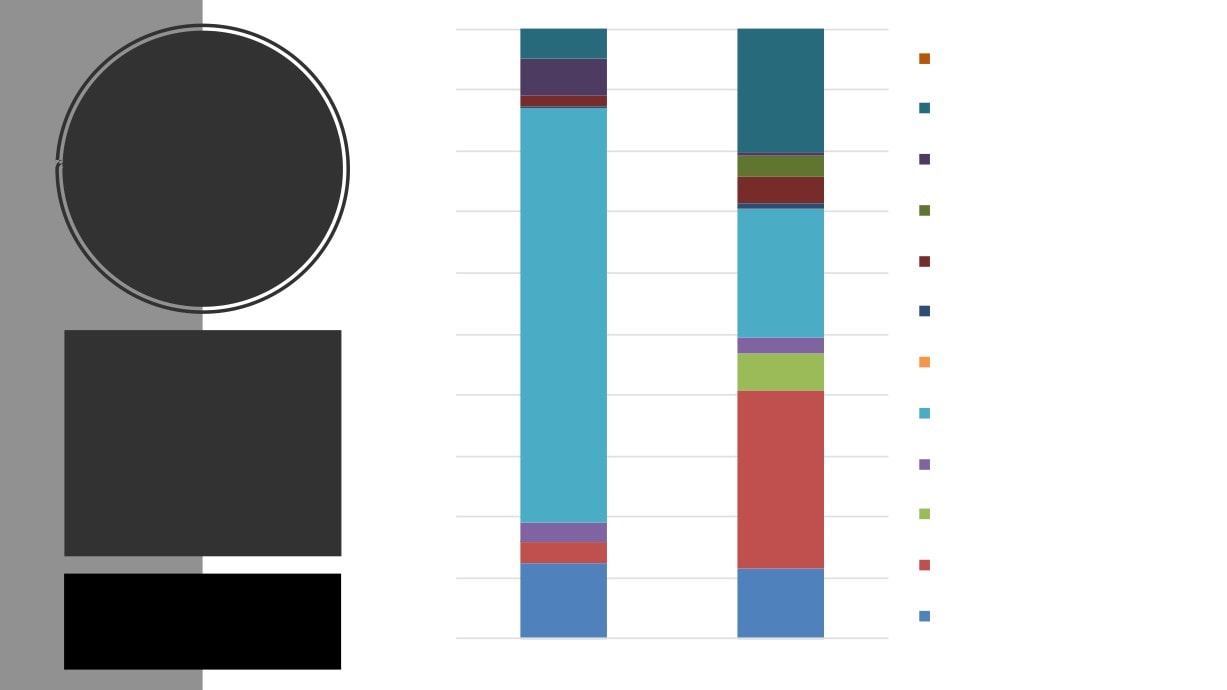
National LCRE Sector businesses, FTEs, and turnover by LCRE
Group, 2017
0%
10%
20%
30%
40%
50%
60%
70%
80%
90%
100%
90%
Numb
81,500
Number of businesses
23%
4%
4%
63%
2%
5
Turnover
28%
6%
9%
46%
2%
£44.5bn
2%
9
Full-t
Full-time equivalents
15%
3% 5%
68%
4%209,
500
4%
Low
Low Carbon Electricity
Low Carbon Heat
En
Energy from waste and biomass
Energy efficient products
Low
Low Carbon services
Low emission vehicles, infrastructure, fuel cells and energy storage
and energy
Source: Office for National Statistics, Low Carbon and Renewable Energy Sector Survey
8
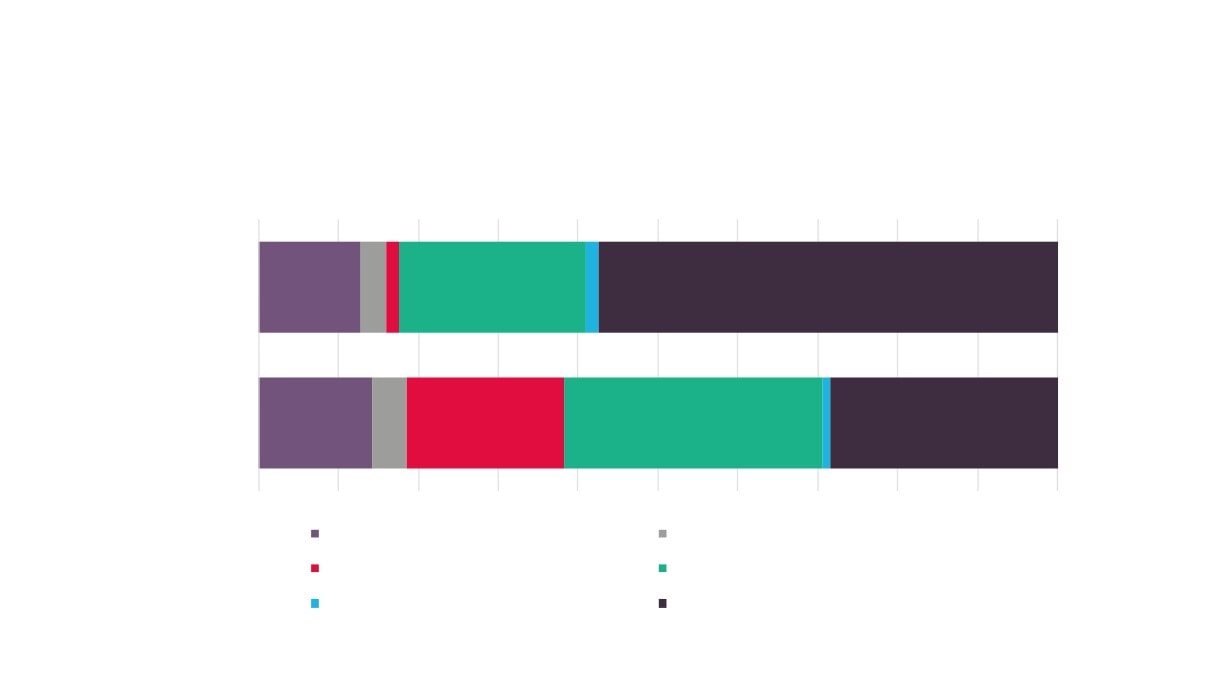
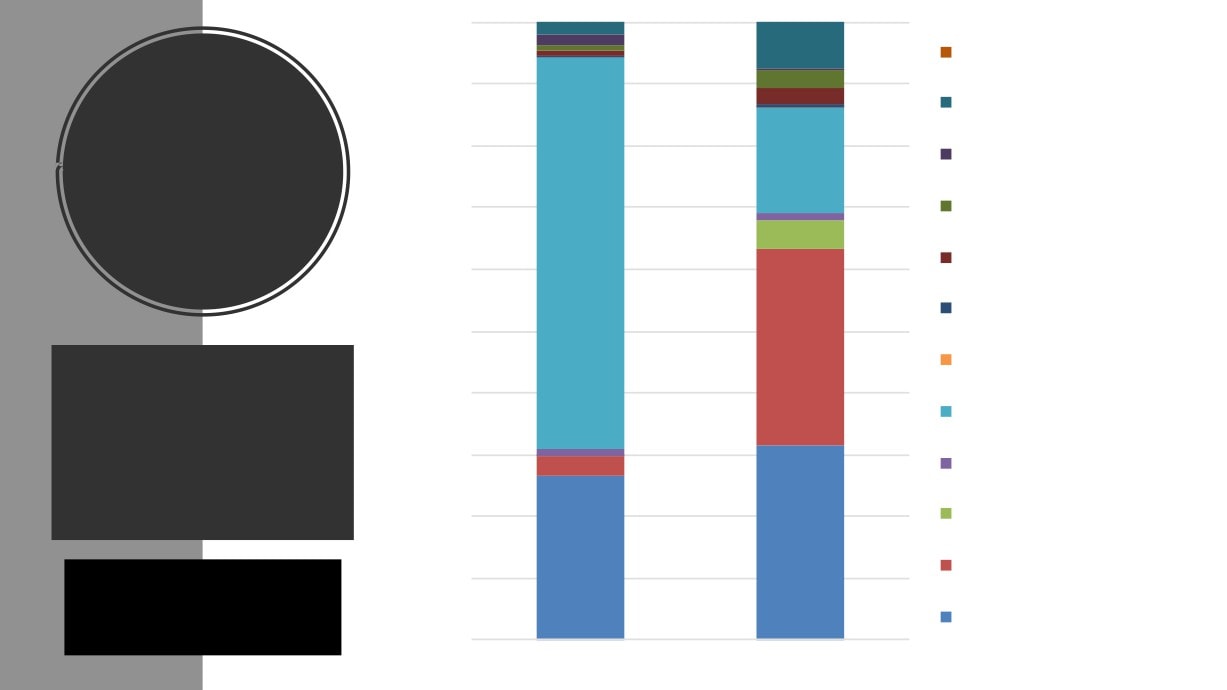
National LCRE Sector Exports and Imports by LCRE Group, 2017
0%
10%
20%
30%
40%
50%
60%
70%
80%
90%
100%
90%
0%
10%
20%
30%
40%
50%
60%
70%
80%
90%
100%
2%
5
Exports
13%
3%
23%
57%
£4.9bn
2%
9
Imports
14%
4%
20%
32%
28%
£5.9bn
%
4%
Low Carbon Electricity
Low Carbon Heat
Energy from waste and biomass
orage
and energy
Energy efficient products
Low Carbon services
Low emission vehicles, infrastructure, fuel cells and energy storage
9
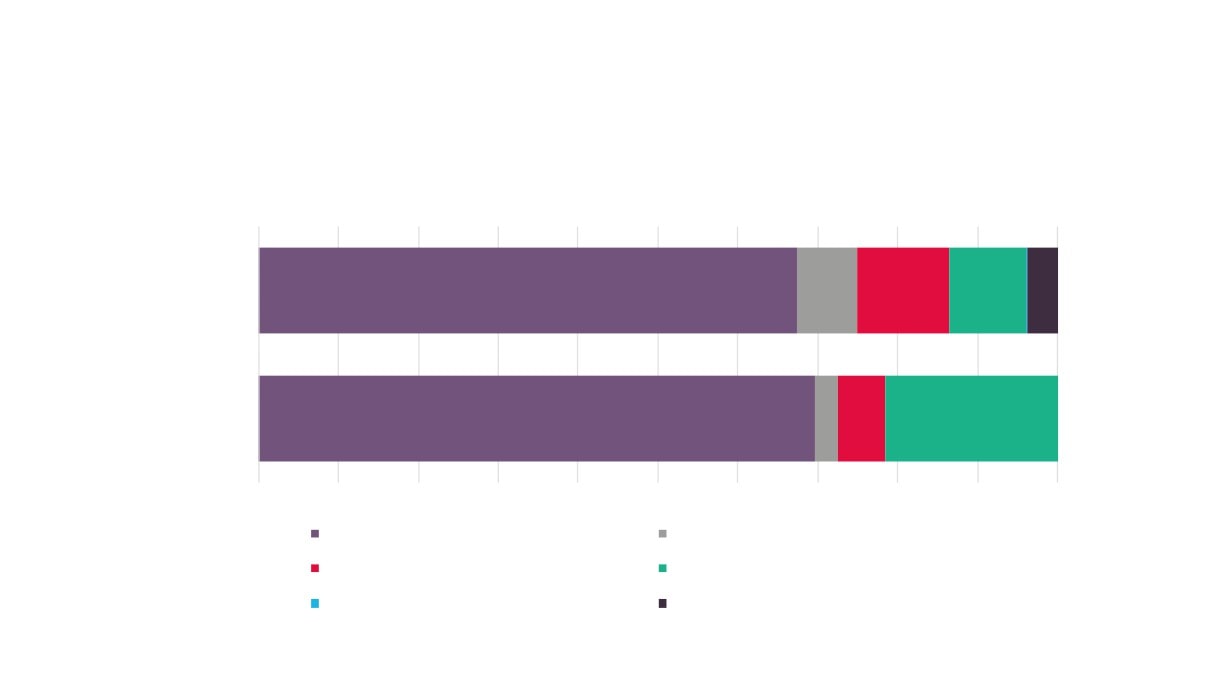
National LCRE Acquisitions and Disposals by LCRE Group, 2017
0%
10%
20%
30%
40%
50%
60%
70%
80%
90%
100%
90%
Number of businesses
23%
4%
4%
63%
5%
2%
5
£5.6bn
Turnover
28%
6%
9%
46%
2%
9%
2%
9
£181m
Full-time equivalents
15%
3% 5%
68%
4% 5%
4%
Low Carbon Electricity
Low Carbon Heat
Low
Energy from waste and biomass
Energy efficient products
Low Carbon services
Low emission vehicles, infrastructure, fuel cells and energy storage
and energy
Ene
Low Carbon services
Low emission vehicles, infrastructure, fuel cells and energy storage
10
44%
42%
Low carbon services
2%
2%
1%
9%
8%
7%
Low emission vehicles,
0%
infrastructure, fuel cells and energy
Direct
Indirect
Total
storage
Employment
Employment
Employment
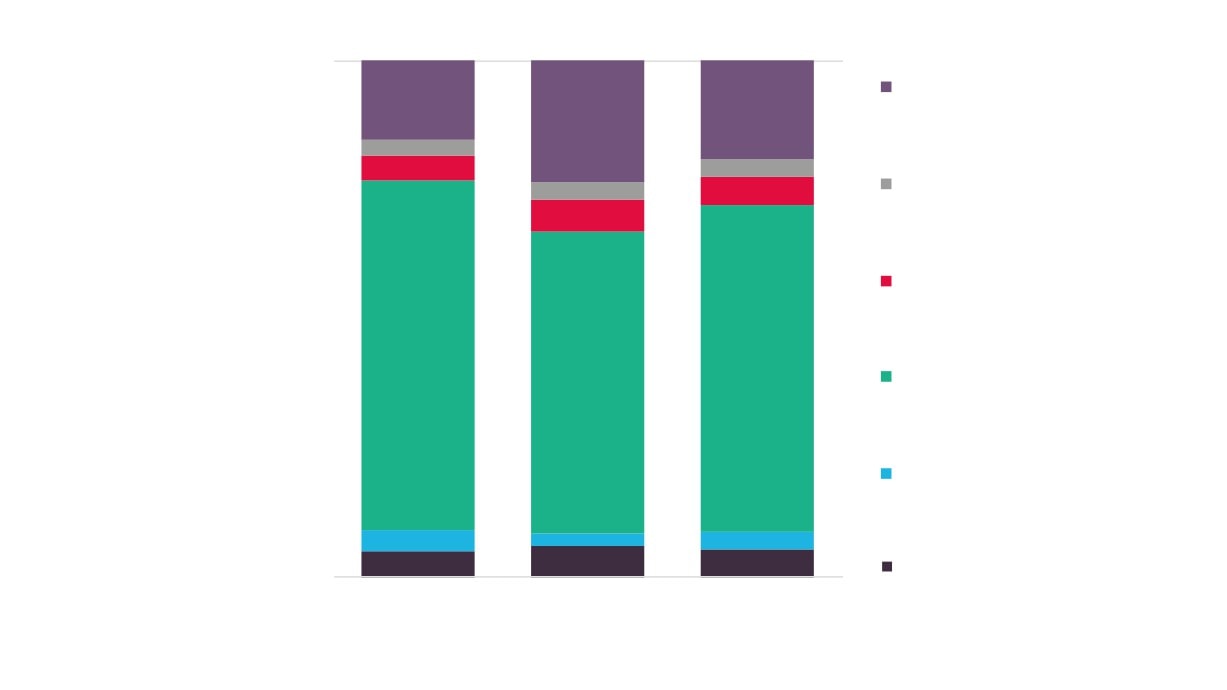
National LCRE
Low carbon services
direct, indirect
and total
employment
251,400
Energy efficient products
209,600
(FTEs) by LCRE
10,300
8,500
186,600
Group, 2017
11,400
4,000
Energy from waste and biomass
Source: Office for National
Statistics, Low Carbon and
Renewable Energy Sector
142,100
Survey
109,300
Low carbon heat
21,600
13,000
11,400
6,700
10,200
76,000
Low carbon electricity
6,300
43,800
32,200
Direct Employment Indirect Employment Total Employment
1
100%
100%
Low carbon electricity
28%
30%
Proportions of
33%
LCRE direct,
Low carbon heat
6%
indirect and tota
6%
7%
9%
employment
10%
Energy from waste and biomass
10%
(FTEs) by LCRE
Group, 2017
Energy efficient products
Source: Office for National
46%
Statistics, Low Carbon and
44%
42%
Renewable Energy Sector
Survey
Low carbon services
2%
2%
1%
9%
8%
7%
Low emission vehicles,
0%
0%
infrastructure, fuel cells and energy
Direct
Indirect
Total
storage
Employment
Employment
Employment
12
100%
3.4%
Proportion of
Other
90%
15.3%
LCRE Direct
80%
N : Administrative and support service activities
Employment by
3.0%
Broad Industrial
70%
M : Professional, scientific and technical activities
Group, 2017
60%
39.2%
G : Wholesale and retail trade; repair of motor vehicles and motorcycles
50%
F : Construction
40%
3.2%
6.8%
30%
E : Water supply; sewerage, waste management and remediation activities
20%
D : Electricity, gas, steam and air conditioning supply
29.1%
10%
C : Manufacturing
0%
Source: Office for National Statistics, Low Carbon and Renewable Energy Sector Survey
13
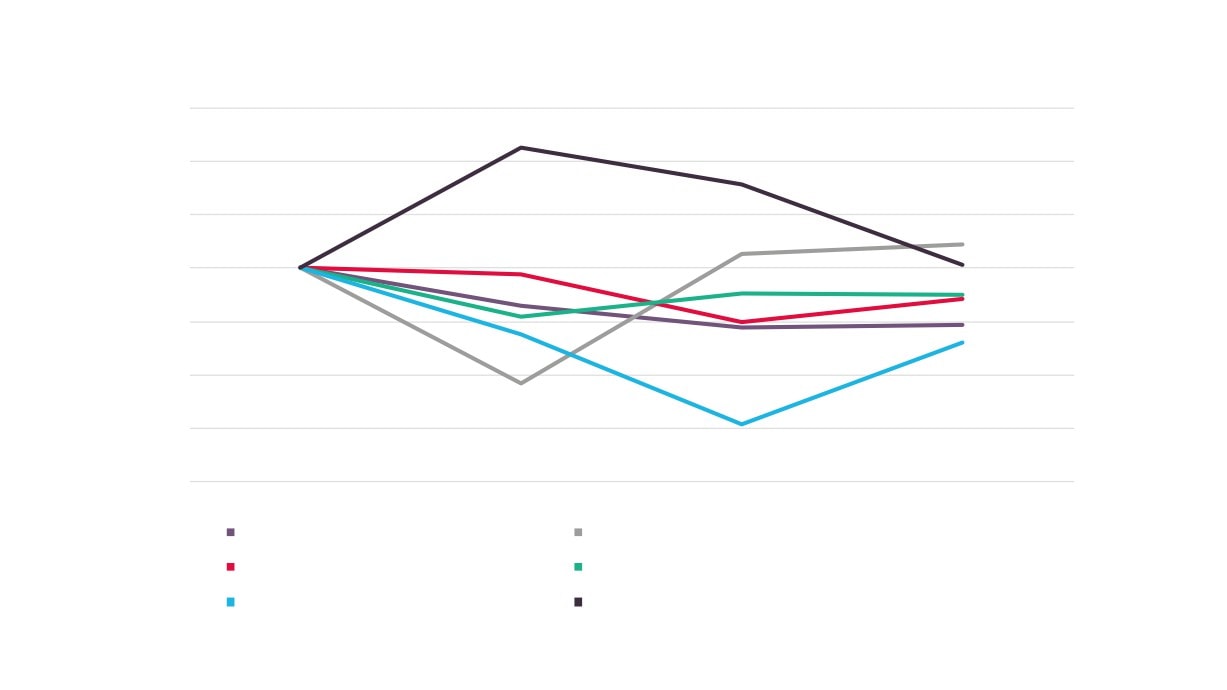
Direct employment (FTEs) over time by LCRE Group
160
0%
10%
20%
30%
40%
50%
60%
70%
80%
90%
100%
90%
100%
Number of businesses
23%
4%
4%
63%
5%
2%
5%
2%
Turnover
28%
6%
9%
46%
2%
9%
2%
9%
Full-time equivalents
15%
3% 5%
68%
4% 5%
4% 5%
Low Carbon Electricity
Low Carbon Heat
Energy from waste and biomass
Energy efficient products
Low Carbon services
Low emission vehicles, infrastructure, fuel cells and energy storage
and energy storage
Source: Office for National Statistics, Low Carbon and Renewable Energy Sector Survey
Low emission vehicles, infrastructure, fuels cells and energy storage
14
44%
42%
Low carbon services
2%
2%
1%
9%
8%
7%
Low emission vehicles,
0%
infrastructure, fuel cells and energy
Direct
Indirect
Total
storage
Employment
Employment
Employment
National LCRE
Low carbon services
direct, indirect
and total turnover
35.3
(£bn) by LCRE
Energy efficient products
£44.5bn
Group, 2017
3.9
£35.1bn
Energy from waste and biomass
2.4
Source: Office for National
7.7
Statistics, Low Carbon and
20.7
Renewable Energy Sector Survey
5.1
14.7
Low carbon heat
4.1
3.6
2.6
2.4
23.9
Low carbon electricity
12.3
11.6
Direct Turnover
Indirect Turnover
Total Turnover
15
1
100%
Low carbon electricity
28%
30%
33%
Proportions of
Low carbon heat
LCRE direct,
6%
6%
indirect and tota
7%
9%
10%
Energy from waste and biomass
turnover by
10%
LCRE Group,
2017
Energy efficient products
46%
44%
Source: Office for National
42%
Statistics, Low Carbon and
Renewable Energy Sector Surve
Low carbon services
2%
2%
1%
9%
8%
7%
Low emission vehicles,
0%
infrastructure, fuel cells and energy
Direct
Indirect
Total
storage
Employment
Employment
Employment
16
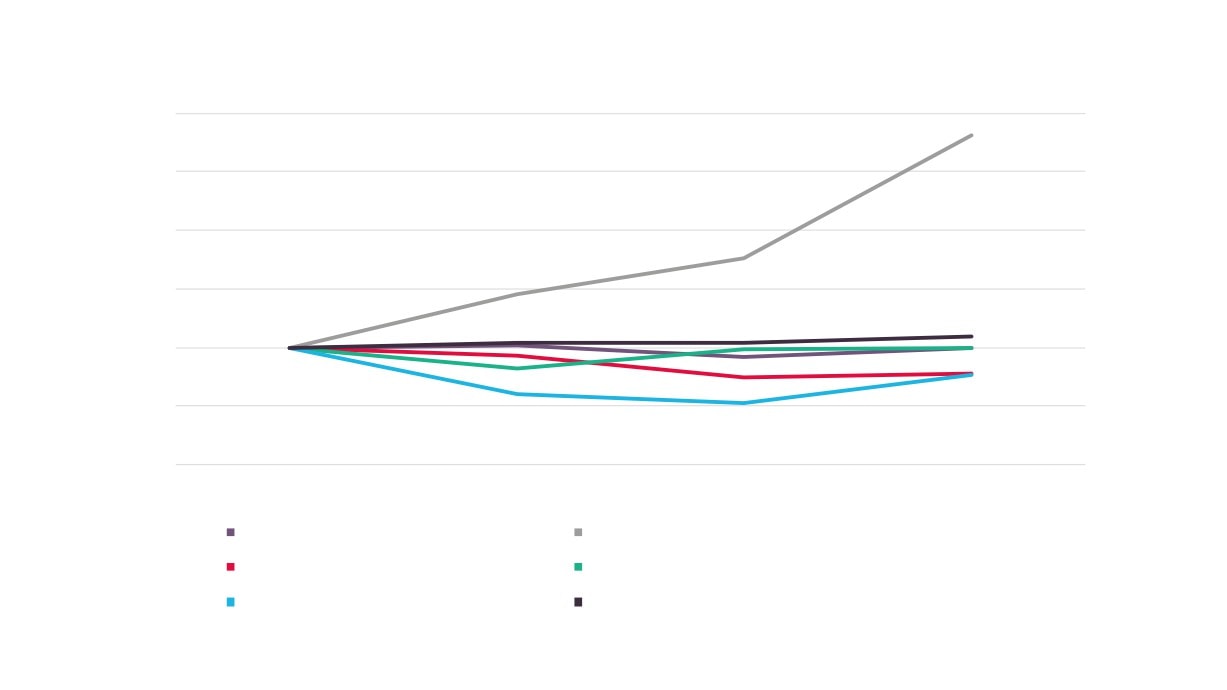
Direct turnover over time by LCRE Group
300
250
0%
100%
200
Number o
5%
2%
150
100
2%
9%
50
4% 5%
Full-time
0
2014
2015
2016
2017
Low carbon electricity
Low C
Low carbon heat
Energy from waste and biomass
Energy
Energy efficient products
Low C
energy storage
Low carbon services
Low emission vehicles, infrastructure, fuels cells and energy storage
17
Employment
Turnover
1
100%
Low carbon electricity
28%
30%
Comparison
33%
LCRE direct
Low carbon heat
6%
employment
6%
7%
9%
and turnove
10%
Energy from waste and biomass
10%
LCRE Grou
2017
Energy efficient products
46%
Source: Office for Natio
44%
Statistics, Low Carbon a
42%
Renewable Energy Sect
Low carbon services
2%
2%
1%
9%
8%
7%
Low emission vehicles,
0%
infrastructure, fuel cells and energy
Direct
Indirect
Total
storage
Employment
Employment
Employment
9%
18
5%
Norfolk & Suffolk
LCRE Sector
Estimates
The following section builds on the national data previously covered, and using estimates for LCRE activity across the
economy by Broad Industrial Group, presents estimates (produced by SkillsReach) for LCRE direct, indirect, and total
employment (FTE) for Norfolk and Suffolk, and LCRE direct employment for a number of comparator LEP areas.
Slide 23 presents work that was previously undertaken by New Anglia LEP as part of the evidence base for its Strategic
Economic Plan, and is presented here to provide estimates for value and business numbers.
19
42%
Low carbon services
2%
2%
1%
9%
8%
Norfolk and Suffolk
7%
Low emission vehicles,
0%
infrastructure, fuel cells and energy
Direct
Indirect
Total
LCRE direct, indirect
storage
Employment
Employment
Employment
and total
Low carbon services
employment (FTEs)
estimates by LCRE
8,000
8,800
Group, 2017
Energy efficient products
500
200
Figures rounded to the nearest
100; totals may not sum due to
rounding
5,900
300
Energy from waste and biomass
200
Source: Office for National
4,700
Statistics, Low Carbon and
Renewable Energy Sector
Survey; Business Register and
Low carbon heat
800
4,000
Employment Survey 2017
500
500
300
2,700
Low carbon electricity
300
200
1,900
900
Direct Employment Indirect Employment Total Employment
20
Cumbria
2,400
Greater Lincolnshire
4,300
LCRE direct
Heart of the South West
6,200
employment (FTEs)
across comparator
Humber
4,100
areas, 2017
Liverpool City Region
4,500
New Anglia
5,800
South East
13,500
Tees Valley
2,100
York, North Yorkshire and East Riding
4,300
Source: Office for National Statistics, Low Carbon and Renewable
Energy Sector Survey; Business Register and Employment Survey 2017
21
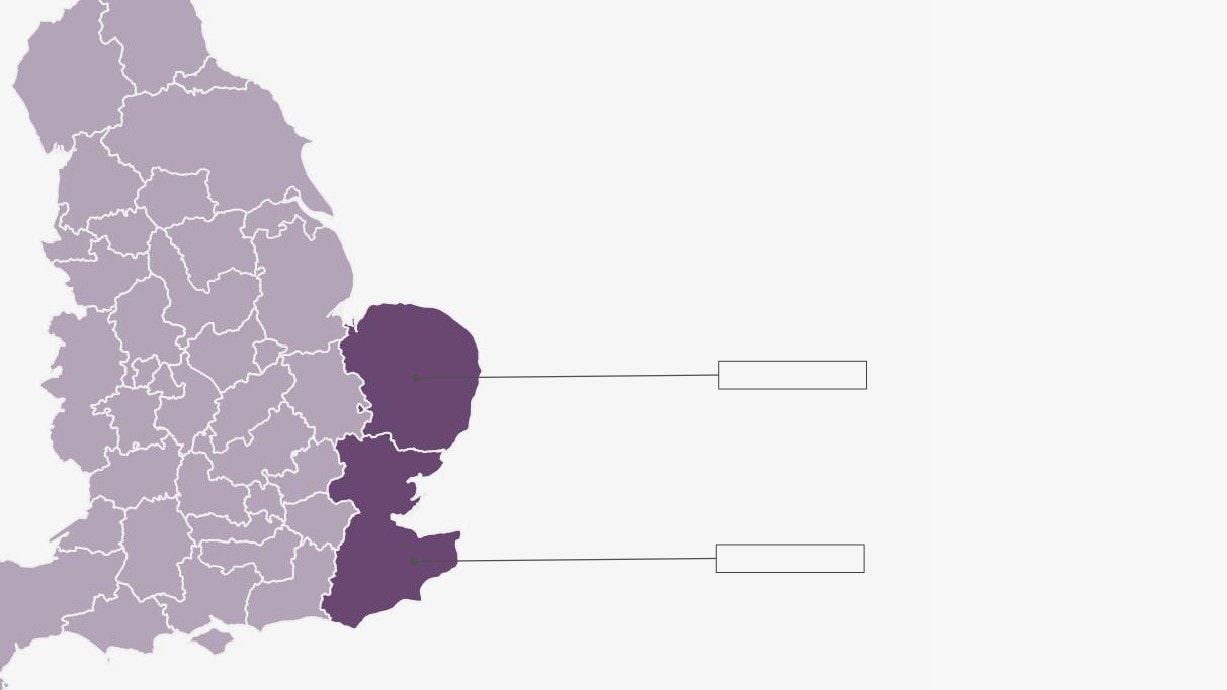
Referring back to the previous slide then we note the high level of employment
in the LCRE sector in the South East LEP (though this is proportional to overall
employment as shown in slide 23).
One of the key traditional sector’s skills sets that plays a significant role in
driving LCRE sector development is that of Construction, and in this image we
have highlighted the numbers of FTEs in the sector for both New Anglia LEP
and South East LEP.
As the image shows, New Anglia LEP is perfectly positioned geographically to
provide access to this suitably skilled and experienced workforce, particularly
in Essex, which borders Suffolk to the south.
LCRE FTEs - 5,800
New Anglia LEP
Construction FTEs - 32,500
Source: Office for National Statistics, Low Carbon and Renewable
Energy Sector Survey; Business Register and Employment Survey 2017
LCRE FTEs - 13,500
South East LEP
Construction FTEs - 99,000
22
Cumbria
1.26%
Greater Lincolnshire
1.18%
Heart of the South West
1.08%
Humber
1.26%
LCRE direct
employment (FTEs)
Liverpool City Region
0.87%
as a % of total
New Anglia
1.04%
employment (FTEs)
South East
1.04%
across comparator
Tees Valley
0.99%
areas, 2017
York, North Yorkshire and East Riding
1.05%
England
0.97%
Source: Office for National Statistics, Low Carbon and Renewable
Energy Sector Survey; Business Register and Employment Survey 2017
23
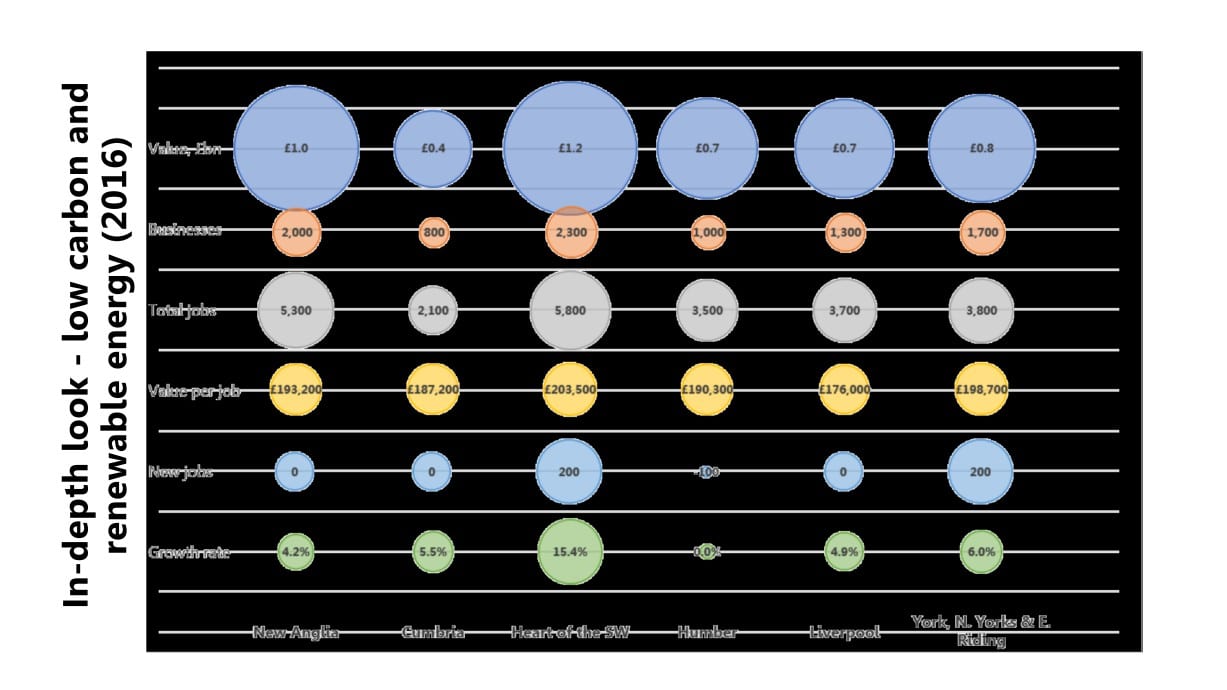
Extract from New Anglia LEP produced Energy sector comparator datapack
24
Source: ONS and LEP analysis
Renewable
Electricity
Analysis
The following section considers the latest release of Department for Business, Energy and Industrial Strategy (BEIS)
Renewable Electricity Statistics covering the period 2014 to 2017.
For the first time this data has been made available at local authority level and so we have been able to present figures
for capacity, generation, and sites for each of New Anglia LEPs local authority areas. This information is also summed up
to present LEP level analysis alongside a national comparator.
25
Renewable Electricity Capacity
Between 2014 and 2017, renewable electricity
capacity has doubled in Norfolk and Suffolk
3,000 MW
40,630 M
(2017)
(2017)
100%
63%
1,499 MW
24,914 M
(2014)
(2014)
Source: Renewable Electricity Statistics, Department
for Business, Energy and Industrial Strategy
26
Babergh
61%
Breckland
66%
Broadland
69%
Forest Heath
416%
Great Yarmouth
3%
Ipswich
85%
King's Lynn and West Norfolk
1607%
Mid Suffolk
13%
North Norfolk
136%
Change in
Norwich
85%
South Norfolk
174%
Renewable
St Edmundsbury
20%
Electricity Capacity,
Suffolk Coastal
14%
2014 - 2017
Waveney
47%
New Anglia
100%
UK
63%
Source: Renewable Electricity Statistics, Department for Business, Energy and Industrial Strategy
27
100%
8%
Cofiring
3%
90%
3%
Plant Biomass
Renewable
80%
Electricity
Animal Biomass
17%
Capacity by
70%
Municipal Solid Waste
Type, 2017
5%
63%
Landfill Gas
60%
Sewage Gas
50%
32%
Wave/Tidal
Offshore wind
40%
makes up nearly two
Offshore Wind
thirds of Norfolk and
30%
Anaerobic Digestion
3%
Suffolk’s renewable
20%
Hydro
electricity capacity
32%
27%
Onshore Wind
Source: Renewable Electricity
10%
Statistics, Department for
Business, Energy and Industrial
Photovoltaics
Strategy
0%
28
New Anglia
UK
Proportion of UK Renewable Electricity Capacity
Provided by Type in Norfolk and Suffolk, 2017
0%
100%
Photovoltaics
6%
94%
Onshore Wind
99%
Norfolk and Suffolk
are responsible for
Hydro
100%
over a quarter of the
Anaerobic Digestion
7%
93%
countries offshore
Offshore Wind
27%
73%
wind generated
Wave/Tidal
100%
renewable electricity
Sewage Gas
97%
capacity, and over two
Landfill Gas
97%
fifths of that resulting
Municipal Solid Waste
98%
from animal biomass
Animal Biomass
43%
57%
Plant Biomass
98%
Cofiring
100%
New Anglia
Rest of UK
Source: Renewable Electricity Statistics, Department for
Business, Energy and Industrial Strategy
29
North Norfolk
30.2%
King's Lynn and West Norfolk
22.5%
Suffolk Coastal
21.6%
Breckland
6.7%
Waveney
3.1%
Proportion of Norfolk
Coastal local
Mid Suffolk
3.0%
and Suffolk Anglia
authorities dominate
St Edmundsbury
2.9%
Renewable
renewable electricity
capacity
Great Yarmouth
2.9%
Electricity Capacity
South Norfolk
2.1%
Provided by Local
Forest Heath
2.1%
Authority Area, 2017
Broadland
1.7%
Source: Renewable Electricity Statistics,
Department for Business, Energy and
Ipswich
0.5%
Industrial Strategy
Babergh
0.4%
Norwich
0.3%
30
Renewable Electricity Generation
In Norfolk and Suffolk between 2014 and 2017,
renewable electricity generation has increased by
nearly 50%
6m MWh
99.4m MW
(2017)
(2017)
48%
54%
4.1m MWh
64.5 MW
(2014)
(2014)
Source: Renewable Electricity Statistics, Department
for Business, Energy and Industrial Strategy
31
Babergh
133%
Breckland
110%
Broadland
21%
Forest Heath
481%
Great Yarmouth
2%
Ipswich
143%
King's Lynn and West Norfolk
1699%
Mid Suffolk
6%
North Norfolk
16%
Norwich
27%
Change in Renewable
South Norfolk
102%
Electricity Generation,
St Edmundsbury
76%
2014 - 2017
Suffolk Coastal
5%
Waveney
81%
New Anglia
48%
UK
54%
Source: Renewable Electricity Statistics, Department for Business, Energy and Industrial Strategy
32
100%
5%
Cofiring
6%
90%
20%
Renewable
Plant Biomass
Electricity
80%
Animal Biomass
3%
Generation
4%
by Type,
70%
Municipal Solid Waste
2017
Landfill Gas
60%
21%
Sewage Gas
68%
50%
3%
Over two thirds of
Wave/Tidal
6%
renewable electricity
40%
generated in Norfolk
Offshore Wind
and Suffolk in 2017
30%
Anaerobic Digestion
was via offshore wind,
29%
compared to only a
20%
Hydro
3%
fifth nationally
4%
Onshore Wind
10%
Source: Renewable Electricity
12%
12%
Statistics, Department for
Photovoltaics
Business, Energy and Industrial
0%
Strategy
33
New Anglia
UK
Proportion of UK Renewable Electricity Generated
by Type in Norfolk and Suffolk, 2017
0%
100%
Photovoltaics
6%
94%
Norfolk and Suffolk
Onshore Wind
99%
are responsible for
Hydro
100%
two fifths of the
Anaerobic Digestion
7%
93%
countries offshore
Offshore Wind
20%
80%
wind generated
Wave/Tidal
100%
renewable electricity
Sewage Gas
97%
and nearly three fifths
Landfill Gas
98%
of that generated from
Municipal Solid Waste
100%
animal biomass
Animal Biomass
57%
43%
Plant Biomass
99%
Cofiring
100%
New Anglia
Rest of UK
Source: Renewable Electricity Statistics, Department for
Business, Energy and Industrial Strategy
34
Suffolk Coastal
32.6%
North Norfolk
22.2%
King's Lynn and West Norfolk
18.1%
Breckland
12.3%
Great Yarmouth
3.3%
Mid Suffolk
2.8%
St Edmundsbury
2.0%
Proportion of
Waveney
1.9%
Norfolk and Suffolk
South Norfolk
1.5%
Renewable
Broadland
1.3%
Electricity
Forest Heath
0.9%
Generation by
Ipswich
0.5%
Local Authority
Babergh
0.3%
Area, 2017
Norwich
0.2%
Source: Renewable Electricity Statistics, Department for Business, Energy and Industrial Strategy
35
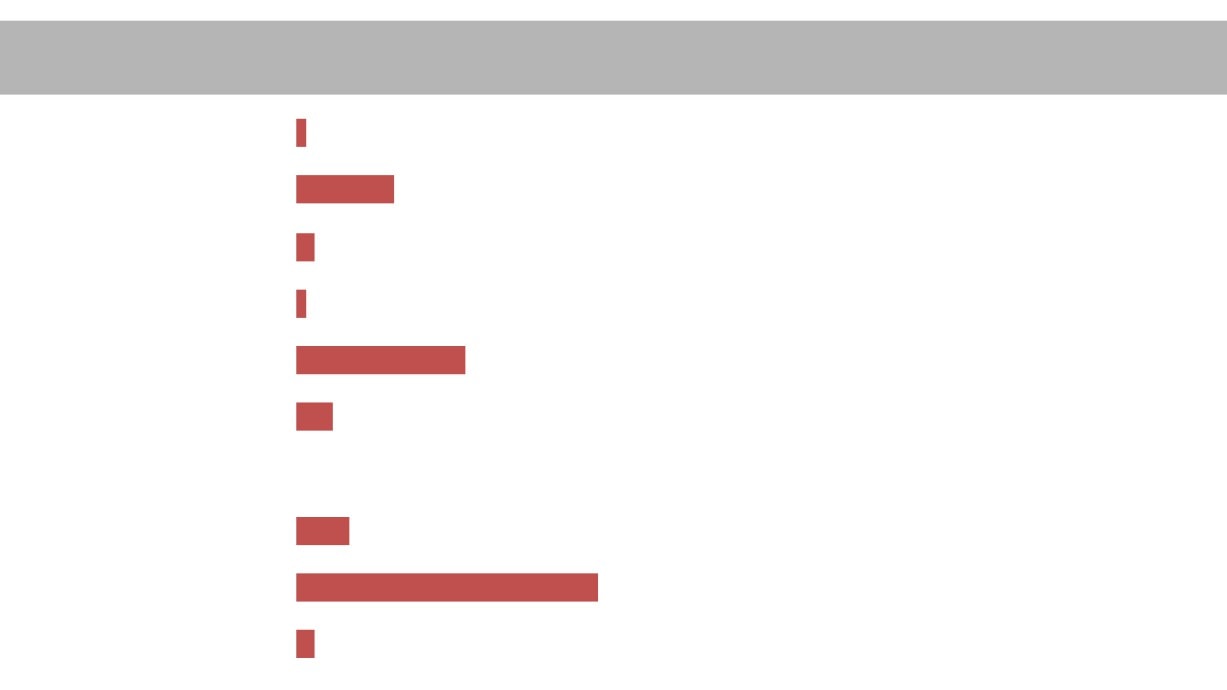
Renewable Electricity Installations
Cofiring
1
Plant Biomass
11
Number of
Animal Biomass
2
Renewable Electricity
Municipal Solid Waste
1
Installations by Type
Landfill Gas
19
in Norfolk and
Suffolk, 2017
Sewage Gas
4
Not shown here are Photovoltaics
Wave/Tidal
-
(37,179) and Onshore Wind (614)
Offshore Wind
6
Source: Renewable Electricity Statistics,
Department for Business, Energy and
Industrial Strategy
Anaerobic Digestion
34
Hydro
2
36
Cofiring
25%
Plant Biomass
3%
Animal Biomass
33%
Municipal Solid Waste
Landfill Gas
4%
Proportion of UK
Sewage Gas
2%
Renewable
Wave/Tidal
Electricity
Installations by
Offshore Wind
16%
Type in Norfolk and
Anaerobic Digestion
6%
Suffolk, 2017
Hydro
Source: Renewable Electricity Statistics,
Department for Business, Energy and
Onshore Wind
6%
Industrial Strategy
Photovoltaics
4%
37
Labour Insight
Jobs
The following section presents data from Labour Insight, a Burning Glass analytical tool. This
tool collects details of online job postings from multiple sources and enables the analysis of
these postings based on specific skills, educational requirements, and job titles, for example.
Please note that whilst Labour Insight will capture more information on the jobs market than
more traditional Department for Work and Pensions vacancy data, the fact that not all job
vacancies are advertised means that there will still be gaps in the findings.
In terms of highlighting ‘Clean Energy’ occupations then we have searched for vacancies using
the keywords / phrases of ‘renewables’ or ‘low carbon’ and ‘energy’.
Based on this search, and according to the Labour Insight Jobs tool, there were 3,560 postings
for the sector in Norfolk and Suffolk between Jan. 1, 2012 and Dec. 31, 2018.
38
Burning Glass Labour Market Analysis of ‘Clean Energy’
Occupations, 2018
Work Area
Job Postings Job Postings per 1000 people employed Location Quotient
Ipswich
108
0.7
Average demand
Lowestoft
34
0.6
Average demand
King's Lynn
34
0.5
Lower demand than average
Norwich
80
0.4
Much lower demand than average
Bury St Edmunds
30
0.4
Much lower demand than average
Great Yarmouth
18
0.4
Much lower demand than average
Thetford & Mildenhall
16
0.3
Much lower demand than average
Cromer & Sheringham
5
0.3
Much lower demand than average
Source: Burning Glass Labour Market Analysis tool
39
657
628
Norfolk and Suffolk ‘Clean
Energy’ Vacancies Over Time
Vacancies have
been identified
through the key
381
352
words search of
337
323
321
‘low carbon’ or
‘renewable’, and
‘energy’
2012
2013
2014
2015
2016
2017
2018
Source: Burning Glass Labour Market Analysis tool
40
0
100
200
300
400
500
600
700
800
900
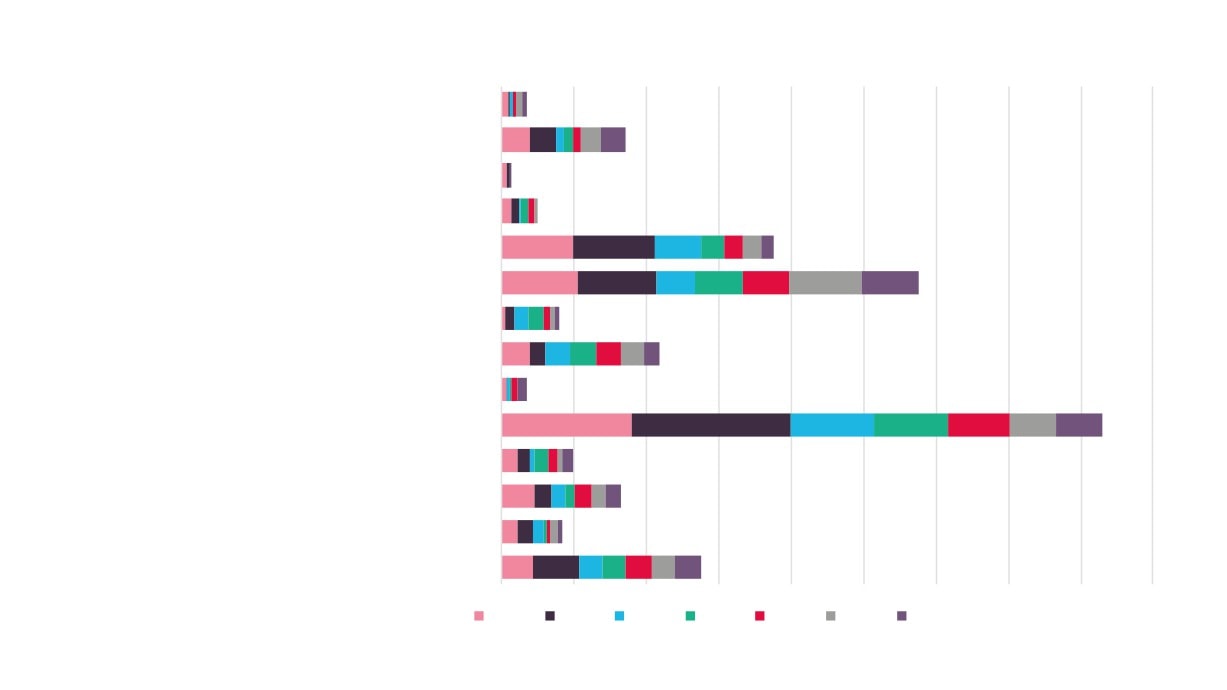
‘Clean Energy’
Babergh
Vacancies Across
Breckland
Norfolk and
Broadland
Forest Heath
Suffolk Over Time
Great Yarmouth
Ipswich
King's Lynn and West Norfolk
Mid Suffolk
North Norfolk
Norwich
South Norfolk
St Edmundsbury
Suffolk Coastal
Waveney
2012
2013
2014
2015
2016
2017
2018
Source: Burning Glass Labour Market Analysis tool
41
0
50
100
150
200
250
300
350
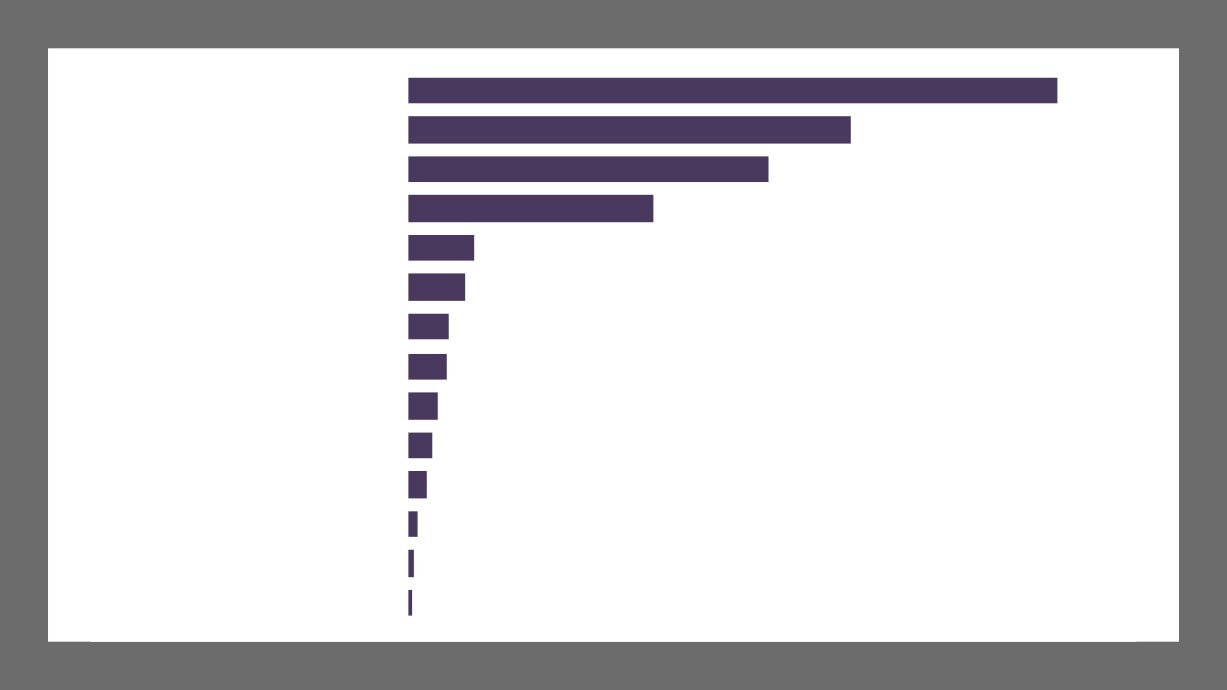
Sales related occupations n.e.c. (7129)
Engineering technicians (3113)
Managers and proprietors in other services n.e.c. (1259)
Engineering professionals n.e.c. (2129)
Marketing and sales directors (1132)
Electrical engineers (2123)
Other skilled trades n.e.c. (5449)
Plant and machine operatives n.e.c. (8129)
Other administrative occupations n.e.c. (4159)
Plumbers and heating and ventilating engineers (5314)
Top 20 Occupations
Civil engineers (2121)
with Vacancies
Electrical and electronic trades n.e.c. (5249)
Containing the
Draughtspersons (3122)
Keywords ‘Low
Mechanical engineers (2122)
Carbon’ or ‘Renewable’
Business sales executives (3542)
and ‘Energy’ in Norfolk
Electricians and electrical fitters (5241)
and Suffolk
Science, engineering and production technicians n.e.c. (3119)
Jan 2012 - Dec 2018
Production managers and directors in manufacturing (1121)
Source: Burning Glass Labour
Market Analysis tool
Design and development engineers (2126)
Estimators, valuers and assessors (3531)
42
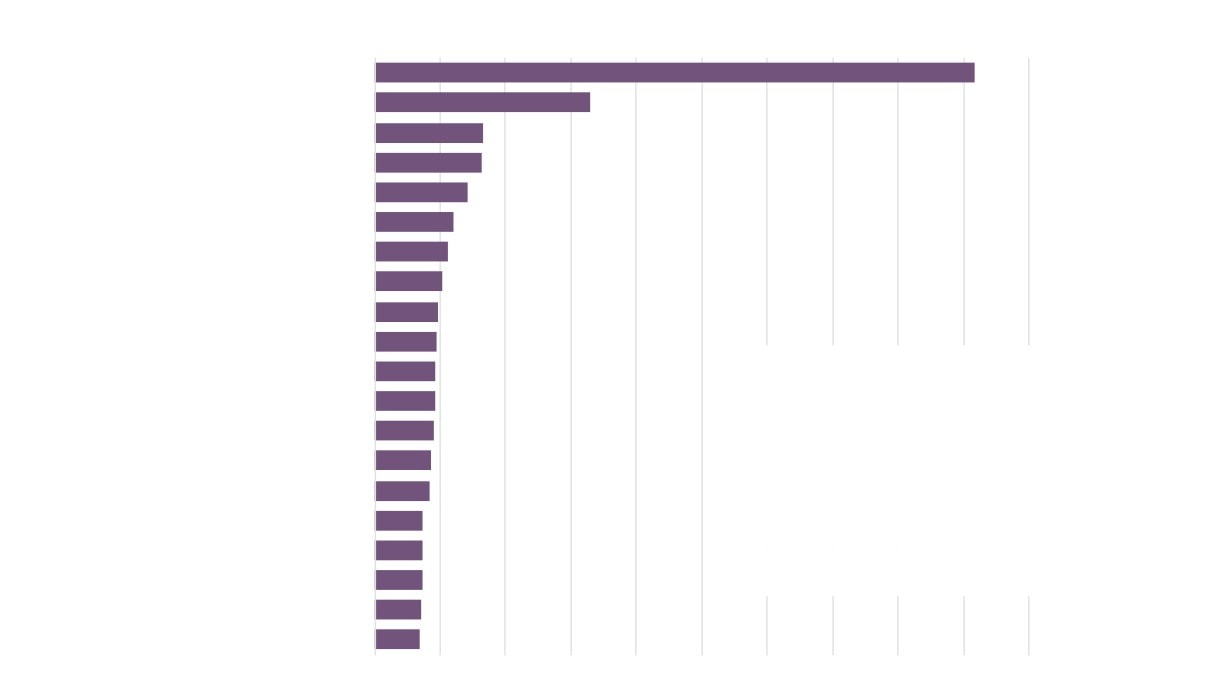
Top 10 Occupations with Vacancies Containing
Top 10 Occupations with Vacancies Containing
the Keywords ‘Low Carbon’ or ‘Renewable’ and
the Keywords ‘Low Carbon’ or ‘Renewable’ and
‘Energy’ in Norfolk and Suffolk, 2012
‘Energy’ in Norfolk and Suffolk, 2018
Occupation (SOC)
Vacancies
Occupation (SOC)
Vacancies
Sales related occupations n.e.c. (7129)
87
Engineering technicians (3113)
36
Marketing and sales directors (1132)
35
Plant and machine operatives n.e.c. (8129)
24
Managers and proprietors in other services n.e.c. (1259)
31
Engineering professionals n.e.c. (2129)
20
Business sales executives (3542)
30
Managers and proprietors in other services n.e.c. (1259)
20
Collector salespersons and credit agents (7121)
24
Electricians and electrical fitters (5241)
18
Telephone salespersons (7113)
19
Design and development engineers (2126)
13
Civil engineers (2121)
17
Marketing and sales directors (1132)
13
Engineering professionals n.e.c. (2129)
15
Electrical and electronic trades n.e.c. (5249)
12
Science, engineering and production technicians n.e.c. (3119)
15
Electrical engineers (2123)
12
Book-keepers, payroll managers and wages clerks (4122)
13
Mechanical engineers (2122)
11
Source: Burning Glass Labour Market Analysis tool
43
-
200
400
600
800
1,000
1,200
1,400
1,600
1,800
2,000
Renewable Energy
Sales
Project Management
Customer Service
Budgeting
Teamwork / Collaboration
Business Development
Commissioning
AutoCAD
Technical Recruiting
Top 20 Specialist Skills
Carbon Reduction
Detailed in Vacancies
Biomass
Containing the Keywords
Wind Power
‘Low Carbon’ or
Mechanical Engineering
‘Renewable’ and ‘Energy’
Direct Sales
in Norfolk and Suffolk
Quality Management
Jan 2012 - Dec 2018
Sales Management
Source: Burning Glass Labour Market
Plumbing
Analysis tool
Procurement
Scheduling
44
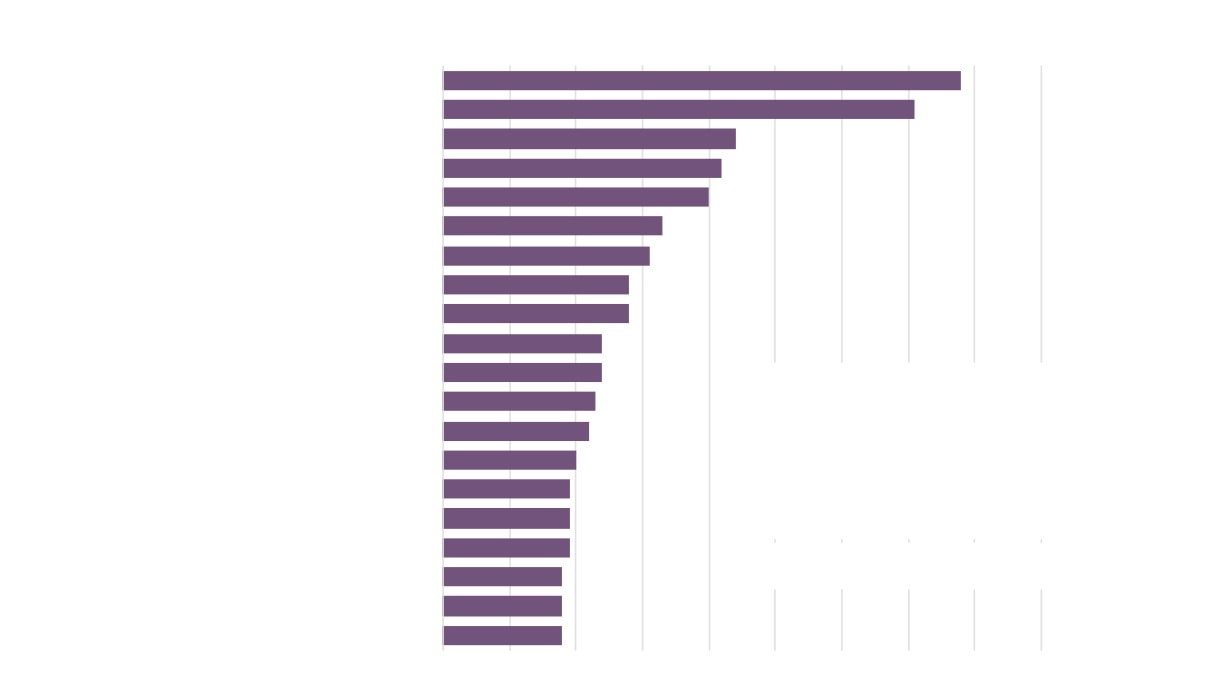
Top 10 Specialist Skills in Vacancies Containing
Top 10 Specialist Skills in Vacancies Containing
the Keywords ‘Low Carbon’ or ‘Renewable’ and
the Keywords ‘Low Carbon’ or ‘Renewable’ and
‘Energy’ in Norfolk and Suffolk 2012
‘Energy’ in Norfolk and Suffolk, 2018
Specialist Skill
Vacancies
Specialist Skill
Vacancies
Renewable Energy
323
Renewable Energy
213
Sales
199
Carbon Reduction
49
Project Management
68
Customer Service
48
Business Development
66
Teamwork / Collaboration
36
Budgeting
52
Budgeting
35
Direct Sales
46
Technical Recruiting
31
Sales Management
45
Biomass
29
Customer Service
37
Site Surveys
28
Product Sales
37
Business Development
27
Solar Energy
37
Commissioning
27
Source: Burning Glass Labour Market Analysis tool
45
0
10
20
30
40
50
60
70
80
90
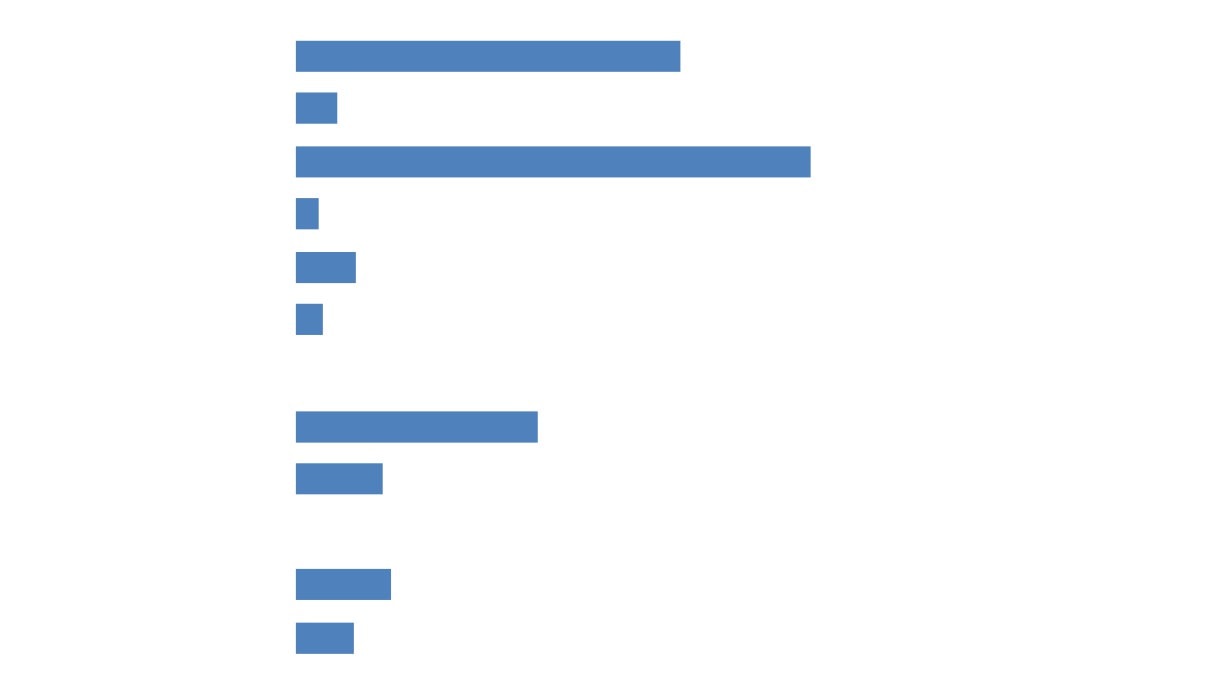
Sales Representative
Sales Executive
Electrician
Maintenance Engineer
Sales Manager
Business Development Executive
Engineering Manager
Sales Advisor
Structural Engineer
Electrical Engineer
Sales Engineer
Top 20 Job Titles in
Contract Manager
Vacancies Containing the
Customer Service Advisor
Keywords ‘Low Carbon’ or
Electrical Design Engineer
‘Renewable’ and ‘Energy’
Energy Engineer
in Norfolk and Suffolk
Project Manager
Jan 2012 - Dec 2018
Telemarketer
Source: Burning Glass Labour Market
Field Service Engineer
Analysis tool
Mechanical Engineer
Plant Manager
46
Top 10 Job Titles in Vacancies Containing the
Top 10 Job Titles in Vacancies Containing the
Keywords ‘Low Carbon’ or ‘Renewable’ and
Keywords ‘Low Carbon’ or ‘Renewable’ and
‘Energy’ in Norfolk and Suffolk, 2012
‘Energy’ in Norfolk and Suffolk, 2018
Job Title
Vacancies
Job Title
Vacancies
Sales Executive
26
Electrician
17
Sales Representative
21
Building Engineer
11
Canvasser
16
Business Development Executive
10
Sales Manager
15
Maintenance Engineer
8
Sales Advisor
14
Energy Engineer
7
Sales Engineer
14
Plant Operator
7
Business Development Executive
11
Sustainability Engineer
7
Call Centre Staff
9
Technical Analyst
7
Telemarketer
9
Contract Manager
6
Sales Consultant
8
Mechanical Engineer
6
Source: Burning Glass Labour Market Analysis tool
47
0
20
40
60
80
100
120
Other business support service activities n.e.c. (82.99)
Treatment and disposal of non-hazardous waste (38.21)
General public administration activities (84.11)
Tertiary education (85.42)
Plumbing, heat and air-conditioning installation (43.22)
Market research and public opinion polling (73.20)
Activities of head offices (70.10)
Legal activities (69.10)
Other construction installation (43.29)
Other retail sale not in stores, stalls or markets (47.99)
Top 20 Industries with
Distribution of gaseous fuels through mains (35.22)
Vacancies Containing
Manufacture of other electrical equipment (27.90)
the Keywords ‘Low
Trade of electricity (35.14)
Carbon’ or ‘Renewable’
Construction of other civil engineering projects n.e.c. (42.99)
and ‘Energy’ in Norfolk
and Suffolk
Production of electricity (35.11)
Jan 2012 - Dec 2018
Collection of non-hazardous waste (38.11)
Construction of residential and non-residential buildings (41.20)
Source: Burning Glass Labour
Market Analysis tool
Management consultancy activities (70.22/9)
Specialised design activities (74.10)
Urban planning and landscape architectural activities (71.11/2)
48
Future View of the
A Future View of the LCRE Sector
LCRE Sector
in Norfolk and Suffolk
We have shown in previous work for the Energy sector (which encapsulates a significant
proportion of the LCRE sector) that it is projected to grow by 6% between 2017 and 2024 (based
on the UK Commission for Employment and Skills Working Futures 2014-2024 data). Given the
emerging and important nature of the LCRE sector, and its local high profile, then clearly it will
play a major role in driving this growth.
The recently announced (March 2019) Offshore Wind Sector Deal sets out the following
ambitions for growth between now and 2030:
• Increased offshore wind capacity in the UK from 8GW to 30GW at a cost of £40billion, of which
the East of England would represent 14.5GW, or nearly 50%;
• Increase employment from 12-13,000 jobs now, adding a further 27,000 by 2030.
The focus of the sector on the East of England, and the fact that Norfolk and Suffolk already
delivers 20% of the country’s offshore wind generated electricity would suggest that we could
expect at least a similar proportion of the jobs target would be met in Norfolk and Suffolk i.e.
5,400 jobs.
This coupled with the Nuclear Sector Deal, means that we can expect to see an increase in low
carbon and renewable energy vacancies across Norfolk and Suffolk in the near future.
49