AgriFood Tech Sector
Data Pack
Version Final
Contents
Page
-
Introduction to the Sector Data Pack
3
-
Introduction to and Definition of the AgriFood Tech Sector
3
-
Key Findings from the Data Analysis
5
-
The AgriFood Tech Sector in New Anglia
6
o GVA
9
o Employment
11
o Businesses
34
o NiNO registrations
39
o Exports
43
o Wages
49
o Qualifications and Skills
51
o Vacancies
53
-
A Future View of the AgriFood Tech Sector
59
-
Views from Stakeholder Consultations
66
o AgriFood Tech survey findings
67
-
Appendices
77
o Appendix 1 - AgriFood Tech sector definition
78
o Appendix 2 - AgriTech sector definition
81
2
Introduction to the Sector Data Pack
The role of the Sector Data Pack is to bring together the latest socio-economic and labour market data and present both an up-to-date, and
future view, of the sector and any underlying issues within the area that could impact upon it. Information and feedback collected from
stakeholder consultation (through workshops, meetings, and survey) is also presented and summarised (where available and applicable).
The Data Pack sits below the Sector Skills Plan, with the key findings from the data analysis helping to inform the priorities developed in the
plan. In most instances data has been analysed and presented down to local authority level. In some instances, and even where local authority
data is available, it has not been presented in the data pack due to issues of unreliability and small sample sizes. This is particularly the case
with data from the Annual Population Survey and the Annual Survey of Hours and Earnings.
Throughout the Data Pack findings are also presented for the areas of Lincolnshire (county), Greater Cambridge and Greater Peterborough
(GCGP) Local Enterprise Partnership (LEP), Greater Lincolnshire LEP (GLLEP), and South East LEP (SELEP). These comparator areas were
agreed in consultation with the AgriFood Tech sector group and New Anglia LEP officers.
Introduction to and Definition of the AgriFood Tech Sector
New Anglia is arguably the most productive farming region in the UK, with the most profitable farms, a dynamic food chain and the largest
concentration of agri-food research in Europe. New Anglia’s agriculture has a turnover of £1.65billion, including 52% of the UK sugar beet
production, 20% of its cereals, 21% of the pig herd and 21% of the duck, geese and turkey flocks.
Taking the tighter AgriFood Tech definition, which excludes food retail and catering, it can be broken down into three elements as follows:
AgriFood
In scope:
-
Agricultural, horticultural and forestry production (crops, livestock, ornamental crops, biomass and biofuels, renewable materials)
-
Food and drink processing (including artisan foods)
-
Input supplies (e.g. machinery, fertilisers, seeds, packaging etc.)
-
Food wholesaling and marketing
-
Food logistics
AgriTech (see full national definition in appendix 2)
In scope:
3
-
Plant genetic improvement; plant health; crop storage and silage
-
Animal genetic improvement; animal nutrition; animal health and welfare
-
ICT systems
-
Soil and substrate management; environmental interactions; harvest and early stage processing
-
Engineering and precision farming
-
Infrastructure
-
Advisory services
Food Tech:
-
Food production technology
-
Dietary health and consumer food technology
Full details of the Standard Industrial Classification codes that are used to captures these activities can be found in appendix 1.
4
Key Findings from the Data Analysis
-
The AgriFood Tech sector in New Anglia was worth over £2.5bn in 2015
-
This £2.5bn equates to just over 7 per cent of New Anglia’s economy total value, which is more than double what the sector is worth to
the national economy
-
Growth in value in the sector has been broadly in line with that of national and comparator area trends
-
50,000 people were employed in the sector in 2015, around 7.4 per cent of the total workforce, and of the comparator areas then only
Greater Lincolnshire has a higher proportion
-
Employment in the sector has fallen over the last five years whereas many of its comparators areas have experienced growth
-
Across New Anglia then some of the largest areas of employment such as Breckland, Mid Suffolk, and King’s Lynn and West Norfolk,
have experienced falls in employment
-
New Anglia’s AgriFood Tech sector Location Quotient is 1.9 which means that employment in the sector is nearly twice as important to
the local economy compared to the national level.
-
Mid Suffolk Coastal has the highest LQ of all the local authority districts at 4.0
-
Full time employment in the New Anglia AgriFood Tech sector has fallen over the last five years whereas many of its comparator areas
have experienced increases
-
There are 7,875 AgriFood Tech businesses in New Anglia and unlike employment, this number has grown between 2010 and 2015
albeit at a lower rate than all comparator areas
-
The proportion of New Anglia residents with higher level qualifications is increasing but remains below national averages
-
Growth in AgriFood Tech sector apprenticeships has been strong since 2006 and at a higher rate than both regionally and nationally
-
Employment in the sector is forecast to fall further, however, at the same time, replacement demand and expansion demand within
more skilled occupations will maintain and grow the demand for higher skills within both the sector and the New Anglia area.
-
With the projected drop in employment, by 2024 there is a potential gap (driven by retirements) in the New Anglia AgriFood Tech sector
workforce of 18,000
5
The AgriFood Tech Sector
in New Anglia
6
AgriFood Tech sector’s contribution to the local economy
The AgriFood Tech sector contributes the
10.8%
following to the New Anglia LEP economy:
-
Over 7 per cent total economic value
(Gross Value Added or GVA) generated,
which is over £2.5bn of the £35.5bn
generated by the New Anglia economy is
2015.
7.4%
7.1%
-
7.4 per cent of total employment
(675,500), equating to nearly 50,000
employees in 2015.
-
Nearly 11 per cent of businesses, 7,900
of the 72,900 businesses in New Anglia.
Sources: Sub-regional GVA; Business Register
and Employment Survey, UK Business Counts;
all Office for National Statistics; 2013
Agricultural Survey, Department for
Environment, Food, and Rural Affairs (Defra)
GVA
Employment
Businesses
Please note that values for GVA are based on the sectors of ‘Agriculture’, ‘Food products, beverages and tobacco’, and
a proportion of both ‘basic pharmaceutical products and preparations’ and ‘Transport and storage’. They have been
calculated by applying regional proportions of sectoral GVA at the New Anglia LEP level. Values for employment and
businesses based on the SIC codes detailed in the appendices.
7
AgriFood Tech sector’s contribution to growth in the local economy
(2010=100)
120
Growth in both GVA and business numbers in
the sector have been broadly in line with total
growth in New Anglia. Turning to employment,
then looking at the general trend it is one of low
110
but negative growth over the five year period in
question.
Sources: Sub-regional GVA; Business Register
100
and Employment Survey, UK Business Counts;
all Office for National Statistics; 2013
Agricultural Survey, Department for
Environment, Food, and Rural Affairs (Defra)
90
2010
2011
2012
2013
2014
2015
2016
AgriFoodTech GVA
AgriFoodTech Employment
AgriFoodTech Business
Total GVA
Total Employment
Total Business
8
AgriFood Tech
is more than
twice as
Proportion of total GVA generated by
AgriFood Tech sector across selected
important to
comparator areas, 2015
New Anglia as
10.0%
it is nationally
7.1%
4.4%
3.5%
New Anglia LEP
Lincolnshire
East of England
UK
Sources: Sub-regional Gross Value Added (GVA), Office for National Statistics
9
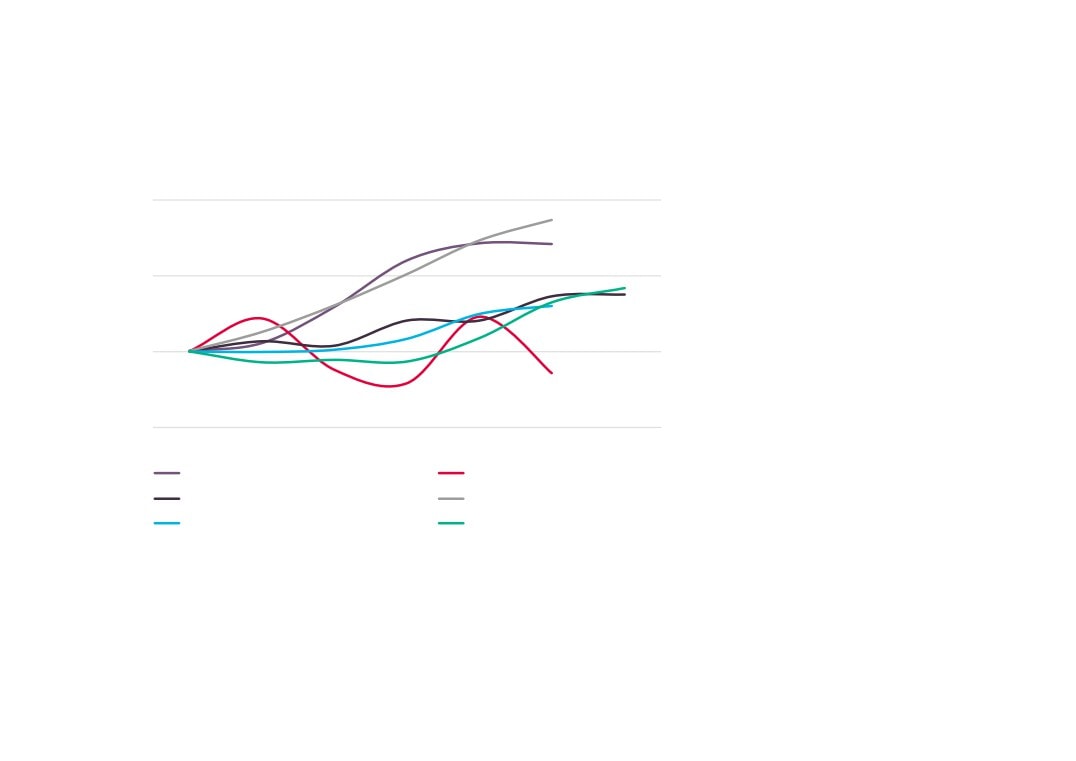
Trends in growth in
New Anglia’s
AgriFood Tech sector
have been broadly in
Change in AgriFood Tech sector GVA
line with that of
across comparator areas (2010 = 100)
comparator areas
125
120
115
110
105
100
95
90
2010
2011
2012
2013
2014
2015
New Anglia
Lincolnshire
East
UK
Sources: Sub-regional Gross Value Added (GVA), Office for National Statistics
10
50,000 people
Employment in the AgriFood Tech sector
were employed in
across comparator areas, 2015
New Anglia’s
New Anglia
50,000
AgriFood Tech
sector in 2015
Norfolk
26,800
Suffolk
23,200
Lincolnshire
41,100
GCGP
40,700
GLLEP
53,600
SELEP
62,900
Source: Business Register and Employment Survey 2015, Office for National Statistics, and
Agricultural Census 2013, Department for Environment, Food, and Rural Affairs (Defra)
11
In terms of
comparator areas
Proportion of employment provided by the
then only Greater
AgriFood Tech sector across comparator
Lincolnshire has a
areas, 2015
higher proportion
New Anglia
7.2%
of employment
provided by
Norfolk
7.2%
AgriFood Tech
Suffolk
7.1%
Lincolnshire
13.9%
GCGP
5.9%
GLLEP
12.2%
SELEP
3.9%
East of England
4.4%
England
3.9%
Source: Business Register and Employment Survey 2015, Office for National Statistics, and
Agricultural Census 2013, Department for Environment, Food, and Rural Affairs (Defra)
12
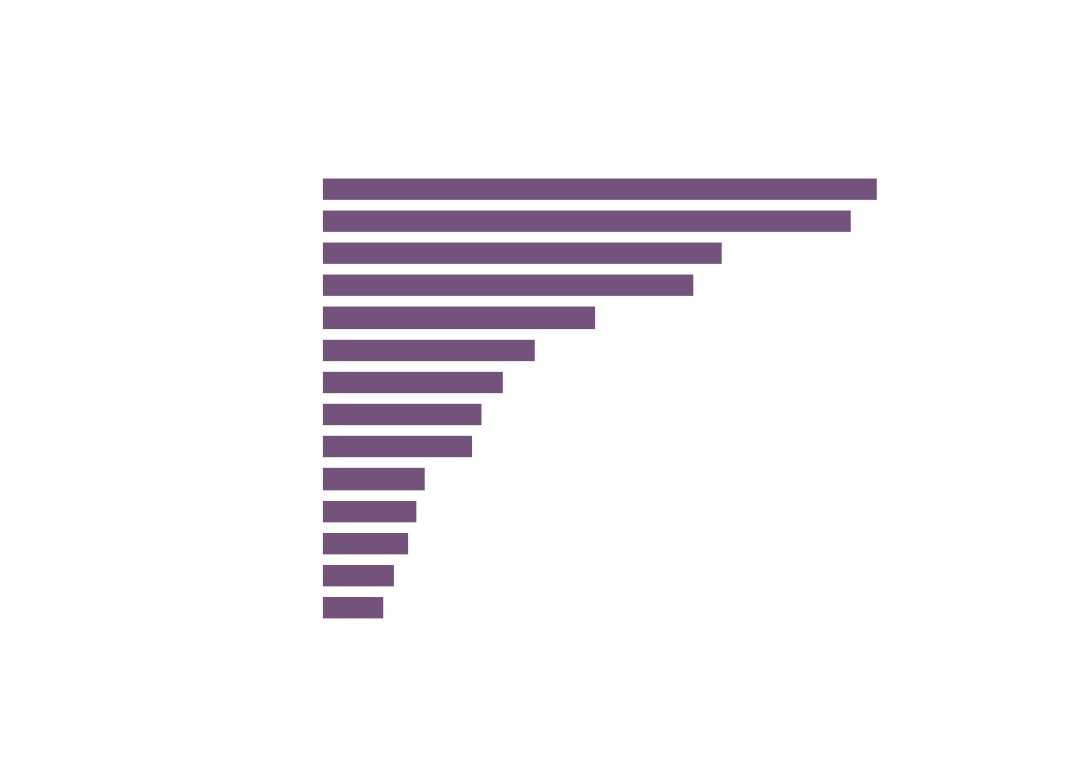
Employment in the AgriFood Tech sector across New Anglia, 2015
Breckland
6,600
Kings Lynn and West Norfolk
6,500
Mid Suffolk
5,700
St Edmundsbury
4,800
North Norfolk
4,500
Suffolk Coastal
3,600
Waveney
3,600
South Norfolk
3,500
Broadland
3,100
Babergh
2,300
Forest Heath
2,200
Norwich
1,800
Ipswich
1,000
Great Yarmouth
900
Source: Business Register and Employment Survey 2015, Office for National Statistics, and
Agricultural Census 2013, Department for Environment, Food, and Rural Affairs (Defra)
13
Proportion of employment provided by the AgriFood Tech sector across comparator areas, 2015
Mid Suffolk
15.3%
North Norfolk
12.8%
Breckland
12.8%
Kings Lynn and West Norfolk
11.3%
Waveney
8.6%
Forest Heath
8.6%
St Edmundsbury
7.5%
Babergh
7.0%
Suffolk Coastal
6.9%
South Norfolk
6.5%
Broadland
6.4%
Great Yarmouth
2.4%
Norwich
2.0%
Ipswich
1.5%
Source: Business Register and Employment Survey 2015, Office for National Statistics, and
Agricultural Census 2013, Department for Environment, Food, and Rural Affairs (Defra)
14
Change in AgriFood Tech sector employment
across comparator areas, 2010 - 2015
New Anglia
-3%
Norfolk
-1%
Suffolk
-5%
Lincolnshire
8%
GCGP
-2%
GLLEP
5%
SELEP
7%
East of England
-1%
England
5%
Source: Business Register and Employment Survey 2015, Office for National Statistics, and
Agricultural Census 2013, Department for Environment, Food, and Rural Affairs (Defra)
15
Change in AgriFood Tech sector employment
across New Anglia, 2010 - 2015
Babergh
-9%
Breckland
11%
Broadland
-14%
Forest Heath
13%
Great Yarmouth
-26%
Ipswich
1%
King`s Lynn
and West Norfolk
-5%
Mid Suffolk
-12%
North Norfolk
11%
Norwich
-16%
South Norfolk
3%
St Edmundsbury
-8%
Suffolk Coastal
3%
Waveney
-4%
Source: Business Register and Employment Survey 2015, Office for National Statistics, and
Agricultural Census 2013, Department for Environment, Food, and Rural Affairs (Defra)
16
AgriFood Tech sector employment split by sub-sector across comparator areas, 2015
80%
100%
New Anglia
92%
7%
Norfolk
91%
9%
Suffolk
94%
6%
Lincolnshire
94%
6%
1%
GCGP
89%
10%
1%
GLLEP
94%
5%
1%
SELEP
92%
8%
East of
91%
8%
1%
England
England
93%
6%
AgriFood
AgriTech
FoodTech
Source: Business Register and Employment Survey 2015, Office for National Statistics, and
Agricultural Census 2013, Department for Environment, Food, and Rural Affairs (Defra)
17
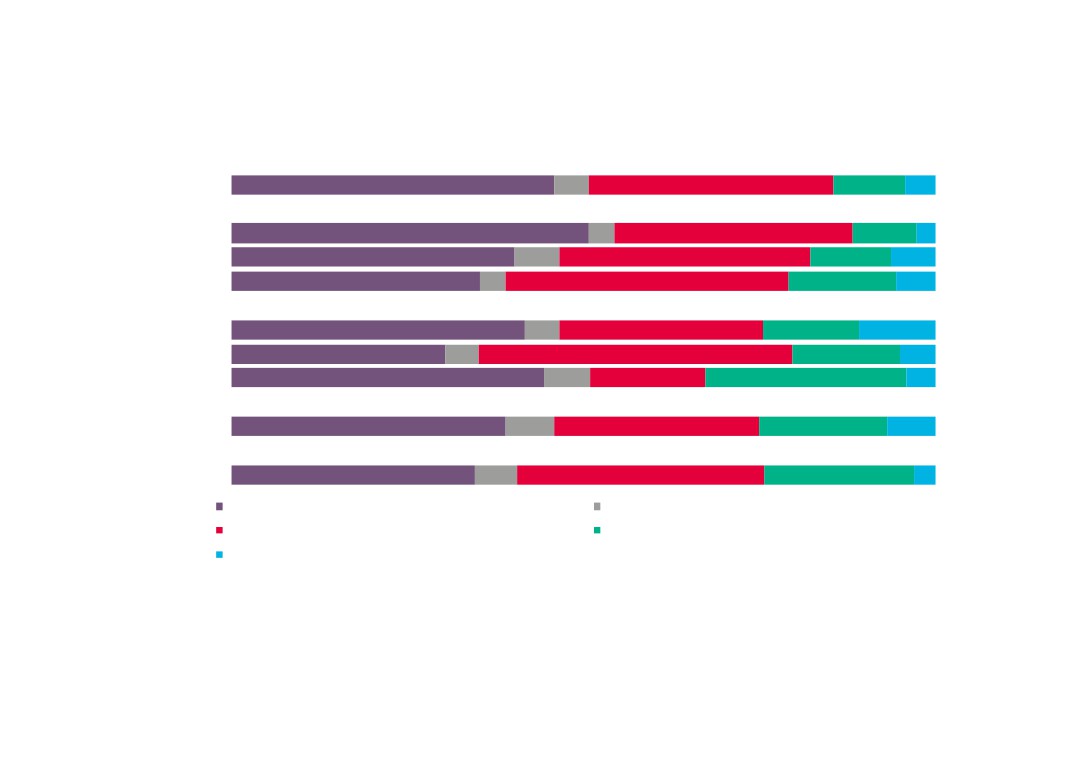
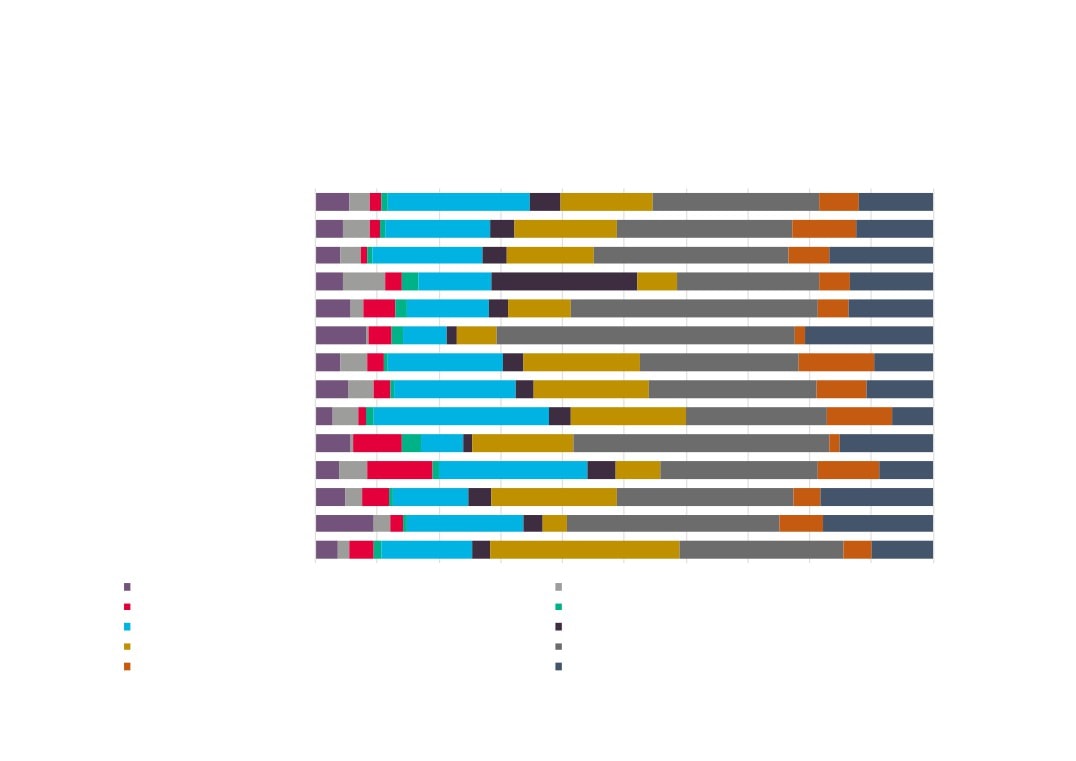
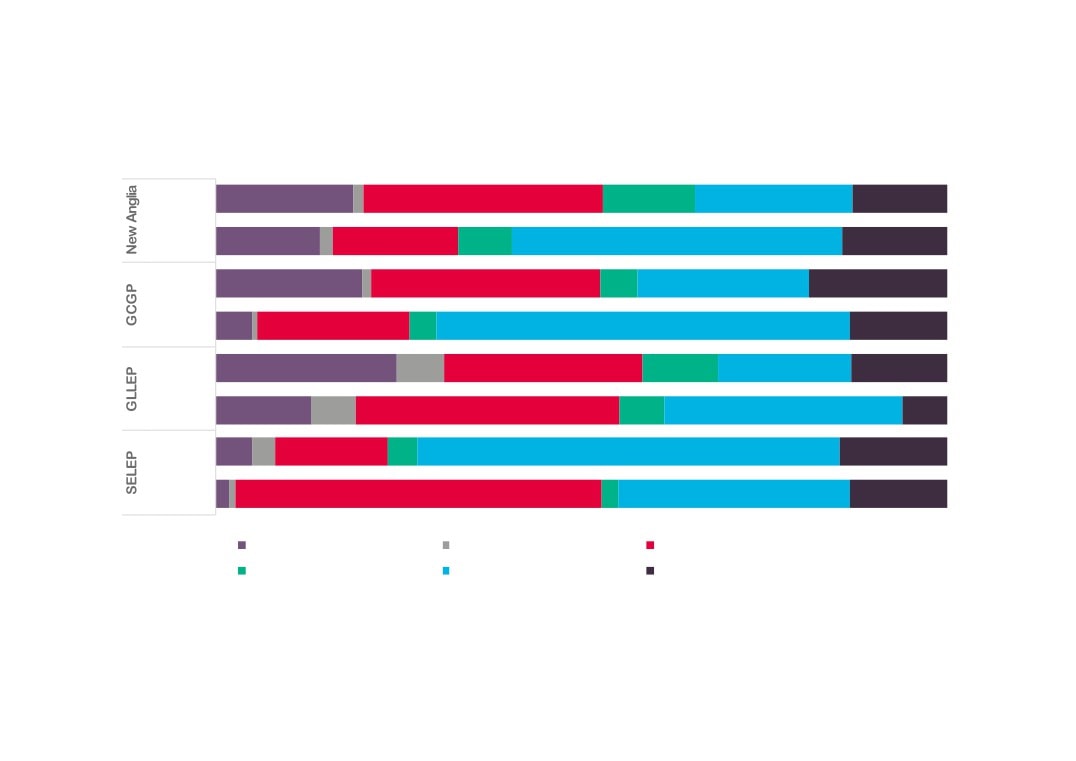
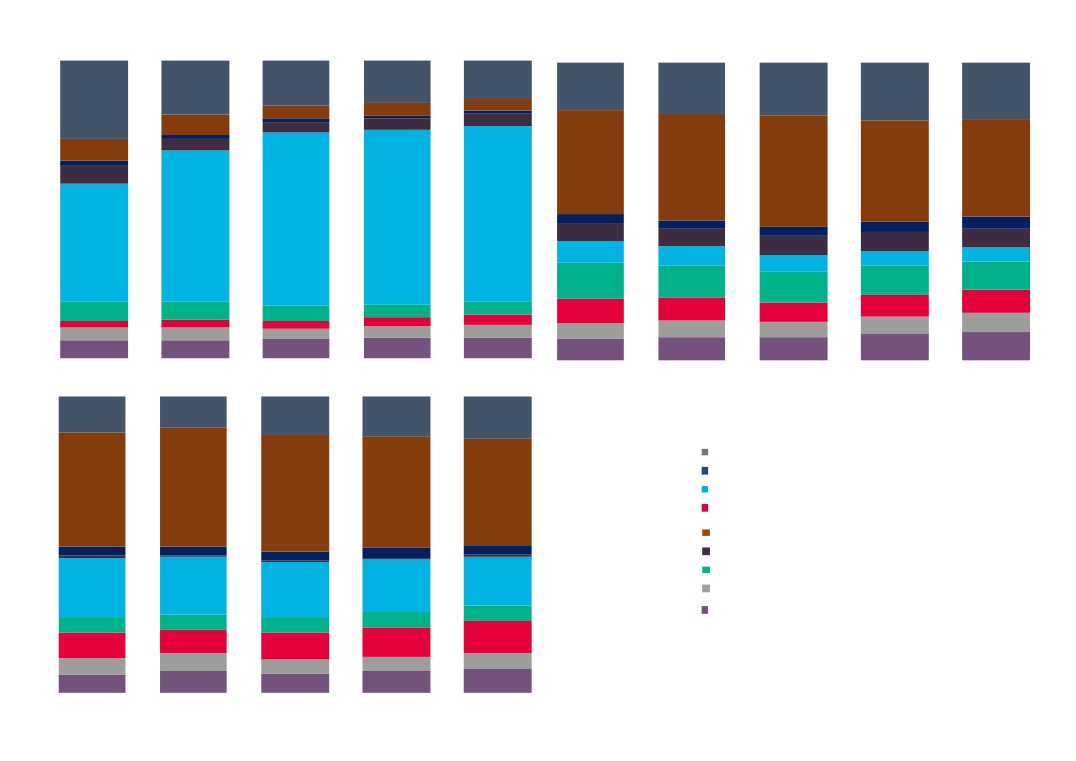
AgriFood sector employment split by sub-sector across comparator areas, 2015
New Anglia
46%
5%
35%
10%
5%
Norfolk
51%
4%
34%
9%
3%
Suffolk
40%
6%
35%
12%
6%
Lincolnshire
35%
4%
40%
15%
6%
GCGP
42%
5%
29%
14%
11%
GLLEP
30%
5%
44%
15%
5%
SELEP
44%
7%
16%
28%
4%
East of
39%
7%
29%
18%
7%
England
England
35%
6%
35%
21%
3%
Agricultural, horticultural and forestry production
Food logistics
Food processing
Food wholesaling and marketing
Input supplies
Source: Business Register and Employment Survey 2015, Office for National Statistics, and
Agricultural Census 2013, Department for Environment, Food, and Rural Affairs (Defra)
18
AgriFood Tech sector employment split by sub-sector across New Anglia, 2015
70%
100%
Babergh
91%
9%
Breckland
93%
7%
Broadland
92%
7%
Forest Heath
89%
11%
Great Yarmouth
86%
14%
Ipswich
94%
6%
King`s Lynn and West Norfolk
94%
5%
1%
Mid Suffolk
95%
4%
1%
North Norfolk
93%
7%
Norwich
79%
21%
South Norfolk
86%
14%
St Edmundsbury
95%
5%
Suffolk Coastal
90%
10%
Waveney
98%
2%
AgriFood
AgriTech
FoodTech
Source: Business Register and Employment Survey 2015, Office for National Statistics, and
Agricultural Census 2013, Department for Environment, Food, and Rural Affairs (Defra)
19
AgriFood sector employment split by sub-sector across New Anglia, 2015
Babergh
62%
4%
25%
7%
2%
Breckland
44%
4%
43%
6%
2%
Broadland
40%
2%
47%
9%
2%
Forest Heath
63%
2%
23%
10%
Great Yarmouth
55%
11%
13%
21%
Ipswich
9%
5%
44%
41%
King`s Lynn and West Norfolk
58%
3%
26%
7%
5%
Mid Suffolk
40%
6%
33%
12%
9%
North Norfolk
55%
3%
31%
7%
4%
Norwich
6%
63%
30%
South Norfolk
76%
4%
12%
8%
St Edmundsbury
23%
4%
59%
8%
5%
Suffolk Coastal
64%
19%
11%
6%
Waveney
25%
1%
66%
7%
Agricultural, horticultural and forestry production Food logistics
Food processing
Food wholesaling and marketing
Input supplies
Source: Business Register and Employment Survey 2015, Office for National Statistics, and
Agricultural Census 2013, Department for Environment, Food, and Rural Affairs (Defra)
20
Top 10 AgriFood Tech sub sectors,
2015
% of total
Change in
Industry Sector Code
Industry Sector Name
Employment AgriFoodTech sector
employment 2010 -
employment
2015
01000
DEFRA/Scottish Executive Agricultural Data
20,600
41%
1%
10120
Processing and preserving of poultry meat
4,300
9%
52%
10130
Production of meat and poultry meat products
3,000
6%
-30%
49410
Freight transport by road
2,200
4%
4%
28302
Manufacture of agricultural and forestry machinery (other than agricultu
1,400
3%
-6%
46610
Wholesale of agricultural machinery, equipment and supplies
1,400
3%
-8%
46390
Non-specialised wholesale of food, beverages and tobacco
1,200
2%
-27%
11050
Manufacture of beer
1,200
2%
85%
46210
Wholesale of grain, unmanufactured tobacco, seeds and animal feeds
800
2%
-40%
10850
Manufacture of prepared meals and dishes
700
1%
219%
Source: Business Register and Employment Survey 2015, Office for National Statistics, and
Agricultural Census 2013, Department for Environment, Food, and Rural Affairs (Defra)
21
Top growth AgriFood Tech sub sectors with 100 employees or more
% of total
Change in
Industry Sector Code
Industry Sector Name
Employment AgriFoodTech sectoemployment
employment
2010 - 2015
10850
Manufacture of prepared meals and dishes
700
1%
219%
Agents involved in the sale of agricultural raw materials, live animals,
46110
100
0%
178%
textile raw materials and semi-finished goods
10520
Manufacture of ice cream
100
0%
124%
77310
Renting and leasing of agricultural machinery and equipment
100
0%
92%
11050
Manufacture of beer
1,200
2%
85%
46170
Agents involved in the sale of food, beverages and tobacco
100
0%
83%
46370
Wholesale of coffee, tea, cocoa and spices
100
0%
78%
82920
Packaging activities
100
0%
75%
01640
Seed processing for propagation
100
0%
72%
01621
Farm animal boarding and care
300
1%
54%
10120
Processing and preserving of poultry meat
4,300
9%
52%
Source: Business Register and Employment Survey, Office for National Statistics, and
Agricultural Census, Department for Environment, Food, and Rural Affairs (Defra)
22
Employment in the
AgriFood Tech
AgriFood Tech sector location quotients
across comparator areas, 2015
sector is nearly
twice as important
New Anglia
1.9
locally as it is
nationally
Norfolk
1.9
Suffolk
1.9
Lincolnshire
3.6
Location quotients (LQs) are a
GCGP
1.5
useful way of showing a sectors
importance to the local economy
GLLEP
3.2
relative to the national picture. The
analysis presented here uses
SELEP
1.0
employment with an LQ above 1
showing a higher concentration than
nationally, and an LQ of below than
1 a lower concentration.
East of England
1.1
Source: Business Register and Employment Survey, Office for National Statistics, and
Agricultural Census, Department for Environment, Food, and Rural Affairs (Defra)
23
AgriFood Tech sector location quotients
across New Anglia, 2015
Breckland
3.3
Broadland
1.7
Great Yarmouth
0.6
Kings Lynn and West Norfolk
2.9
North Norfolk
3.3
Norwich
0.5
South Norfolk
1.7
Babergh
1.8
Forest Heath
2.2
Ipswich
0.4
Mid Suffolk
4.0
St Edmundsbury
1.9
Suffolk Coastal
1.8
Waveney
2.2
Source: Business Register and Employment Survey, Office for National Statistics, and
Agricultural Census, Department for Environment, Food, and Rural Affairs (Defra)
24
AgriFood Tech sub sectors with location quotients (LQs) above 3
% of total
Industry Sector Code
Industry Sector Name
Employment AgriFoodTech sector LQ
employment
11060
Manufacture of malt
500
1%
19.1
10810
Manufacture of sugar
700
1%
17.0
01640
Seed processing for propagation
100
0%
14.5
28302
Manufacture of agricultural and forestry machinery (other than agricultural
1,400
3%
9.2
10120
Processing and preserving of poultry meat
4,300
9%
8.6
20200
Manufacture of pesticides and other agrochemical products
400
1%
6.9
11030
Manufacture of cider and other fruit wines
200
0%
4.8
10130
Production of meat and poultry meat products
3,000
6%
4.5
11050
Manufacture of beer
1,200
2%
3.5
46610
Wholesale of agricultural machinery, equipment and supplies
1,400
3%
3.3
10920
Manufacture of prepared pet foods
500
1%
3.3
46210
Wholesale of grain, unmanufactured tobacco, seeds and animal feeds
800
2%
3.3
10320
Manufacture of fruit and vegetable juice
100
0%
3.2
10840
Manufacture of condiments and seasonings
600
1%
3.0
Source: Business Register and Employment Survey, Office for National Statistics, and
Agricultural Census, Department for Environment, Food, and Rural Affairs (Defra)
25
AgriFood Tech sector employment by full-time / part-time
split across comparator areas, 2015
0%
100%
New Anglia
90%
10%
Norfolk
90%
10%
Suffolk
89%
11%
Lincolnshire
92%
8%
GCGP
91%
9%
GLLEP
90%
10%
SELEP
88%
12%
East of England
90%
10%
England
88%
12%
Full time
Part time
Source: Business Register and Employment Survey, Office for National Statistics
26
0%
100%
Babergh
90%
10%
Breckland
90%
10%
AgriFood Tech sector
Broadland
90%
10%
employment by full-time /
Forest Heath
85%
15%
part-time split across
Great Yarmouth
82%
18%
Ipswich
84%
16%
New Anglia, 2015
Of particular note here is that those areas with
King`s Lynn and West Norfolk
93%
7%
high levels of employment in the sector tend to
be geared towards more full time employment,
Mid Suffolk
94%
6%
for example Mid Suffolk and King’s Lynn and
North Norfolk
93%
7%
West Norfolk.
Norwich
90%
10%
Please note that this analysis does include Defra
Agricultural Census data.
South Norfolk
87%
13%
Source: Business Register and Employment
St Edmundsbury
91%
9%
Survey, Office for National Statistics
Suffolk Coastal
87%
13%
Waveney
85%
15%
Full time
Part time
27
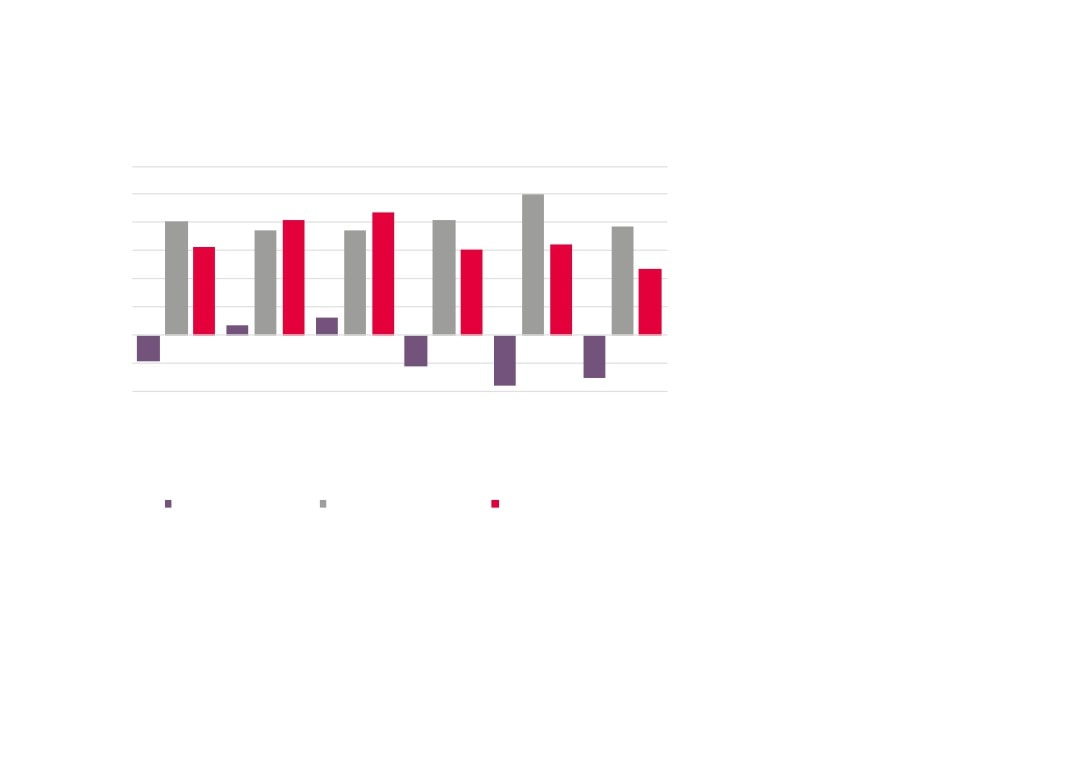
Change in AgriFood Tech sector full-time and part-time
employment across comparator areas, 2010-2015
-15%
-10%
-5%
0%
5%
10%
15%
20%
25%
New Anglia
Norfolk
Suffolk
Lincolnshire
GCGP
GLLEP
SELEP
East of England
England
Full time
Part time
Source: Business Register
Please note that this analysis
and Employment Survey,
does not include the Defra
Office for National Statistics
Agricultural Census data.
28
Change in AgriFood Tech sector full-time and part-time
employment across New Anglia, 2010-2015
-40%
-20%
0%
20%
40%
60%
80%
100%
120%
Babergh
Breckland
Broadland
Forest Heath
Great Yarmouth
Ipswich
King`s Lynn and West Norfolk
Source: Business Register
Mid Suffolk
and Employment Survey,
Office for National Statistics
North Norfolk
Norwich
South Norfolk
St Edmundsbury
Suffolk Coastal
Waveney
Full time
Part time
It is worth noting here that both Mid Suffolk and King’s Lynn and West Norfolk, which made up two of the top
three local authority areas for employment numbers in the sector, have experienced declines in both full time
and part time employment. In contrast, Breckland, which had the highest number for employment in the
sector, has experienced growth in both full and part time employment in the sector over the same period.
Please note again that this analysis does not include the Defra Agricultural Census data.
29
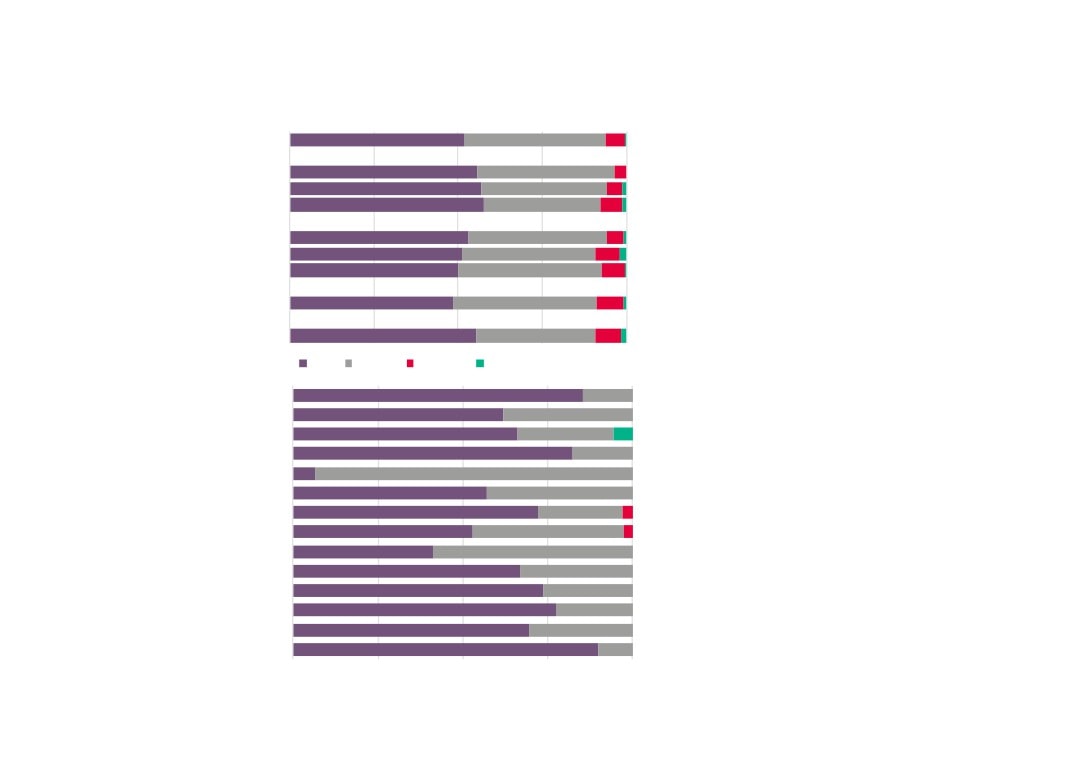
Male and Female employment in the AgriFood Tech
Sector and Top 5 Occupations for Employment
0%
50%
100%
Total
52%
48%
AgriFood Tech
73%
27%
Total
83%
17%
AgriFood Tech
83%
17%
Total
76%
24%
AgriFood Tech
76%
24%
Source: UKCES
Working Futures
2014 - 2024
Total
93%
7%
AgriFood Tech
95%
5%
Total
78%
22%
AgriFood Tech
71%
29%
Total
49%
51%
AgriFood Tech
67%
33%
Male Female
Self-employment in the AgriFood Tech sector
All Sectors
86%
14%
Source: New Anglia LEP Economic Strategy evidence base
work
AgriFood Tech
87%
13%
Employees
Self Employment
31
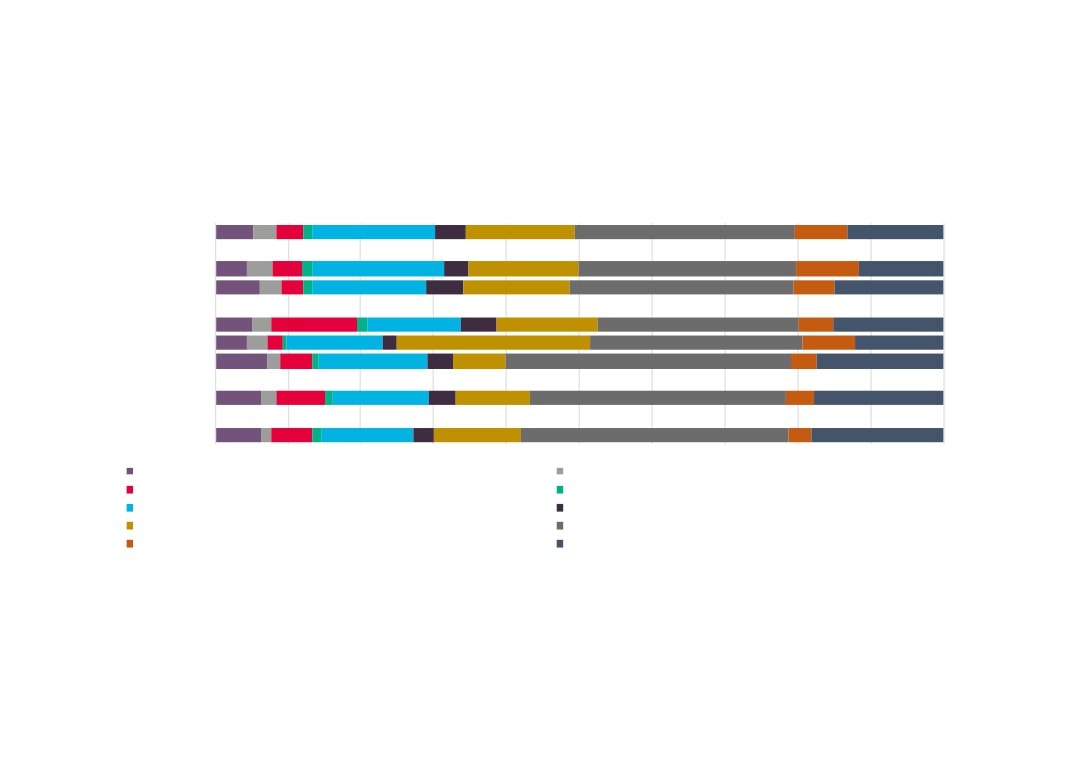
Workplace AgriFood Tech employment 2011 by broad Standard
Occupational Classification (SOC) across comparator areas
0%
10%
20%
30%
40%
50%
60%
70%
80%
90%
100%
New Anglia
Norfolk
Suffolk
GCGP
GLLEP
SELEP
East of England
England
116 Managers and Directors in Transport and Logistics
121 Managers and Proprietors in Agriculture Related Services
211 Natural and Social Science Professionals
214 Conservation and Environment Professionals
511 Agricultural and Related Trades
613 Animal Care and Control Services
811 Process Operatives
821 Road Transport Drivers
911 Elementary Agricultural Occupations
926 Elementary Storage Occupations
Source: 2011 Census, Office for National Statistics
32
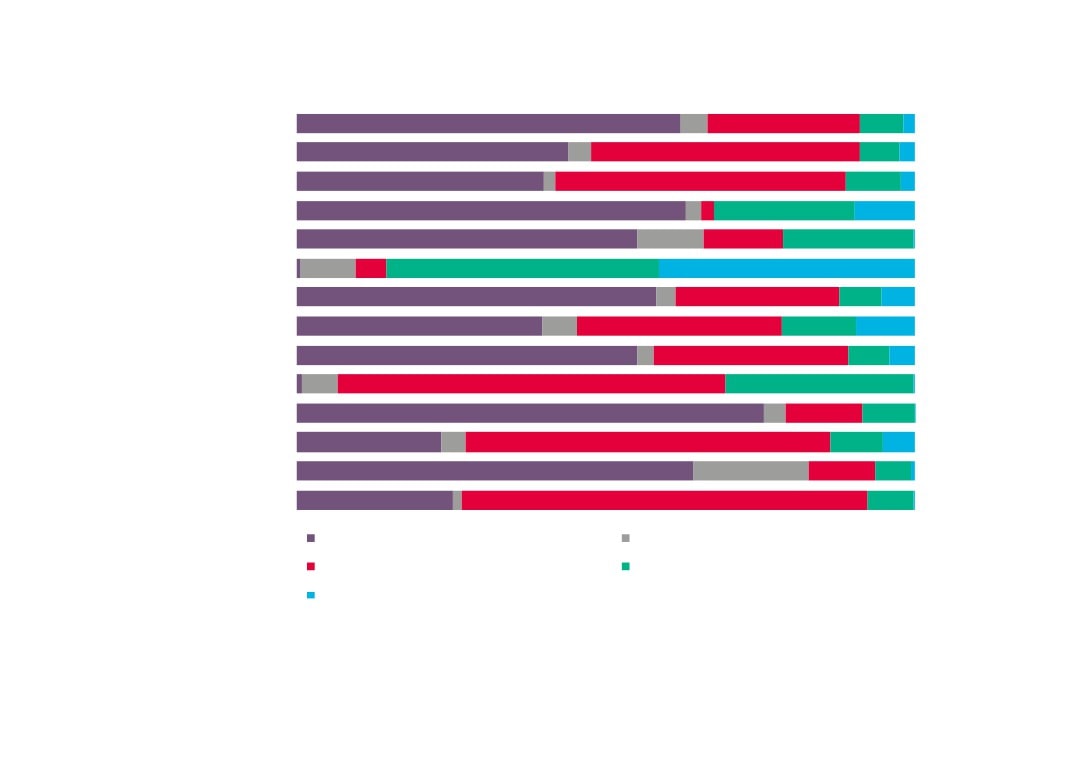
Workplace AgriFood Tech employment 2011 by broad Standard
Occupational Classification (SOC) across New Anglia
0%
10%
20%
30%
40%
50%
60%
70%
80%
90%
100%
Babergh
Breckland
Broadland
Forest Heath
Great Yarmouth
Ipswich
King`s Lynn and West Norfolk
Mid Suffolk
North Norfolk
Norwich
South Norfolk
St Edmundsbury
Suffolk Coastal
Waveney
116 Managers and Directors in Transport and Logistics
121 Managers and Proprietors in Agriculture Related Services
211 Natural and Social Science Professionals
214 Conservation and Environment Professionals
511 Agricultural and Related Trades
613 Animal Care and Control Services
811 Process Operatives
821 Road Transport Drivers
911 Elementary Agricultural Occupations
926 Elementary Storage Occupations
Source: 2011 Census, Office for National Statistics
33
AgriFood Tech sector business numbers across
comparator areas, 2016
48
New Anglia LEP
7,875
49
No
Norfolkrfolk
4,345
Number of
Business Units
47
Su
Suffolkffolk
3,515
71
LiLincolnshirere
5,200
42
G
GCGPLEP
6,015
59
G
6,270
GLLEPLEP
23
So
SELEPEast
9,655
Number of Business
Units per 10,000
Population
30
East
of England
Source: UK Business Counts, and
Sub-national Population Estimates,
27
EngEngl
Office for National Statistics
and
34
AgriFood Tech sector business numbers across
New Anglia, 2016
Ipswich
95
100
Norwich
Breckland, King’s Lynn and West Norfolk,
and Mid Suffolk again all make up the top
Great Yarmouth
160
three (as they did for employment) though
with less of a margin against other areas
Forest Heath
320
which suggests that this is where the
larger employers in the sector are
Waveney
355
situated.
St Edmundsbury
475
Broadland
475
Babergh
505
North Norfolk
695
Suffolk Coastal
725
South Norfolk
880
Mid Suffolk
920
King`s Lynn and West Norfolk
930
Breckland
935
Source: UK Business Counts, Office for National Statistics
35
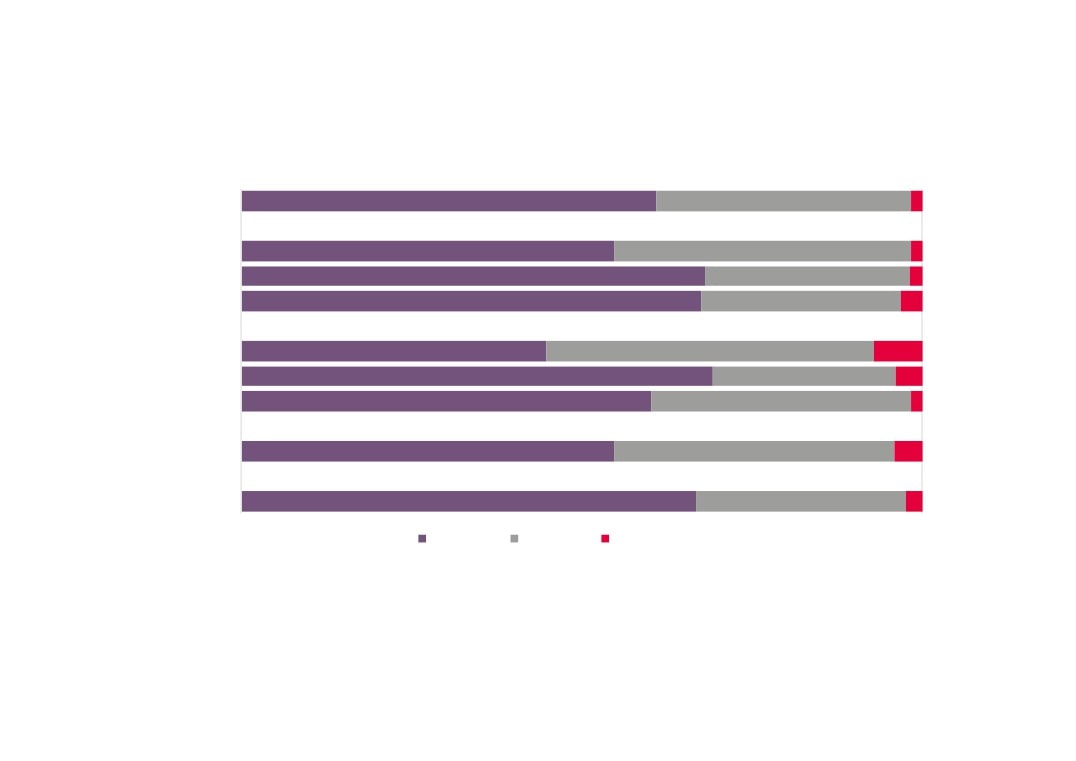
80%
85%
90%
95%
100%
New Anglia
90%
8%
1%
AgriFood Tech sector business
Norfolk
91%
8%
1%
numbers by size across
Suffolk
91%
7%
1%
Lincolnshire
91%
7%
1%
comparator areas, 2016
Source: UK Business Counts, Office for
GCGP
91%
8%
1%
National Statistics
GLLEP
90%
8%
1%
SELEP
90%
8%
1%
At LEP and County level then there is very little
East of England
90%
8%
2%
to choose between areas in terms of the make-
up of businesses by employee numbers.
England
91%
7%
2%
However, as noted previously, Mid Suffolk, and
King’s Lynn and West Norfolk feature with
No. of employees
0-9
10-49
50-249
250+
notable groupings of businesses employing 50
to 249 people. St. Edmundsbury also features in
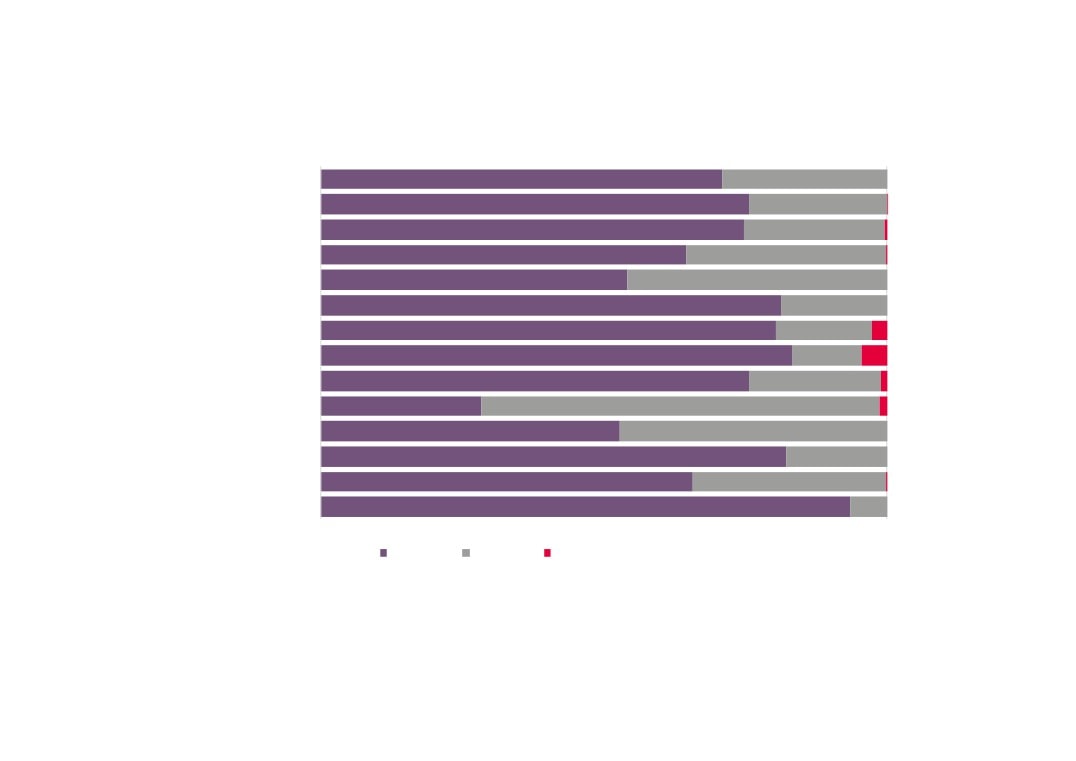
Waveney
97%
3%
terms of the presence of some 250 plus
Suffolk Coastal
92%
8%
employee businesses. Please note that at Local
St Edmundsbury
93%
6%
1%
Authority level, numbers of businesses
South Norfolk
96%
4%
employing more than 250 people can be
rounded out of analysis due to their very small
Norwich
81%
19%
numbers and resulting disclosive nature.
North Norfolk
91%
9%
Mid Suffolk
94%
5%
King`s Lynn and West Norfolk
91%
9%
AgriFood Tech sector
Ipswich
88%
12%
business numbers by size
Great Yarmouth
93%
7%
Forest Heath
95%
5%
across New Anglia, 2016
Broadland
95%
5%
Source: UK Business Counts, Office for
Breckland
94%
6%
National Statistics
Babergh
98%
2%
80%
85%
90%
95%
100%
0-9
10-49
50-249
250+
Change in AgriFood Tech business units
across comparator areas, 2010 - 2016
New Anglia
7.4%
Norfolk
6.6%
Suffolk
8.3%
Lincolnshire
11.6%
GCGP
8.7%
GLLEP
10.9%
SELEP
11.6%
East of England
10.1%
England
13.3%
Source: UK Business Counts, Office for National Statistics
37
Babergh
2%
Breckland
12%
Change in AgriFood Tech
Broadland
2%
business units across
Forest Heath
19%
New Anglia, 2010 - 2016
Great Yarmouth
-9%
Below the New Anglia geography then we can
Ipswich
90%
observe some very different fortunes in business
growth across the local authorities. However,
King`s Lynn and West Norfolk
3%
please note the small bases for measuring
change here. Ipswich in particular has seen
business unit numbers increase by 90 per cent
Mid Suffolk
5%
but from a comparatively small base.
The largest employment and business areas of
North Norfolk
-1%
Breckland, King’s Lynn and West Norfolk, and
Mid Suffolk, all experienced growth in business
Norwich
-17%
unit numbers over the period in question.
South Norfolk
12%
Source: UK Business Counts, Office for
National Statistics
St Edmundsbury
12%
Suffolk Coastal
11%
Waveney
-1%
38
NINo registrations to adult overseas nationals entering the UK
over time, New Anglia
14,000
12,000
10,000
8,000
6,000
4,000
2,000
0
2002
2003
2004
2005
2006
2007
2008
2009
2010
2011
2012
2013
2014
2015
2016
Source: Department for Work and Pensions
39
Change in NINo registrations to adult overseas nationals entering
the UK over time, New Anglia, 2002 = 100
350
300
250
200
150
100
50
2002
2003
2004
2005
2006
2007
2008
2009
2010
2011
2012
2013
2014
2015
2016
New Anglia
Norfolk
Suffolk
East of England
England
Source: Department for Work and Pensions
40
0%
100%
2002
New Anglia
25%
49%
17%
7%
East of England
28%
48%
16%
5%
Change in the
demographic of NINo
England
30%
49%
14%
5%
registrations to adult
Less than 18
18-24
25-34
35-44
45-54
55-59
60 and over
overseas nationals
entering the UK over
New Anglia
34%
36%
17%
9%
time, New Anglia
Source: Department for Work and Pensions
East of England
33%
37%
17%
8%
England
33%
38%
17%
8%
2016
Less than 18
18-24
25-34
35-44
45-54
55-59
60 and over
41
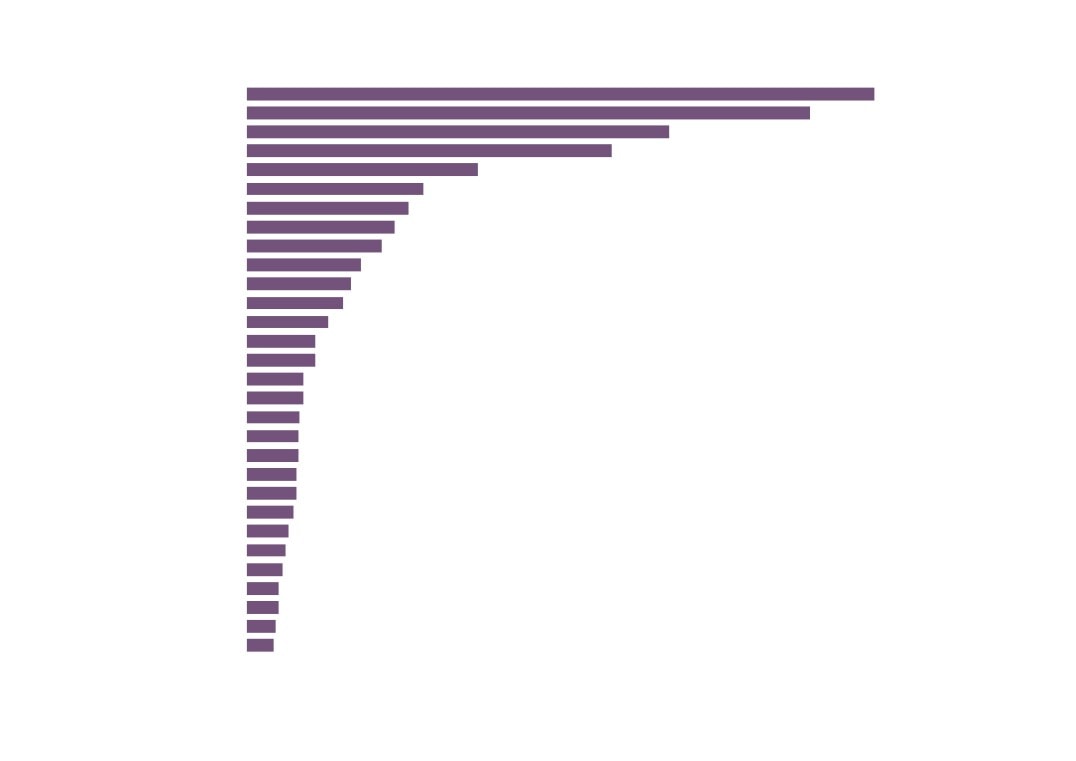
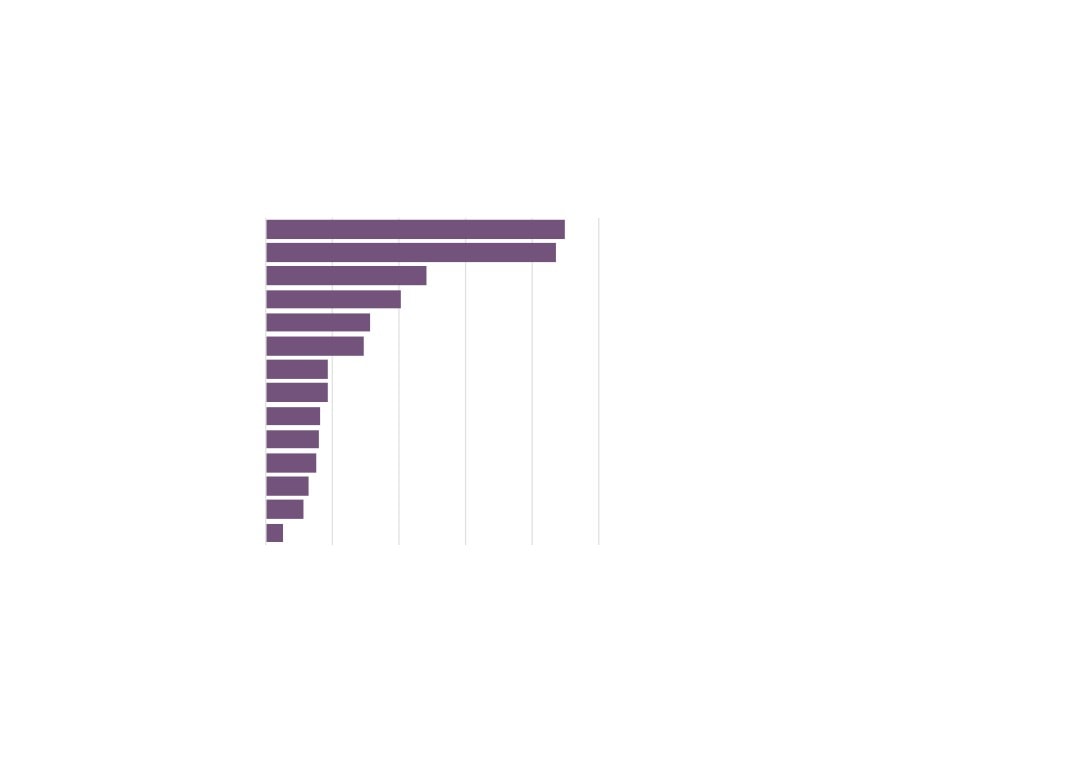
NINo registrations to adult overseas nationals entering the UK,
2002 - 2016, across New Anglia
Norwich
25,019
Ipswich
23,841
King's Lynn and West Norfolk
18,029
Breckland
16,759
Great Yarmouth
12,307
Forest Heath
9,590
St Edmundsbury
8,155
Suffolk Coastal
7,195
North Norfolk
6,747
Waveney
4,644
South Norfolk
4,234
Babergh
3,846
Broadland
3,221
Mid Suffolk
2,758
Source: Department for Work and Pensions
42
Total Export levels to EU and Non-EU
countries across comparator areas, 2015
New Anglia
£1,611m
£1,286m
GCGP
£2,546m
£2,596m
GLLEP
£1,831m
£1,078m
SELEP
£4,662m
£6,383m
EU Non-EU
Source: 2015 Growth Hub Data - Exports, HM Revenues and Customs
43
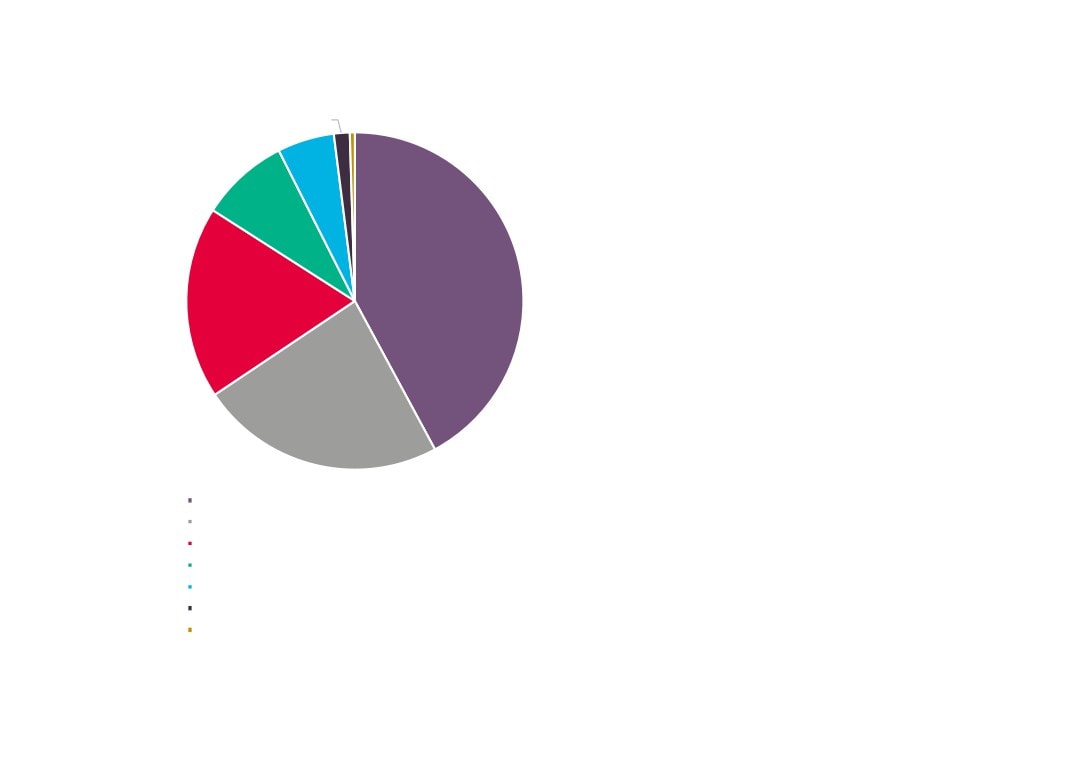
New Anglia export levels by type, 2015
0 Food and Live Animals
£479m
1 Beverages and Tobacco
£23m
2 Crude Materials
£45m
5 Chemicals
£738m
6 Manufactured Goods
£295m
7 Machinery and Transport
£910m
8 Miscellaneous Manufactures
£388m
9 Other commodities nes
£15m
Source: 2015 Growth Hub Data - Exports, HM Revenues and Customs
44
Proportion of exports by type across
comparator areas, 2015
New Anglia
17%
25%
10%
31%
13%
GCGP
12%
26%
4%
40%
16%
Please note that
analysis for the GLLEP
GLLEP
13%
5%
22%
6%
18%
7%
does not equal 100%
due to some withheld
data
SELEP
3%
35%
3%
42%
14%
0 Food and Live Animals
1 Beverages and Tobacco
2 Crude Materials
5 Chemicals
6 Manufactured Goods
7 Machinery and Transport
8 Miscellaneous Manufactures
9 Other commodities nes
Source: 2015 Growth Hub Data - Exports, HM Revenues and Customs
45
New Anglia export levels by type and EU and Non-
EU countries across comparator areas, 2015
0 Food and Live Animals
£300m
£179m
2 Crude Materials
5 Chemicals
£522m
£216m
6 Manufactured Goods
£203m
£92m
7 Machinery and Transport
£342m
£568m
8 Miscellaneous Manufactures
£203m
£180m
EU Non-EU
Source: 2015 Growth Hub Data - Exports, HM Revenues and Customs
46
Proportion of exports by type and EU and Non-
EU countries across comparator areas, 2015
EU
11%
1%
18%
7%
12%
7%
Non-EU
6%
1%
8%
3%
20%
6%
EU
10%
1%
15%
2%
12%
9%
Non-EU
3%
11%
2%
28%
7%
EU
12%
3%
14%
5%
9%
7%
Non-EU
7%
3%
18%
3%
16%
3%
EU
2%
1%
6%
2%
24%
6%
Non-EU
1%
29%
1%
18%
8%
0 Food and Live Animals
2 Crude Materials
5 Chemicals
6 Manufactured Goods
7 Machinery and Transport
8 Miscellaneous Manufactures
Source: 2015 Growth Hub Data - Exports, HM Revenues and Customs
47
Netherlands
£392m
USA
£352m
Irish Republic
£264m
Germany
£228m
France
£144m
Italy
£110m
Spain
£101m
Belgium
£92m
Japan
£84m
China
£71m
Saudi Arabia
£65m
Hong Kong
£60m
Sweden
£51m
Australia
£43m
UAE
£43m
Singapore
£35m
New Anglia total export levels by
South Korea
£35m
Poland
£33m
country, 2015
Denmark
£32m
India
£32m
Source: 2015 Growth Hub Data - Exports, HM Revenues and Customs
Norway
£31m
Egypt
£31m
Hungary
£29m
Portugal
£26m
Czech Republic
£24m
Canada
£22m
Turkey
£20m
Switzerland
£20m
South Africa
£18m
Malaysia
£17m
48
Selection of AgriFood Tech sector role wages - Mean gross annual pay all employees (UK)
£52,172
Production managers and directors in manufacturing (1121)
(4%)
£49,964
£36,076
(4%)
Managers and directors in transport and logistics (116)
£34,829
Figures in brackets
£27,564
(-7%)
denote percentage
Managers and proprietors in agriculture related services (121)
£29,509
change between 2014
£38,361
and 2016
Biological scientists and biochemists (2112)
(1%)
£37,988
£33,727
Conservation and environment professionals (214)
(10%)
£30,607
£24,411
(0.4%)
Transport and distribution clerks and assistants (4134)
£24,325
£26,798
Farmers (5111)
(18%
£22,772
)
£19,375
Horticultural trades (5112)
(10%
£17,607
)
2016
2014
£14,905
(-8%)
Animal care and control services (613)
£16,147
£18,516
Food, drink and tobacco process operatives (8111)
(2%)
Please note that mean wages have
£18,074
been used (as opposed to the
£27,018
(3%)
Large goods vehicle drivers (8211)
median, which is the preferable
£26,198
option of averaging wage levels)
£24,757
due to missing figures for median
Agricultural machinery drivers (8223)
(8%)
£22,975
values.
£17,640
(2%)
Source: Annual Survey of Hours and
Elementary agricultural occupations (911)
£17,231
Earnings, Office for National Statistics
£17,472
(2%)
Packers, bottlers, canners and fillers (9134)
£17,070
£19,460
(5%)
Elementary storage occupations (9260)
£18,539
49
AgriFood Tech sector wages - Mean gross annual pay full time employees (UK)
£57,155
Production managers and directors in manufacturing (1121)
(4%)
£55,137
£36,838
Managers and directors in transport and logistics (116)
(4%)
£35,456
£31,898
Managers and proprietors in agriculture related services (121)
(2%)
£31,314
£41,127
Biological scientists and biochemists (2112)
(-2%)
£41,755
£34,980
Conservation and environment professionals (214)
(7%)
£32,661
Figures in brackets
£25,800
(-0.1%)
Transport and distribution clerks and assistants (4134)
denote percentage
£25,835
change between 2014
£28,079
(6%)
and 2016
Farmers (5111)
£26,459
£20,213
Horticultural trades (5112)
(5%)
£19,173
£18,804
2016
2014
Animal care and control services (613)
(-0.5%)
£18,894
£19,807
(3%)
Food, drink and tobacco process operatives (8111)
£19,305
£27,757
Large goods vehicle drivers (8211)
(4%)
£26,704
Please note that mean wages have
£25,523
been used (as opposed to the
Agricultural machinery drivers (8223)
(4%)
£24,651
median, which is the preferable
option of averaging wage levels)
£19,776
(-0.2%)
Elementary agricultural occupations (911)
due to missing figures for median
£19,817
values.
£18,882
Packers, bottlers, canners and fillers (9134)
(3%)
Source: Annual Survey of Hours and
£18,259
Earnings, Office for National Statistics
£20,829
Elementary storage occupations (9260)
(5%)
£19,858
50
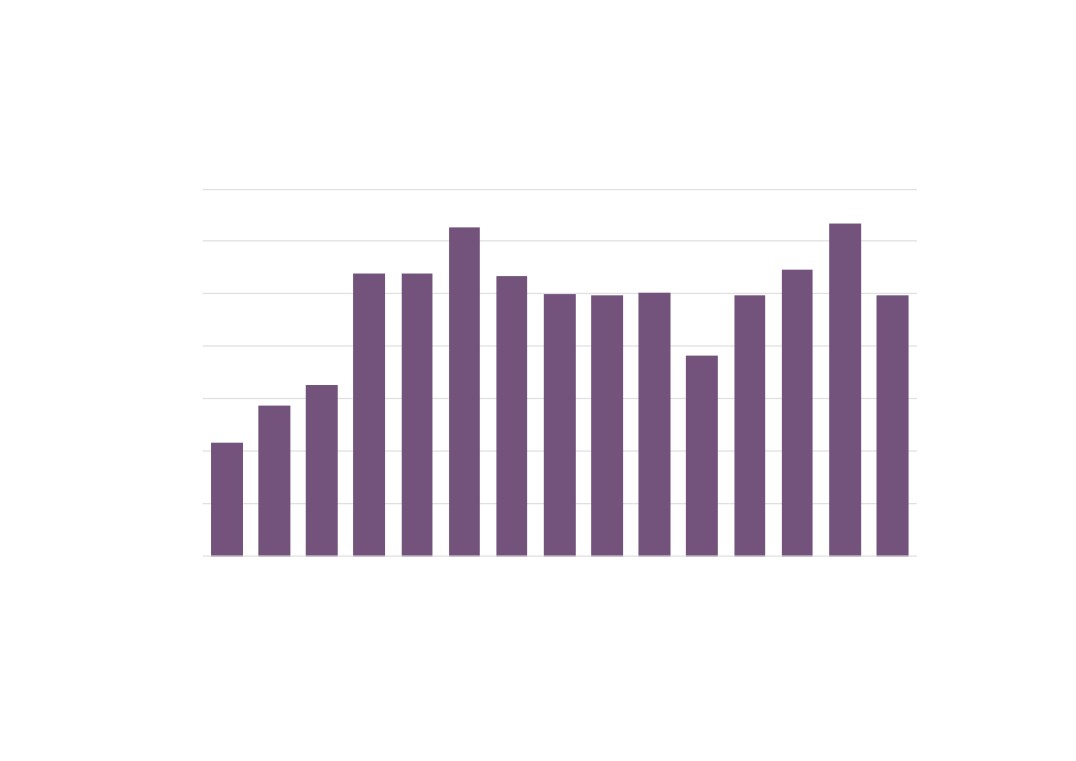
New Anglia AgriFood Tech Apprenticeships
2011/12
2012/13
2013/14
2014/15
Agriculture
115
130
150
150
Animal Care
15
15
15
15
Environmental Conservation
5
Food and Drink
155
145
150
215
Horticulture
55
85
65
85
International Trade and Logistics Operations
30
20
Land-based Engineering
30
40
Logistics Operations
15
10
5
15
Print and Printed Packaging
20
5
5
10
Supply Chain Management
5
10
Trees & Timber
5
5
15
5
Veterinary Nursing
20
15
20
15
Warehousing & Storage
100
95
90
80
Total
505
495
575
665
Source: Skills Funding Agency Data Cube
51
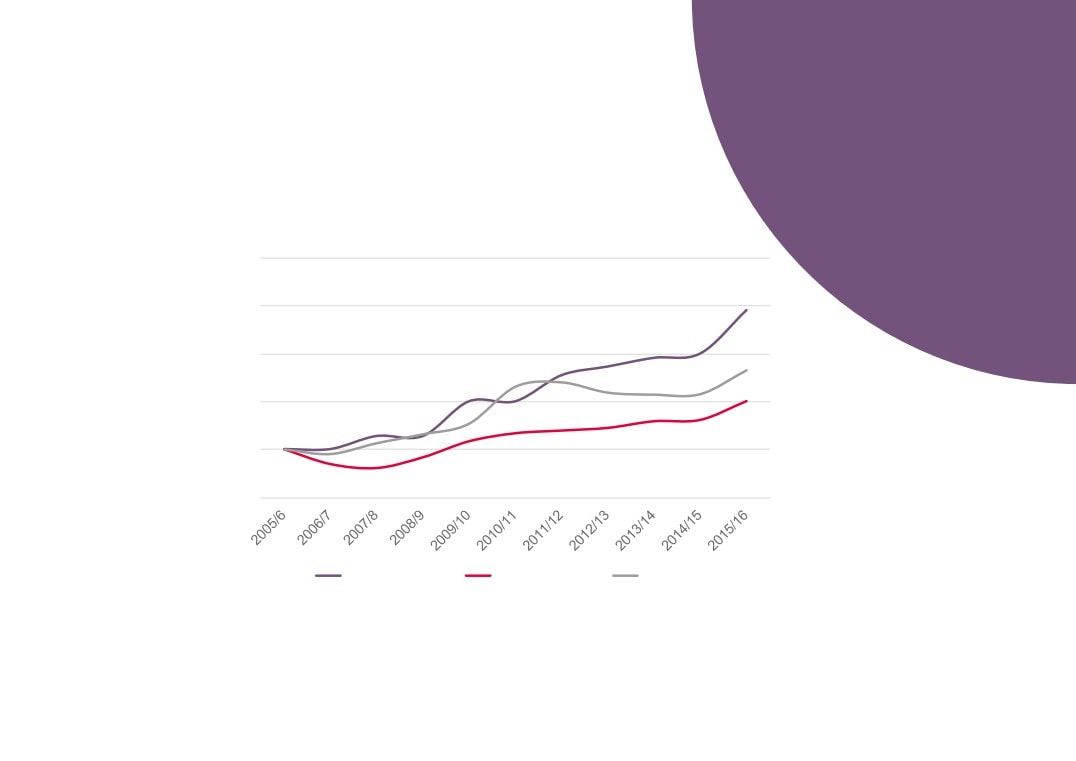
Growth in AgriFood
Tech sector
apprenticeships has
been consistently
Change in AgriFood Tech
higher than regional
Apprenticeships, Index 2005/6 = 100
and national rates
300
250
200
Please note that this
analysis uses a less
150
precise definition of the
AgriFoodTech sector
(Agriculture, Horticulture
100
and Animal Care
apprenticeships) as
opposed to the previous
50
data cube analysis.
New Anglia LEP
East of England
England
Source: FE Data Library, Department for Education
52
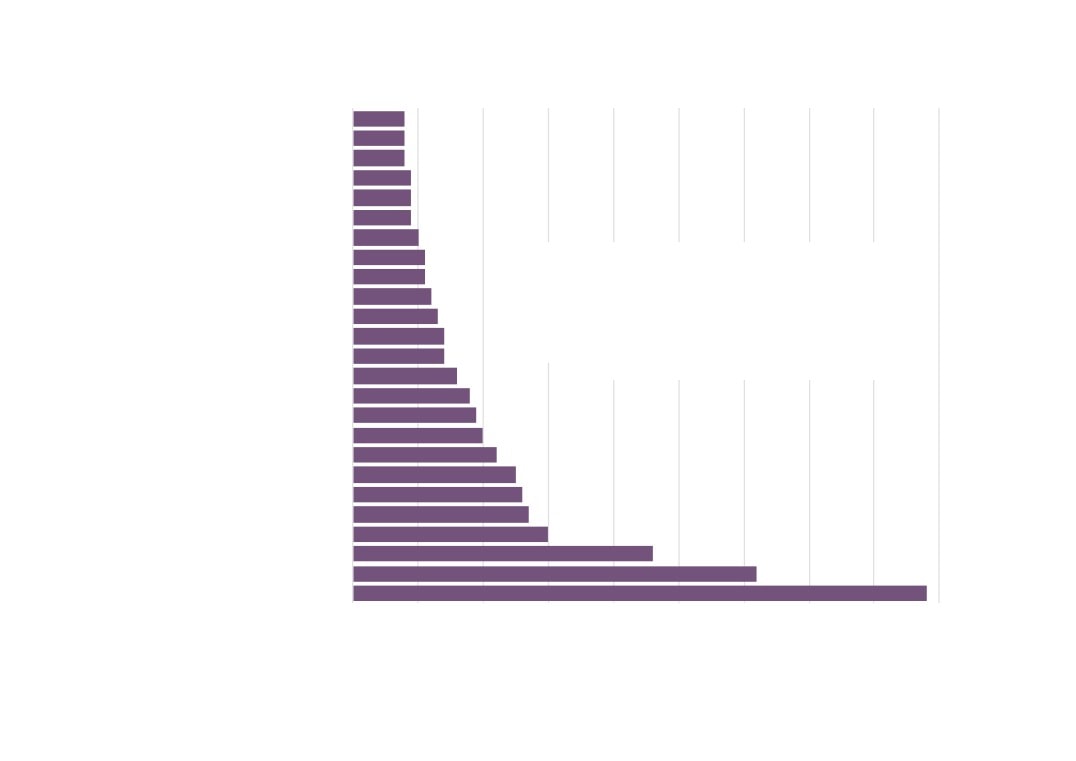
AgriFood Tech sector vacancies across New Anglia,
0
200
400
600
800
1,000
Jan 2012 - Dec 2016
Norwich
According to the Labour Insight Jobs tool, then
there were 5,507 postings for the sector in New
St. Edmundsbury
Anglia between Jan. 1, 2012 and Dec. 31, 2016.
Breckland
A further 1,111 postings had the potential to be
Ipswich
within the sector but a final judgement could not
be made on these due to their unspecified or
Kings Lynn and West Norfolk
unclassified nature.
North Norfolk
The definition for the AgriFood Tech sector in this
Great Yarmouth
exercise is narrower than that we have defined
but it still provides us with some useful
Mid Suffolk
information on vacancy numbers and types.
Waveney
The definition used in this exercise captures the
South Norfolk
following industry and sectors: ‘Agriculture,
Forestry and Fishing’, ‘Manufacture of food
Suffolk Coastal
products’, and ‘Manufacture of beverages’.
Babergh
Please note that some caution needs to be
Forest Heath
applied to this data as results may reflect the way
Broadland
different sectors recruit rather than real
differences in the number of jobs.
Source: Labour Insight Jobs, Burning Glass Technologies
53
Cranswick
Birds Eye Iglo Group
Country Grounds Maintenance Ltd
Newstar Bakery Ltd
Blue Spark Ltd
Bernard Matthews Farms
Synergi Search Select Ltd
Crisp Malting Group
Top AgriFood Tech Sector
Britvic
McCormick
Employers across New Anglia
Caffe Nero Group
2 Sisters Food Group
Jan 2012 - Dec 2016
RA Group Services Ltd
Source: Labour Insight Jobs, Burning Glass Technologies
Dairy Crest Group
2 Agriculture Ltd
Allied Bakeries
Colorcote
Ringtons Holdings
BOCM Pauls
The Sterling Choice Ltd
Kerry Foods
RSPB
BUPA
Nestle
Mars Incorporated
0
10
20
30
40
50
60
70
80
90
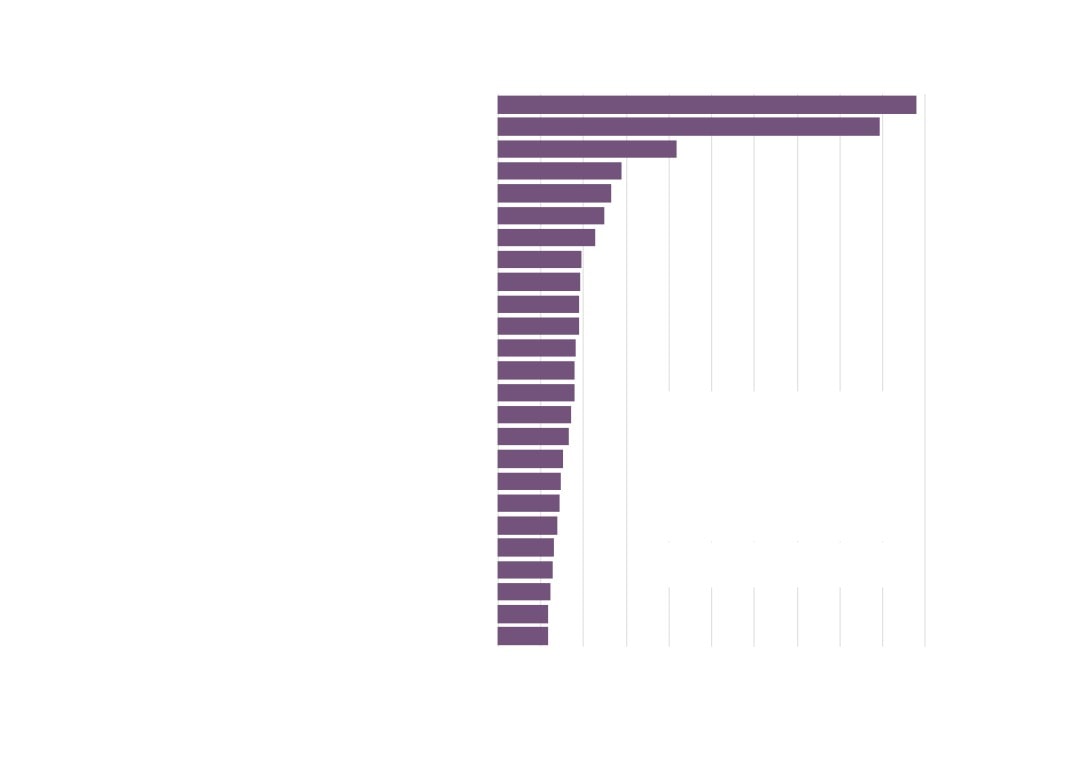
54
0
50
100
150
200
250
300
350
400
450
500
Production managers and directors in manufacturing (1121)
Engineering technicians (3113)
Engineering professionals n.e.c (2129)
Quality assurance and regulatory professionals (2462)
Plant and machine operatives n.e.c. (8129)
Buyers and procurement officers (3541)
Sales accounts and business development managers (3545)
Programmers and software development professionals (3545)
Sales related occupations n.e.c. (7129)
Electrical engineers (2123)
Other administrative occupations n.e.c. (4159)
IT specialist managers (2133)
Managers and proprietors in other services n.e.c. (1259)
Business sales executives (3542)
Financial accounts managers (3538)
AgriFood Tech
Mechanical engineers (2122)
sector vacancies by
Chartered and certified accountants (2421)
Managers and directors in retail and wholesale (1190)
occupation
Electricians and electrical fitters (5241)
Food, drink and tobacco process operatives (8111)
Jan 2012 - Dec
Design and development engineers (2126)
Source: Labour Insight Jobs, Burning
Marketing associate professionals (3543)
Glass Technologies
Book-keepers, payroll managers and wages clerks (4122)
Other skilled trades n.e.c. (5449)
Van drivers (8212)
55
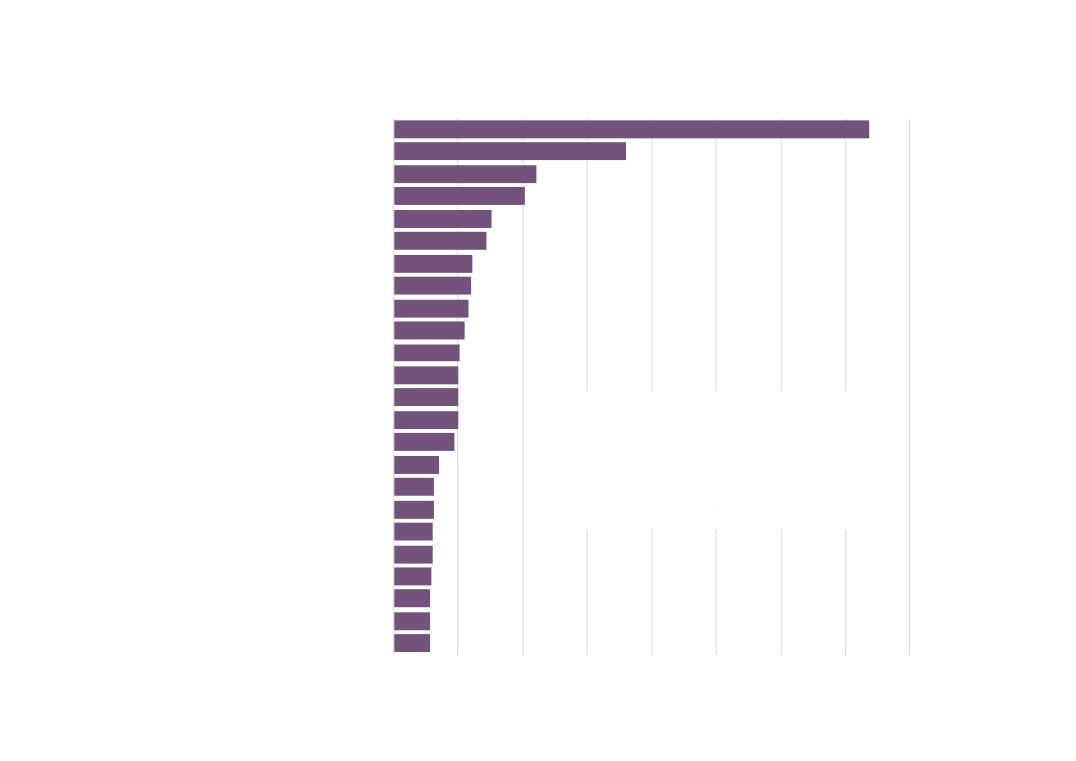
0
50
100
150
200
250
300
350
400
Maintenance Engineer
Production Manager
Electrical Engineer
Sales Executive
Production Worker
Manaufacturing Manager
Engineering Manager
Account Manager
Food Technologist
Multi-Skilled Engineer
Technical Manager
Production Supervisor
Assistant Manager
Quality Assurance Manager
AgriFood Tech sector
Shift Manager
vacancies by job title
Production Planner
Cleaner
Jan 2012 - Dec 2016
Npd Technologist
Source: Labour Insight Jobs, Burning Glass Technologies
Business Development Executive
Engineering Team Leader
Marketing Manager
Npd Manager
Area Sales Manager
National Account Manager
56
2%
0%
5%
9%
42%
AgriFood Tech sector
vacancies by qualification level
18%
required, Jan 2012 - Dec 2016
Source: Labour Insight Jobs, Burning Glass Technologies
23%
Bachelor's degrees, graduate certificates and diplomas
A-Levels, Highers, and Level 3 S/NVQs
GCSEs, Standard Grades, and Level 2 S/NVQs
Level 4 diplomas and certificates, HNCs, Level S/NVQs
Foundation degrees and HNDs
Post graduate degrees, Level 5 S/NVQs, certificates and diplomas
Level 1 S/NVQs
57
0
100
200
300
400
500
600
700
800
900
1,000
Marketing Sales
Contract Recruitment
Advertising Services
Food Service Industry Background
Packaging
Business Management
Key Performance Indicators
Machinery
Customer Service
Microsoft Excel
Operations Management
Food Safety
Product Sales
Lean Methods
Accountancy
Project Management
AgriFood Tech sector
Repair
Purchasing
vacancies by skills required
Electrical Engineering
Jan 2012 - Dec 2016
Customer Contact
Source: Labour Insight Jobs, Burning Glass Technologies
Good Manufacturing Practices
Mechanical Engineering
Lean Manufacturing
Sales
Food Science
58
A Future View of the
AgriFood Tech Sector
59
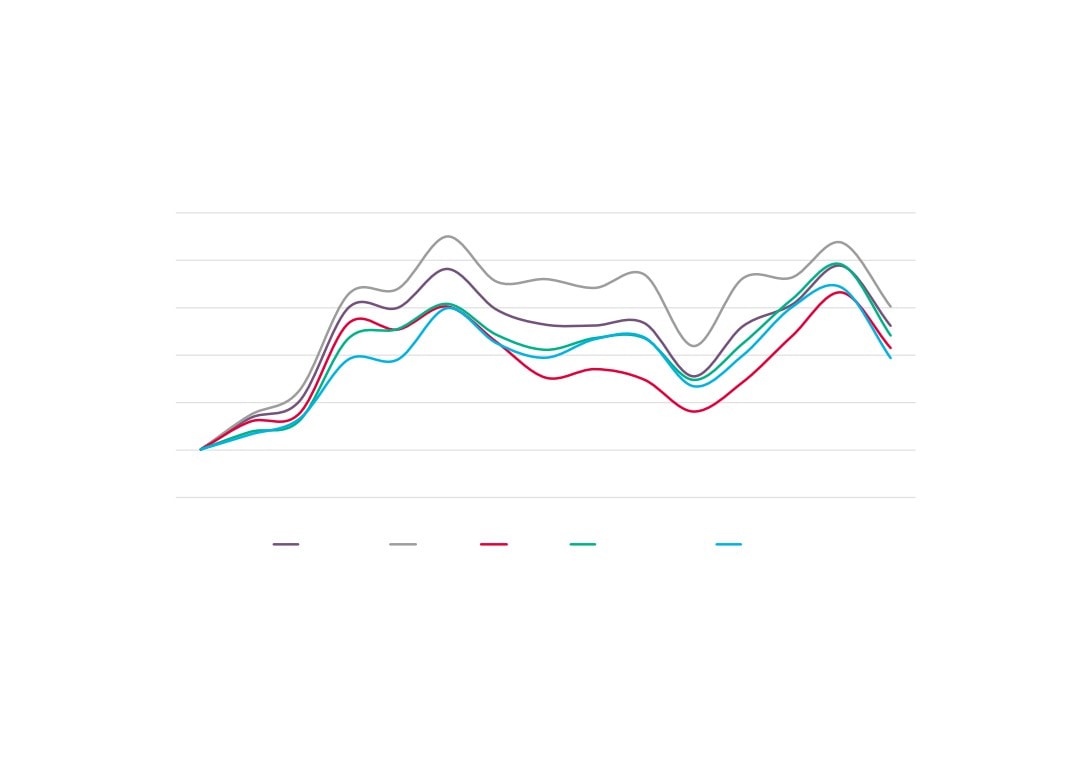
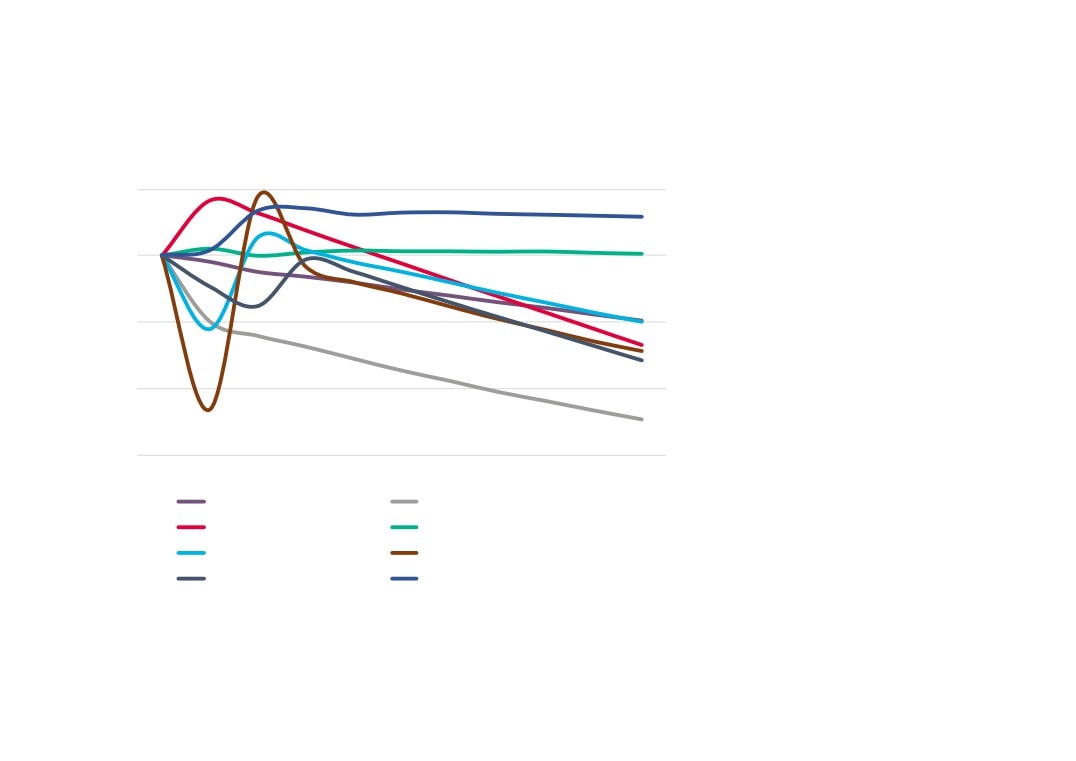
Forecasts for change in AgriFood Tech employment, New
Anglia
110
The data presented in this chart is from the
East of England Forecasting Model (EEFM)
and the UKCES Working Futures data (WF).
In each case the AgriFood Tech sector has
been approximated from the sector splits
100
available in each model. In the case of the
East of England Forecasting Model then
‘Agriculture’, ‘Food manufacturing’, and
proportions of both ‘Pharmaceutical
90
manufacturing’ and ‘Land transport’ have
been summed to arrive at an AgriFood Tech
sector. For the Working Futures data then
‘Agriculture’, ‘Food, drink and tobacco’, and
80
a proportion of ‘Transport and storage’ have
been summed. In both cases, then both
models project a decline in employment in
the AgriFood Tech sector overall. It is
70
however worth noting at this stage then
2014
2015
2016
2017
2018
2019
2020
2021
2022
2023
2024
neither set of figures take into account New
Anglia LEPs growth ambitions.
AgriFoodTech (EEFM)
Agriculture (EEFM)
Manufacturing - food (EEFM)
Land transport (EEFM)
Sources: East of England Forecasting Model,
AgriFoodTech (WF)
Agriculture (WF)
Cambridge Econometrics; UKCES Working
Food drink and tobacco (WF)
Transport and storage (WF)
Futures 2014 - 2024
60
Occupational composition of employment in New Anglia’s
AgriFood Tech sector over time
AgriFoodTech
Management positions, professional
Digital Tech
and associate professional
100%
occupations are all set to maintain
4%
4%
5%
5%
4%
their positions in terms of the
8%
7%
7%
employment they provide in the
12%
10%
80%
6%
6%
AgriFood Tech sector.
8%
9%
13%
Process, plant and machine
23%
23%
operative jobs are set to reduce in
22%
60%
22%
importance whilst at the same time
21%
skilled trade occupations will grow.
These trends are however very
40%
39%
different for the sectors that make
37%
38%
33%
up the AgriFood Tech sector in this
30%
analysis.
20%
15%
15%
16%
13%
14%
Source: UKCES Working Futures 2014 - 2024
0%
2004
2009
2014
2019
2024
Elementary occupations
Process, plant and machine operatives
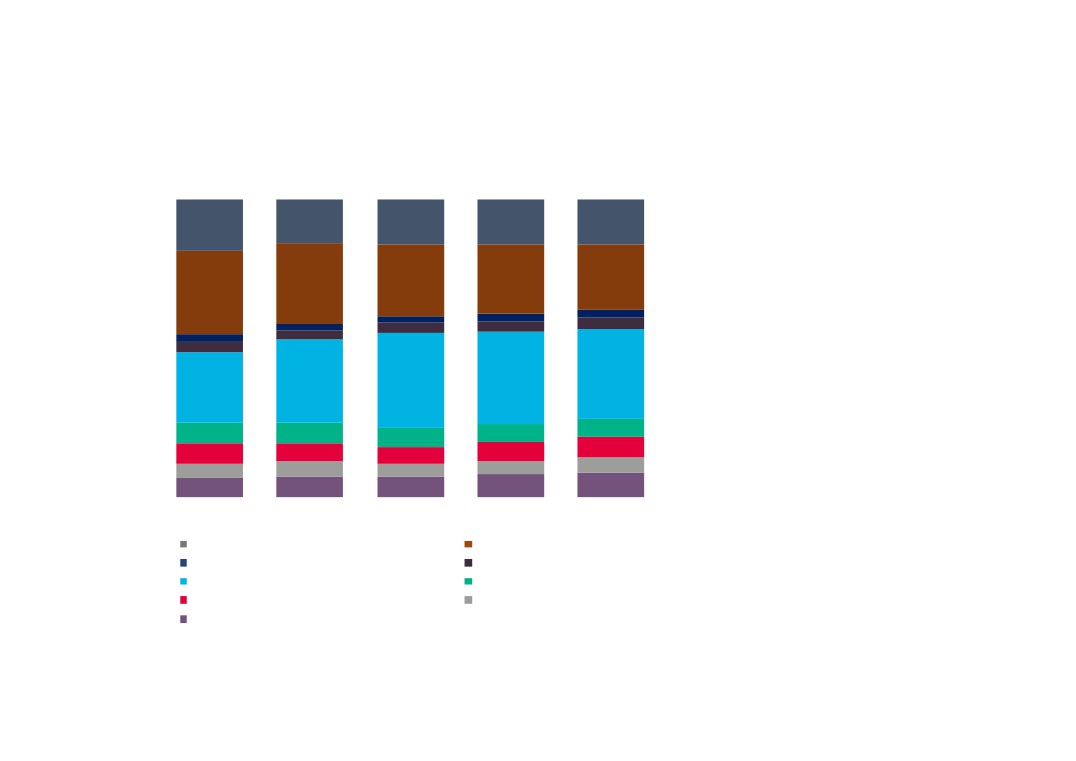
Sales and customer service
Caring, leisure and other service
Skilled trades occupations
Administrative and secretarial
Associate professional and technical
Professional occupations
Managers, directors and senior officials
61
Agriculture
Transport & Storage
15%
14%
13%
18%
16%
17%
18%
19%
19%
26%
4%
5%
4%
4%
4%
Digital Tech
7%
3%
4%
100%
7%
35%
4%
3
5%
5%
6%
8%
Digit
Digital Tech
58%
59
51%
100%
100%
2
40%
5%
5%
5%
5%
4%
8%
12%
10%
10%
80%
12%
80%
8%
9%
9%
13%
13%
6%
6%
4%
3
5%
3%
2
2%
3%
3%
22%
4%
4%
3%
4%
60%
22%
60%
22%
6%
6%
7%
7%
21%
21%
Food, Drink and Tobacco
2004
2
40%
1
37%
3
33%
33%
12%
10%
30%
13%
13%
14%
20%
n
14%
13%
14%
15%
1
r
40%
0%
38%
36%
40%
38%
2009
2004
2009
2014
2
Food,
tions
Elementary occupations
Process, plan
Drink &
3%
3%
3%
r service
3%
3%
Sales and customer service
Caring, leisur
Tobacco
pations
Skilled trades occupations
Administrativ
17%
20%
20%
18%
18%
nal and technical
Associate professional and technical
Professional
s and senior officials
Managers, directors and senior officials
5%
5%
5%
5%
5%
11%
Source: UKCES Working Futures 2014 - 2024
8%
10%
9%
9%
6%
5%
6%
5%
5%
6%
8%
7%
7%
8%
2004
2009
2014
2019
2024
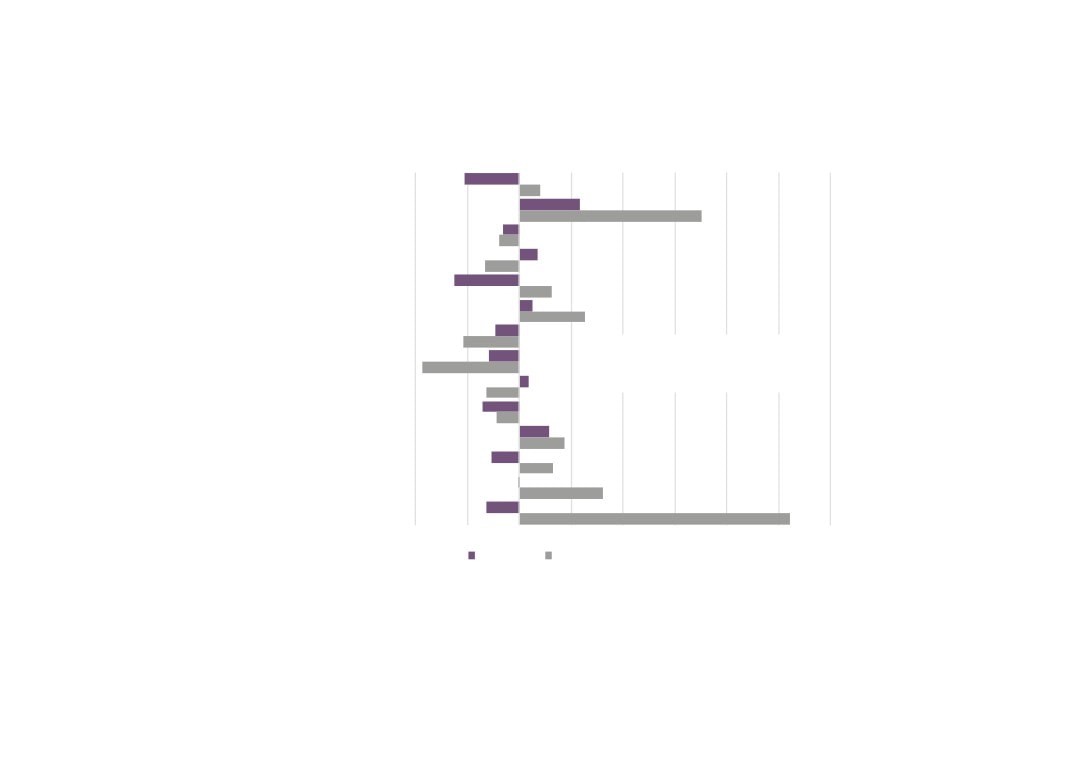
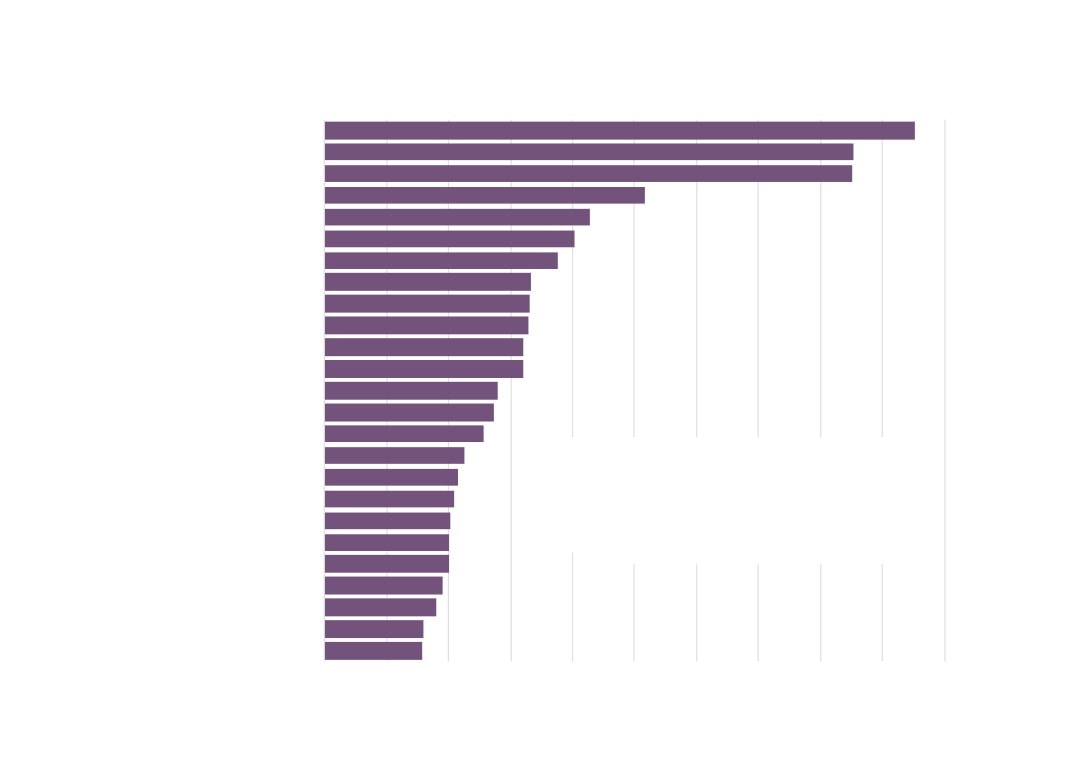
By 2024, there is
AgriFood Tech Replacement and
Expansion Demand by Occupation
a potential gap in
the New Anglia
All occupations
AgriFood Tech
sector workforce
Given the baseline
of 18,000
51 Skilled agricultural and related trades
projection of a falling
level of employment
seen in the previous
section then the net
82 Transport and mobile machine drivers
requirement of posts to
and operatives
be filled across the
sector is driven by
replacement demand i.e. people leaving or
retiring from the workforce. Between now and
11 Corporate managers and directors
2024 then there will be over 18,000 positions
created through retirement that will need filling.
However, if we go below the ‘All occupations’ element and
35 Business and public service associate
have a look at the top five occupations (based on total net
professionals
requirement of jobs over the period 2014-2024) in the sector
then we can see that there are elements of expansion
demand albeit small despite the projected drop in
employment.
41 Administrative occupations
Source: UKCES Working Futures 2014 - 2024
-10,000
-5,000
0
5,000
10,000
15,000
20,000
Net requirement
Replacement demand
Expansion demand
63
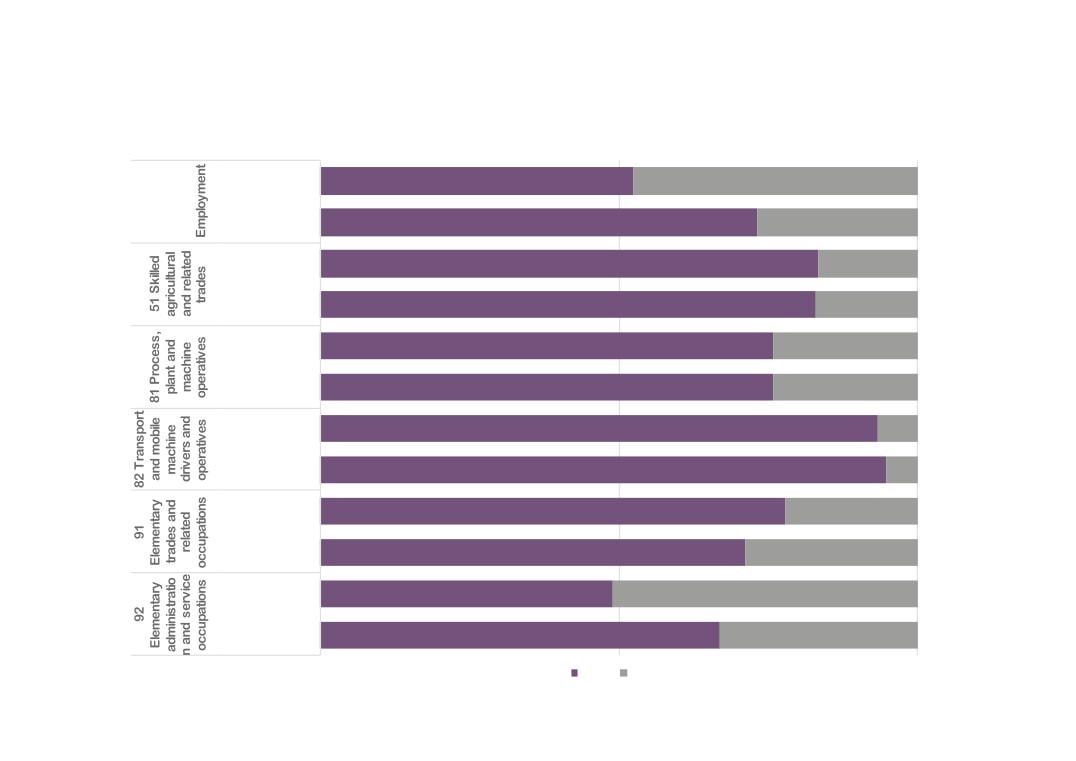
60%
50%
Replacement and
40%
30%
Expansion Demand by
20%
Occupation
10%
The following chart displays the same
information, but this time replacement and
0%
expansion demand are displayed as
-10%
percentages of the total employment by
occupation in the sector in 2014. This
-20%
helps to give a sense of churn within the
41
35 Business
11 Corporate
82 Transport
51 Skilled
All
sectors workforce over the next decade.
Administrative
and public
managers
and mobile
agricultural
occupations
occupations
service
and directors machine
and related
Source: UKCES Working Futures 2014 - 2024
associate
drivers and
trades
professionals
operatives
Expansion demand
Replacement demand
Net requirement
64
Replacement and Expansion Demand by Qualification
-6,000
-4,000
-2,000
0
2,000
4,000
6,000
8,000
Please note that the Working Futures data
QCF 7-8
(700)
uses the following breakout of qualification
levels:
QCF 4-6
(6,900)
QCF8 - Doctorate
QCF7 - Other higher degree
QCF6 - First degree
QCF 3
(2,000)
QCF5 - Foundation degree; Nursing;
Teaching
QCF4 - HE below degree level
QCF 2
(3,000)
QCF3 - A level & equivalent
QCF2 - GCSE (A-C) & equivalent
QCF1 - GCSE (below grade C) &
equivalent
QCF 1
(0)
No Q - No Qualification
Source: UKCES Working Futures 2014 - 2024
No Qual
(-1,600)
The figures in brackets denote the net
demand for each qualification group.
Replacement Demand
Expansion Demand
The UKCES Working Futures data also enables us to consider levels of future replacement and expansion demand in terms of the
levels of qualifications that will be leaving and required in the workforce as it changes over time. As we can see from the chart, positive
expansion demand within the AgriFoodTech sector is going to be dominated by the demand for higher education qualifications (QCF4
and above), and at the same time whilst the sectors requirement for lower level skills will reduce there will still be a demand for them.
65
Views from Sector
Stakeholders
66
AgriFood Tech survey findings
As part of the consultation process, a short on-line questionnaire was circulated widely by industry groups to seek the views of employers on
key gaps in current skills provision, how they thought skills needs may evolve in the future, and the areas in which further investment in skills is
needed. In total, 36 responses to the survey were received. The following sets out the feedback that was received.
Q1. Over the next ten years, in your opinion which type of jobs will be on the increase in the New Anglia agricultural, food and related technology
sectors? (Please tick all that apply)
Middle / Senior management
13
(36%)
Professional / Higher technical (but non managerial)
26
(72%)
Supervisory
14
(39%)
Skilled manual / Lower technical
25
(69%)
Semi-skilled manual
10
(28%)
Administrative
11
(31%)
Unskilled
3(8%)
No change
3(8%)
67
Q2. How important on a scale of 1 to 5 (where 1 is not that important, to 5 is vital to the future of the industry) are the following skills to the
future of the agricultural, food and related technology sectors?
Advanced IT Skills
New technologies for agricultural or food
production
18
16
13
9
7
6
1
1
1
0
0
1
2
3
4
5
0
1
2
3
4
5
Environmental and sustainability skills
Oral communication
13
12
15
10
10
7
4
1
0
1
2
3
4
5
0
1
2
3
4
5
68
Written communication
Meeting customer needs
14
25
10
9
8
3
3
0
1
2
3
4
5
0
1
2
3
4
5
Team working
English as a second or other language
19
12
11
13
9
3
2
2
1
0
1
2
3
4
5
0
1
2
3
4
5
69
Quality / continuous improvement
Planning and organising
17
16
20
13
3
3
0
1
2
3
4
5
0
1
2
3
4
5
People, leadership and professional skills
Strategic management
17
20
13
12
2
2
2
2
1
0
1
2
3
4
5
0
1
2
3
4
5
70
Numeracy
Literacy
22
21
10
10
3
2
2
1
1
0
1
2
3
4
5
0
1
2
3
4
5
71
Q2. Average Score - How important on a scale of 1 to 5 (where 1 is not that important, to 5 is vital to the future of the industry) are the following
skills to the future of the agricultural, food and related technology sectors?
Literacy
4.6
Numeracy
4.4
Strategic management
4.4
People, leadership and professional skills
4.4
Planning and organising
4.3
Quality / continuous improvement
4.2
English as a second or other language
4.2
Team working
4.2
Meeting customer needs
4.1
Written communication
4.0
Oral communication
4.0
Environmental and sustainability skills
3.9
New technologies for agricultural or food production
3.8
Advanced IT Skills
3.6
72
Q3. What one action would improve the skills system to ensure that the agricultural, food and related technology sectors have the skills they
need in the future?
-
Offer internships
-
More 1-3 day technical courses during the winter months
-
A stable, suitably funded College and provider sector that can deliver the skills that are needed
-
Good solid training with a test at the end
-
Focus in colleges on producing highly qualified operators rather than degree students that want to be managers
-
Promote agriculture as an interesting, well paid futuristic industry
-
Fast Broadband
-
Technical/IT ability
-
Better rewards
-
Better schooling aligned to industry
-
Make managers work closer with workforce. Most managers like telling not listening. They could then equip their staff with skills and
training needed. Or employ the right person to fill skills gap
-
Understanding IT for the middle level older employees
-
Clarity and integrity of trading arrangements post 2020
-
More funding
-
Must speak English to enter or work in UK
-
Including horticulture/agriculture in the school curriculum
-
Liaison between colleges and the market; together with lifelong learning schemes put in place
-
It is an ageing workforce and younger talent is required across the board. Need to attract young people into Agriculture. Care ers advice
and development at school age and relevant apprenticeships geared up for post 16 age
-
More technically skilled staff
-
Education
-
Attracting the right people to the industry
73
-
A long term plan for sustainable agriculture in the UK
-
Better sharing of specific skills across sector by experts
-
More applied training for young people
-
More direct involvement with apprenticeships
-
Engagement with sixth form schools
-
Using a university linked knowledge exchange program like they do in the USA
-
Making the public aware of the industry
-
Training courses provided which provide some of the above
-
Better engagement with schools to get high calibre individuals interested
-
The ability to communicate in writing with brevity and accuracy
-
Literacy and attitude. Having all the skills is nothing without the right attitude to work
-
The answer is probably that the great British public need to accept that they have to spend more of their income on food, so that we can
pay higher wages
74
Q4. If there is anything else that you would like to tell us about your experiences of the New Anglia skills system / labour market in relation to
the agricultural, food and related technology sectors then please do so here:
-
Send employees on courses
-
Without access to European labour who are willing to do hard/mundane jobs we will be in trouble
-
Skills delivered locally are more likely to retain future staff than those delivered beyond the region. Effective partnership working with
employers and training providers will be essential if the labour needs of the sector are to be met.
-
More farmers should sell direct to the consumer
-
We must continue to lobby government at all levels to allow access of foreign workers to us all.
-
More integration
-
Farm labour is no longer a low skilled job. Good understanding of computers/satellite, good literacy and numeracy skills, and good
spoken English are all vital. We ask them to drive machinery worth £400,000+, handle chemicals and communicate with our customers
(but there are still mundane tasks that need doing as well)
-
For following question - I run a training group so do not employ many staff. But we train over 500 people a year in rural business's in
East Anglia
-
Young people need to be encouraged to strive for excellence. Good enough just isn't. There needs to be a change from school level
upwards.
-
Shortage of workers willing to work with livestock
-
On farm skill sets are narrow and largely consist of tractor driving and machinery operation with little scientific, environmental or
financial knowledge.
-
A skills shortage will lead to wage inflation. Need to improve conditions of employment and housing.
-
No skill training locally as it is not a dairy area, I have to get in consultants or send people to France/Wales/Cornwall, I have tried
attracting people from college catering departments but they are into restaurant food and don’t want to do manufacturing
75
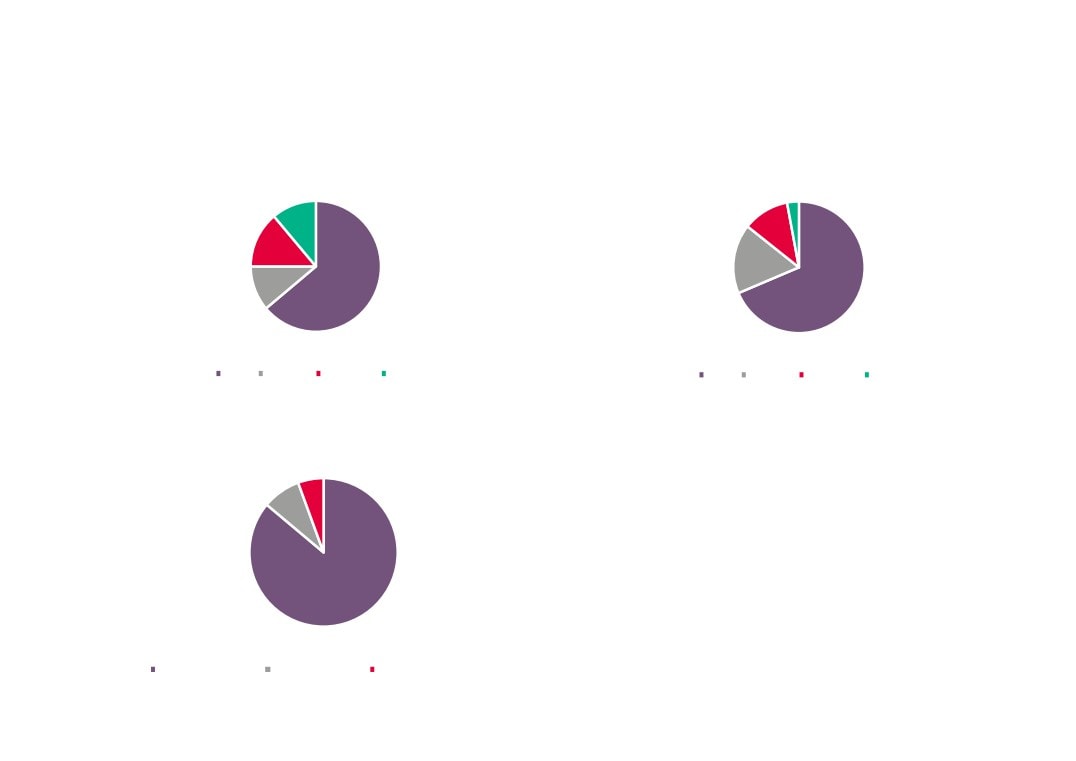
Profile of survey respondents
How many people do you employ in total?
How many people do you employ in Norfolk and Suffolk?
1
(3%)
4
(11%)
4
(11%)
5
(14%)
6
(17%)
4
(11%)
23
(63%)
24
(69%)
1-9
10-49
50-249
250+
1-9
10-49
50-249
250+
How long has the business been trading?
2
(6%)
3
(8%)
31
(86%)
Up to 5 years
5 - 20 years
More than 20 Years
76
Appendix 1 - AgriFoodTech sector definition
% elgible for AgriFoodTech defn
2007 SIC
Description
AgriFoodTech element
(100% if blank)
Code
Businesses Employment
GVA
1000
DEFRA/Scottish Executive Agricultural Data
Agricultural, horticultural and forestry production
1110
Growing of cereals (except rice), leguminous crops and oil seeds
Agricultural, horticultural and forestry production
1120
Growing of rice
Agricultural, horticultural and forestry production
1130
Growing of vegetables and melons, roots and tubers
Agricultural, horticultural and forestry production
1140
Growing of sugar cane
Agricultural, horticultural and forestry production
1150
Growing of tobacco
Agricultural, horticultural and forestry production
1160
Growing of fibre crops
Agricultural, horticultural and forestry production
1190
Growing of other non-perennial crops
Agricultural, horticultural and forestry production
1210
Growing of grapes
Agricultural, horticultural and forestry production
1220
Growing of tropical and subtropical fruits
Agricultural, horticultural and forestry production
1230
Growing of citrus fruits
Agricultural, horticultural and forestry production
1240
Growing of pome fruits and stone fruits
Agricultural, horticultural and forestry production
1250
Growing of other tree and bush fruits and nuts
Agricultural, horticultural and forestry production
1260
Growing of oleaginous fruits
Agricultural, horticultural and forestry production
1270
Growing of beverage crops
Agricultural, horticultural and forestry production
1280
Growing of spices, aromatic, drug and pharmaceutical crops
Agricultural, horticultural and forestry production
1290
Growing of other perennial crops
Agricultural, horticultural and forestry production
1300
Plant propagation
AgriTech
1410
Raising of dairy cattle
Agricultural, horticultural and forestry production
1420
Raising of other cattle and buffaloes
Agricultural, horticultural and forestry production
1430
Raising of horses and other equines
Agricultural, horticultural and forestry production
1440
Raising of camels and camelids
Agricultural, horticultural and forestry production
1450
Raising of sheep and goats
Agricultural, horticultural and forestry production
1460
Raising of swine/pigs
Agricultural, horticultural and forestry production
1470
Raising of poultry
Agricultural, horticultural and forestry production
1490
Raising of other animals
Agricultural, horticultural and forestry production
1500
Mixed farming
Agricultural, horticultural and forestry production
1610
Support activities for crop production
AgriTech
1621
Farm animal boarding and care
AgriTech
1629
Other support activities for animal production
AgriTech
1630
Post-harvest crop activities
AgriTech
1640
Seed processing for propagation
AgriTech
1700
Hunting, trapping and related service activities
Agricultural, horticultural and forestry production
2100
Silviculture and other forestry activities
Agricultural, horticultural and forestry production
2200
Logging
Agricultural, horticultural and forestry production
2300
Gathering of wild growing non-wood products
Agricultural, horticultural and forestry production
2400
Support services to forestry
Agricultural, horticultural and forestry production
3110
Marine fishing
Agricultural, horticultural and forestry production
3120
Freshwater fishing
Agricultural, horticultural and forestry production
78
% elgible for AgriFoodTech defn
2007 SIC
Description
AgriFoodTech element
(100% if blank)
Code
Businesses Employment
GVA
3210
Marine aquaculture
Agricultural, horticultural and forestry production
3220
Freshwater aquaculture
Agricultural, horticultural and forestry production
10110
Processing and preserving of meat
Food processing
10120
Processing and preserving of poultry meat
Food processing
10130
Production of meat and poultry meat products
Food processing
10200
Processing and preserving of fish, crustaceans and molluscs
Food processing
10310
Processing and preserving of potatoes
Food processing
10320
Manufacture of fruit and vegetable juice
Food processing
10390
Other processing and preserving of fruit and vegetables
Food processing
10410
Manufacture of oils and fats
Food processing
10420
Manufacture of margarine and similar edible fats
Food processing
10511
Liquid milk and cream production
Food processing
10512
Butter and cheese production
Food processing
10519
Manufacture of other milk products
Food processing
10520
Manufacture of ice cream
Food processing
10611
Grain milling
Food processing
10612
Manufacture of breakfast cereals and cereals-based food
Food processing
10620
Manufacture of starches and starch products
Food processing
10710
Manufacture of bread; manufacture of fresh pastry goods and cakes
Food processing
10720
Manufacture of rusks and biscuits; manufacture of preserved pastry goods and cakes
Food processing
10730
Manufacture of macaroni, noodles, couscous and similar farinaceous products
Food processing
10810
Manufacture of sugar
Food processing
10821
Manufacture of cocoa and chocolate confectionery
Food processing
10822
Manufacture of sugar confectionery
Food processing
10831
Tea processing
Food processing
10832
Production of coffee and coffee substitutes
Food processing
10840
Manufacture of condiments and seasonings
Food processing
10850
Manufacture of prepared meals and dishes
Food processing
10860
Manufacture of homogenized food preparations and dietetic food
Food processing
10890
Manufacture of other food products n.e.c.
Food processing
10910
Manufacture of prepared feeds for farm animals
Food processing
10920
Manufacture of prepared pet foods
Food processing
11010
Distilling, rectifying and blending of spirits
Food processing
11020
Manufacture of wine from grape
Food processing
11030
Manufacture of cider and other fruit wines
Food processing
79
% elgible for AgriFoodTech defn
2007 SIC
Description
AgriFoodTech element
(100% if blank)
Code
Businesses
Employment
GVA
11040
Manufacture of other non-distilled fermented beverages
Food processing
11050
Manufacture of beer
Food processing
11060
Manufacture of malt
Food processing
11070
Manufacture of soft drinks; production of mineral waters and other bottled waters
Food processing
20150
Manufacture of fertilisers and nitrogen compounds
AgriTech
20200
Manufacture of pesticides and other agrochemical products
AgriTech
21100
Manufacture of basic pharmaceutical products
AgriTech
1
0.6
0.2
21200
Manufacture of pharmaceutical preparations
AgriTech
9.1
1.7
0.4
28301
Manufacture of agricultural tractors
Input supplies
28302
Manufacture of agricultural and forestry machinery
Input supplies
28930
Manufacture of machinery for food, beverage and tobacco processing
FoodTech
36000
Water collection, treatment and supply
AgriTech
8.3
0.4
38210
Treatment and disposal of non-hazardous waste
AgriTech
2.8
1.8
46110
Agents involved in the sale of agricultural raw materials, live animals, textile raw materials and semi-finished goods
AgriTech
46170
Agents involved in the sale of food, beverages and tobacco
AgriTech
46210
Wholesale of grain, unmanufactured tobacco, seeds and animal feeds
Food wholesaling and marketing
46220
Wholesale of flowers and plants
Food wholesaling and marketing
46230
Wholesale of live animals
Food wholesaling and marketing
46310
Wholesale of fruit and vegetables
Food wholesaling and marketing
46320
Wholesale of meat and meat products
Food wholesaling and marketing
46330
Wholesale of dairy products, eggs and edible oils and fats
Food wholesaling and marketing
46341
Wholesale of fruit and vegetable juices, mineral water and soft drinks
Food wholesaling and marketing
46342
Wholesale of wine, beer, spirits and other alcoholic beverages
Food wholesaling and marketing
46360
Wholesale of sugar and chocolate and sugar confectionery
Food wholesaling and marketing
46370
Wholesale of coffee, tea, cocoa and spices
Food wholesaling and marketing
46380
Wholesale of other food, including fish, crustaceans and molluscs
Food wholesaling and marketing
46390
Non-specialised wholesale of food, beverages and tobacco
Food wholesaling and marketing
46610
Wholesale of agricultural machinery, equipment and supplies
AgriTech
49410
Freight transport by road
Food logistics
28
28
28
72110
Research and experimental development on biotechnology
AgriTech
2.4
3.3
72190
Other research and experimental development on natural sciences and engineering
AgriTech
12.6
5.2
74901
Environmental consulting activities
AgriTech
9.7
4.3
74909
Other professional, scientific and technical activities
AgriTech
9.7
4.3
75000
Veterinary activities
AgriTech
19.1
7.1
77310
Renting and leasing of agricultural machinery and equipment
Input supplies
82920
Packaging activities
Input supplies
80
Appendix 2 - AgriFood Technology Leadership Council Definition of AgriTech (BIS RESEARCH PAPER NUMBER 284, July 2016, Agri-
Tech Industrial Strategy: Evaluation Scoping Study and Baseline)
The farming industry, including diversified activities such as on-farm waste and biomass (grass, energy crops, specialist crops) for non-food
uses.
Plant subsectors (crops including cereals, oilseeds, pulses, forage, potato, sugar beet, vegetables, salads, mushrooms and fruit) including:
-
Plant genetic improvement: genetics, genomics, biotechnology, breeding/ propagation, genetic conservation
-
Plant health: plant production (physiology, agronomy, crop management and nutrition such as fertilizer/ agri-chemicals) and plant
protection (identification, diagnostics, epidemiology, management / control including biological controls / vaccines / therapeutics of pest
disease and weeds)
-
Crop storage and silage (including post-harvest storage and on-farm waste and biomass for non-food uses)
Animal subsectors (livestock: dairy, beef, sheep, pigs, poultry (egg and meat) and aquaculture for fish: salmon, trout, shellfish) including:
-
Animal genetic improvement: genetics/ genomics; breeding/reproductive technologies; genetic conservation
-
Animal nutrition, including ingredients for animal feed; grazing systems and pasture diversity
-
Animal health and welfare (endemic diseases, exotic diseases, behaviour): identification, diagnostics, epidemiology, management /
control, vaccines, therapeutics, surveillance; building and environmental design to reduce stress and promote welfare
ICT systems and decision support: to support production planning, scheduling; input use efficiency (e.g. irrigation scheduling)
Environmental and physical subsectors including:
-
Soil/ substrate management: soil physics, biology and chemistry, soil amendments (e. g. biosolids, AD digestates, water retention gels
etc.); controlled traffic farming; reduced ground pressure; soil sampling; soilless growing media (glasshouse crops)
-
Environmental interactions (air, water, biodiversity - plant and animal; ie. technology / decision support tools to improve animal welfare
& environmental outcomes including reducing air and water pollution, greenhouse gas emissions including quantity and quality of air
and water)
-
Harvest and early-stage processing including harvest technologies, post-harvest cleaning, postharvest storage (chemicals and storage
conditions), on-farm waste (AD and other waste treatment plants) and biomass for non-food uses
Engineering and precision farming, including machinery (cultivation, crop and grass health (drilling, spraying, fertiliser application), tractors,
harvesters, pickers, post-harvest transport and cleaning), robotics including GPS applications and autonomous devices, sensor technology
(hand held, fixed and remote including animal welfare and monitoring)
Infrastructure: buildings (including glasshouses, livestock production buildings), heating and cooling systems, storage of crop and animal
products in ambient, controlled atmosphere, cold stores and freezing plants, irrigation/ water management storage and distribution systems,
dirty water systems, lighting (intensive livestock and glasshouse crops); ‘vertical’ and enclosed farming systems
81