New Anglia Transport Board
Rural and Coastal
Agenda
9.30am, Thursday 18th March 2021 - Teams
9.30
1.
Welcome and introductions
Chair
9.30
2.
Minutes and matters arising
Chair
Norwich Airport update
Richard Pace
CPC public transport/active travel update
David Cumming
9.40
3.
Terms of reference review
Ellen Goodwin
9.50
4.
Freeport East
Paul Davey - tbc
10.10
5.
The opportunity for hydrogen
Charlotte Farmer
Hydrogen East
10.30
6.
Influencing and enabling
Chair
A47
David Cumming
Improving public and shared transport confidence
Jonathan Denby/
Ali Clabburn
10.45
7.
Transport East update
Andrew Summers
Rural/coastal call for evidence
Laura Waters
10.55
8.
Any other business
All
Forward Plan and items for next meeting
Date of next meeting - 15th June 9.30-11 Teams
Officer Contact
If you have any questions about matters contained on this agenda, please get in touch with:
Ellen Goodwin
07384 258662
1
New Anglia Transport Board
Agile to Change
Meeting Note
9.30-11.00am, Monday 30th November 2020 - Virtual Teams meeting
Board attendance:
Ali Calbburn
Liftshare
Andrew Harston
Associated British Ports
Andrew Summers
Transport East
Andy Walker
Suffolk Chamber of Commerce
David Cumming
Norfolk County Council
Ellen Goodwin
New Anglia LEP
Graeme Mateer
Suffolk County Council
Cllr Graham Plant
Norfolk County representative
James Bradley
Network Rail
Jonathan Denby
Greater Anglia
Karen Chapman
Suffolk Growth Board
Kerry Allen
Suffolk County Council
Laura Waters
New Anglia LEP
Nova Fairbank
Norfolk Chamber of Commerce
Paul Davey
Hutchison Ports
Paul Martin
First Buses
Cllr Phil Smart
Suffolk district representative
Richard Pace
Norwich Airport
Richard Perkins
Suffolk Chamber of Commerce
Steve Oliver
New Anglia LEP
Steve Turner
Connected Places Catapult
Thomas Lawman
Highways England
Apologies:
Cllr Andrew Reid
Suffolk County representative
James Allen
New Anglia LEP
Jamie Burles
Greater Anglia
Suffolk Chamber of Commerce
John Dugmore
Jonathan Rudd
New Anglia LEP
Cllr Martin Wilby
Norfolk County representative
Patrick Ladbury
GT Railway
Paul Ager
Associated British Ports
Paul Horne
Suffolk County Council
Highways England
Simon Amor
2.
Minutes and matters arising
The previous minutes were accepted as a true record and all matters covered in the agenda.
Update on data and level of DfT intervention across Norfolk and Suffolk: work ongoing with DfT but transport usage
data across the country has been collected since March 2020 (updated 25 November) showing usage for cars, light
commercial vehicles, HGVs, rail and buses hit their lowest levels in April, increasing somewhat other the summer
months (peak in September) and since second lockdown have decreased again but not to levels seen in March.
3
Cycling had the reverse pattern with usage peaking in April, remaining above the 100% level until September and in
the latest November figure is now at its lowest level (67%). Data was also shared to the group on Norfolk traffic data,
Liftshare commuter survey findings showing one key change moving forward will be the ongoing demand from
commuters to work flexibly.
Greater Anglia updated that rail usage is much lower than normal and is expected to remain at this level until
restrictions are fully lifted. Do expect an increase in travel over the next 3 weeks for leisure and university students
returning home and customer feedback has been positive. Buses have faired better than rail with higher passenger
levels, but figures are encouragingly higher than the first lockdown.
Norwich airport updated that whilst understanding the government stance on quarantine period it does make the
situation challenging with very low passenger numbers, currently 1 service to Aberdeen and 1 to Amsterdam mainly
for offshore personnel. Do not expect a change until summer 2021. Need test/release alongside other key measures
to increase consumer demand. There has been good lobbying of MPs and traction has been made on the rates
question.
Action: RP to send letter to SO
Action: LW to set up meeting between SO/RP to discuss actions the Board can support.
Transport East circulated final version of decarbonisation report to the Board.
Ely infographic has been completed.
Action: LW to check with HM when this will be circulated to Board members.
3.
Brexit and Covid intelligence
Summary provided on the Brexit and Covid intelligence workstreams and intelligence collected:
Many businesses have been focusing upon recovery and clear guidance from government about the way
forward. Exciting initiatives such as mass vaccination and mass rapid testing are the tools to get us to a more
normal life but rolling this out will still take some time.
Businesses are still to go through the Christmas period and then the quieter start to the new year, before the
business support package tails off.
The Growth Hub has supported thousands of businesses since the pandemic started through their
recovery/growth plans and has worked closely with local authority colleagues. Quite a lot of work has been
focused on high-risk settings and communicating to those workplaces.
At a BEIS update session on 19 November, we were informed that negotiations resumed following an
acknowledgement from both sides of the need for movement. Intensive talks have continued daily, incl.
fisheries, state aid and level playing field.
Close to an agreement in many areas in FTA - goods, services, civil nuclear, aerospace, etc. Text for some of
these has been locked down already. Need enough time to ratify agreement on both sides - long and
complicated on the EU side (but all 3 institutions have discussed how to fast track this). UK ratification
process more agile and can implement using future relationship bill quite quickly.
Two county-wide groups have been set up to look at the UK’s exit from the EU - the Suffolk Brexit Task
Group and the Norfolk EU Transition Group with representation from all districts, the respective local
resilience forum and the LEP.
LEP has produced a business script for Growth Hub business advisers and partners engaging with
businesses. This business script builds on the government’s technical notices and guidance for businesses
and offers a local flavour for conversations. This document outlines the practical steps businesses can take
around issues such as employing staff, data protection and e-commerce.
Advisers are using this detailed information to provide businesses with answers on the new immigration
system from January 2021; and for businesses that are importing and/or exporting, guidance on customs
declarations, tariff rates, product markings and trade agreements.
Many businesses are in full survival mode as a result of Covid-19, they are not concentrating on EU exit and
they need to spend yet more resources, that they currently just do not have. They are not looking closely at
their supply chains and whether there is a European connection that needs to be addressed.
In a poll of around 50 East Anglian import and export businesses conducted by MHA Larking Gowen, 8% said
they were fully prepared while 37% answered they were more than half prepared.
4
In addition, without clarity from Government, as to exactly what businesses have to prepare for, it is very
difficult for them to plan and execute. Businesses have been asked several times to step up their preparations
in the past and nothing happened - businesses have a lack of capacity, resources, and energy to gear up for
the unknown. They need to know what to gear up for specifically.
Board then considered actions it can undertake to support transport and wider sectors as this time:
Move towards improving the testing system to build customer confidence in travelling and as we plan to build back
better in the spring we need to ensure strong messaging that travelling is safe - for example public transport is clean,
reliable and making all relevant safety measures.
Impact on smaller locations, one positive test can currently lead to a large proportion of workforce having to self-
isolate. As the testing system improves need to get people back to work as soon as possible and need to reinforce the
status of key workers.
Focus on encouraging people back to public transport, currently focus on active travel but given the messaging from
Government public transport is seen as unsafe. In the short term as people return to work, we need to give clear
messaging to encourage people to use sustainable transport modes. Need to consider changing travel patterns and
how things such as parking strategy should support this.
Alongside the messages around safety and raising public confidence, need to be clear that changing commuter
patterns to more sustainable modes also has the wider benefits of decarbonising the economy. Liftshare highlighted
that, pre Covid, 80,000 people lift shared on their commute in Norfolk and Suffolk (compared to 8,000 by train and
30,000 who commuted by bus). The impact of reductions in lift sharing on the commute following mixed messaging
around safety from Government will have a significant negative impact on congestion and emissions unless there is
clear communication to raise confidence again. (The average CO2 emissions/passenger km for driving alone = 172g,
lift-sharing = 86g and for bus passengers = 103g)
Transport East support comments on Government messaging and see this as an opportunity to influence DfT with our
key priorities.
Action: New Anglia LEP to produce communications piece on raising the confidence around public transport, lift
sharing and promoting the region.
Action: JD/SO/KC/AS/AC to meet to discuss government messaging, raising confidence in public transport and how
we can secure capital investment in our infrastructure priorities.
4.
Connected Places Catapult New Mobility Technologies
Connected Places Catapult gave a presentation on their role, the catapult network and key workstreams. The CPC is
focussed on local places at varying scales, identifying the challenges for these places and working with SMEs to
provide innovate solutions. These challenges include Covid, Brexit, ageing population, rural mobility and resources to
progress solutions. New Mobility Technology team are here to:
Support the creation of a vibrant intelligent and connected mobility space that meets societies challenges of
today and the future.
Creating new opportunities for innovators, building confidence for buyers
Enabling the increased supply of innovative solutions through a fair, safe and secure operating environment
Projects cover a range of technologies: Ports, active travel, 5G, autonomous vehicles, rail and drones. CPC is starting
to scope an active travel programme and looking to work closely with local authorities.
How can we achieve a balanced approach between public transport and active travel? CPC work with users of both
modes to gain understanding of concerns and challenges, whilst active travel usage has increased public transport will
still be important for longer journeys. Need integrated planning and a demand responsive approach with the current
active travel trajectory considered alongside increasing the uptake of public transport.
Norfolk County Council has received funding from the Government active travel fund, running e-scooter trials and
refreshing walking and cycling strategy so would be very keen to work with CPC on active travel programme.
5
Action: DC/ST to connect on the active travel programme and feedback to the board how a balanced approach
between public transport and active travel can be achieved.
5.
New Anglia LEP Clean Growth Taskforce
Paper shared summarising the role and purpose of the taskforce (February 2020 board paper can be found here on
page 11) and table 1 collates the proposed actions put forward by board members.
Board agreed with action around electrification of rail in East Anglia particularly the opportunity for freight between
Ipswich and Felixstowe. It is estimated that electrification will take 10 years to deliver so we need to ensure we are
prepared for this. The KPMG Decarbonisation report also highlighted the theme on alternative fuels, particularly
relevant for electric vehicles and hydrogen. There is also the DfT Decarbonisation Strategy it would be useful under
item 3 action: JD/SO/KC/AS meeting to also map workstreams so we clear on roles/responsibilities.
Greater Anglia highlighted the new rolling stock and how additional capacity also leads to decarbonisation. We need
to lobby for projects that support both the regional and national recovery. Network Rail supports the view on additional
capacity being a major contributor to decarbonisation and early development has been made on the rail electrification
between Felixstowe/Ipswich with the freight benefits. We need to keep this momentum going and build the message
around improvements in this region creating benefits both the region and nationally.
EDF consulting on Sizewell and it is likely more materials will be transported by rail freight.
6.
Transport East update
Transport East updated on progress made since last board meeting: Secured £425k funding for the remainder of
2020/21 from the DfT for delivery of the Transport Strategy technical work and engagement programme, and COVID-
19 recovery studies, 2 new members of staff in post and consultants have been appointed to work on the TE strategy.
There are three main workstreams within the strategy development are:
1a Non-Transport Outcomes, 1b Three deep dive sessions: International Gateways, Re-energising Coastal and Rural
Communities and Post Covid Economic Recovery, 1c will be looking at a set of future scenarios. With stage 1a almost
complete emerging themes have been identified as
Climate change and adaption
Environmental protection
Carbon reduction
Diverse economy
Digital energy and health
The focus for the next 3 months is delivering the full Strategy engagement programme. This will largely be delivered
between November 2020 and March 2021, aligned with the technical consultants’ work plan. Key elements of this
include:
Focussed 1-to-1 engagement with Forum members and key stakeholders to understand aspirations in detail
Series of thematic, geographic and sectoral workshops to work through issues and identify potential policy
levers, these will include officers, politicians, operators, transport users, charity and representative groups -
for example the Ports roundtable and District council event
Public polling to understand pan-regional public priorities
Expanding our network through trusted third parties, widening awareness and understanding in preparation
for the Strategy consultation in summer 2021
Hosting our annual Transport East summit in early 2021, to ensure our wider partners are fully engaged in the
strategy development.
This work will all be supported and enhanced by the wider Communications and Public Affairs Strategy agreed at the
July meeting to build political advocacy, awareness raising and reputation building.
6
Action: All to contact AS if they have questions on the strategy development.
7.
Forward plan for 2021 and Any other business
Forward Plan
Paper shared on proposed forward plan for 2021 with the next meeting theme being Local and Coastal: Innovative on-
demand transport solutions and improvements to facilitate local sustainable growth, walking and cycling, recognising
local distinctiveness, and offering access to services and opportunities through digital means.
The table shows the themes for each meeting and the clear alignment with Transport East core themes.
Action: Board agreed 2021 forward plan.
Date of next meeting - March 18th meeting invite will be circulated shortly.
AOB
Greater Anglia updated performance levels have been high over the last 8/9 months and also flagged the timetable
consultation for December 2021 is currently live and is open for comments until 12th February 2021.
Suffolk Climate Change emergency plan shared with the Board, which highlights the need to take actions now and
Board members encouraged to read the report.
UK Connectivity Call for Evidence is currently underway and there is an important role for rail freight and Ports in our
region.
Action: TE/LEP to set up meeting between AS/SO/PS/JD to draft response to call for evidence
SO closed the meeting by summarising key discussion points:
Rebuilding confidence and safety around transport regionally and nationally
Importance of wider decarbonisation of transport sector
Link between strategies such as TE and working together to secure investment
Need to bring these key themes forward to Government
7
New Anglia Transport Board
Thursday 18th March 2021
Agenda Item 3
Terms of reference review
Author: Ellen Goodwin
Summary
This paper looks at the evolving role of the Transport Board and looks to review its terms of
reference in line with the broader objectives of the LEP, in particular clean growth. It also
looks to nominate a member of the Board to join the LEP’s Clean Growth Taskforce.
Recommendations
The Board are asked to:
consider the Board’s purpose, aims and objectives given the imperative around clean
growth;
approve the revised terms of reference for the Board;
consider how it might like to connect with other parts of the LEP governance; and
Nominate a member of the Transport Board to join the Norfolk and Suffolk Clean
Taskforce.
Background
The LEP Board received an update on the Transport Board at its February Board meeting.
The update focussed on re-aligning priorities around enabling and influencing, the growing
strength of Transport East and our alignment in terms of priorities, key project updates and
how we meet the wider priorities of the LEP Board: covid-19 response and recovery, clean
growth, international profile and trade and strengthening governance. The update can be
found here. This paper seeks a view on the Transport Board’s work programme, including
engaging with other areas of the LEP governance, in this context.
Clean Growth Taskforce
The purpose of the Clean Growth Taskforce is to embed clean growth in the development
and delivery of actions and decisions which deliver the Economic Strategy, and Local
Industrial Strategy and Renewal Plan. It will also help drive the shared ambition for a low
carbon and inclusive economic recovery that tackles the challenges and opportunities of
climate change.
In doing so the LEP is committed to the following in terms of clean growth:
Leadership and collaboration
A workforce fit for the future
Market forces
Industry decarbonisation
Innovation and commercialisation
Infrastructure decarbonisation
9
The New Anglia LEP executive team are currently reviewing the terms of reference for the
taskforce to reflect the changes seen since February 2020. They are also mapping the
existing partnerships, boards and groups who are already working in this area to understand
their focus/priorities, work programme, delivery actions, communications activity and
governance. This work will help to explore opportunities to work together and inform a gap
analysis to identify the areas where the taskforce could lead.
It is hoped that a Chair for the Taskforce be identified by the Spring and that the Taskforce
meet for the first time in the Summer. This paper seeks a nomination from this Board to the
Clean Growth Taskforce.
Terms of reference
The previously agreed terms of reference have been reviewed to reflect the growing clean
growth imperative. They are attached at Appendix A for the Board’s consideration and
approval.
The Transport Board’s purpose is currently defined as:
The New Anglia Transport Board will ensure current and future transport networks meet the
needs of both businesses and residents in order to support clean and inclusive growth.
This paper seeks a view on this and on the Board’s objectives and expected outcomes
which have been updated to reflect changing circumstances around governance, work
programme and most importantly clean growth, one of the LEP’s four current corporate
priorities.
Objectives:
The New Anglia Transport Board will provide strategic direction on transport issues by:
Acting as a forum for information and expertise sharing, discussion and debate
Acting as a powerful advocate for Norfolk and Suffolk
Maintaining, executing and monitoring the Integrated Transport Strategy Delivery
Plan, reporting to the New Anglia LEP Board
Directing the formation and work programmes of Task and Finish Groups to tackle
specific topics as necessary
Offering recommendations for prioritisation of projects for delivery and
subsequent monitoring of outcomes
Expected outcomes:
A reliable, resilient, integrated and clean transport network with improved
capacity and journey times, providing good connectivity both within and around
Norfolk and Suffolk, and to other UK, European and worldwide destinations
A Delivery Plan for the Integrated Transport Strategy for Norfolk and Suffolk, with
a clean growth focus that is current and valued by transport bodies
Central government understanding of the transport infrastructure needs and
priorities of Norfolk and Suffolk businesses and residents to support inward
investment and clean growth
The Board will monitor its progress via regular reporting to the LEP Board, the latest update
can be found in the February 2021 papers here.
10
Link to the Integrated Transport Strategy
The New Anglia Transport Board will provide a strong voice for Norfolk and Suffolk to ensure
that the best is secured for the area. It will also help to deliver the ambitious objectives set
out in the Norfolk and Suffolk Economic Strategy, the Local Industrial Strategy, the
Economic Recovery Restart/Renewal Plans and the Integrated Transport Strategy for
Norfolk and Suffolk.
Link to Clean Growth
The terms of reference have been reviewed to align with the LEP’s corporate priority around
clean growth and a member of the Board sought to sit on the Clean Growth Taskforce.
Recommendations
The Board are asked to:
consider the Board’s purpose, aims and objectives given the imperative around clean
growth/green recovery;
approve the revised terms of reference for the Board;
consider how it might like to connect with other parts of the LEP governance; and
Nominate a member of the Transport Board to join the Norfolk and Suffolk Clean
Taskforce.
Appendix A - terms of reference (2021)
11
New Anglia Transport Board - Terms of Reference
Introduction
New Anglia LEP is the Local Enterprise Partnership covering the geographical area of
Norfolk and Suffolk.
Norfolk and Suffolk are positioned as the UK’s clean growth region, the golden thread of
our Local Industrial Strategy. Collectively, New Anglia LEP has ambitious plans for
driving business growth and productivity in our diverse economy, for communicating our
offer to the world and for driving inclusion and skills. Norfolk and Suffolk are leading
places in the competitive global economy, with a large number of world leading
competitive clusters already based here.
Deleted: In addition Norfolk and Suffolk is positioned as
UK’s clean growth region, the golden thread of our
A modern, efficient and clean transport system is key to our future success. A mobile,
recently endorsed Local Industrial Strategy.
accessible and increasingly virtual world-class economy will ensure that Norfolk and
Deleted: and
Suffolk retains this enviable position and will benefit thousands of businesses of all sizes
Deleted: and
and open significant opportunities in our extensive supply chain network.
The New Anglia Transport Board will provide a strong voice to ensure that we can
secure the best for the area and deliver the ambitious objectives set out in the Norfolk
and Suffolk Economic Strategy, the Local Industrial Strategy, the Economic Recovery
Restart/Renewal Plans and the Integrated Transport Strategy for Norfolk and Suffolk.
Purpose
The New Anglia Transport Board will ensure current and future transport networks meet
the needs of both businesses and residents in order to support clean and inclusive
growth.
The New Anglia Transport Board brings together key transport specialists, pooling
transport expertise across the region to help shape the future transport system. It will:
Understand partners’ transport ambitions
Encourage a cleaner transport network that satisfies the needs of business and
Deleted: sure
residents both now and in the future
Deleted: the
Assess how New Anglia LEP and partners can best deliver the Integrated
Transport Strategy for Norfolk and Suffolk
Specific Activities/Objectives
The New Anglia Transport Board will provide strategic direction on transport issues by:
Acting as a forum for information and expertise sharing, discussion and debate
Acting as a powerful advocate for Norfolk and Suffolk
Deleted: on behalf of the New Anglia LEP
Maintaining, executing and monitoring the Integrated Transport Strategy Delivery
Plan, reporting to the New Anglia LEP Board
Deleted: Economic Strategy Co-ordinating Delivery
Board
Directing the formation and work programmes of Task and Finish Groups to tackle
specific topics as necessary
Offering recommendations for prioritisation of projects for delivery and
Deleted: <#>Producing and executing a stakeholder
subsequent monitoring of outcomes
management plan 
Producing a high-level work programme summarising
individual scheme progress 
Expected outcomes
12
A reliable, resilient, integrated and clean transport network with improved
Deleted: and
capacity and journey times, providing good connectivity both within and around
Norfolk and Suffolk, and to other UK, European and worldwide destinations
A Delivery Plan for the Integrated Transport Strategy for Norfolk and Suffolk, with
a clean growth focus that is current and valued by transport bodies
Central government understanding of the transport infrastructure needs and
priorities of Norfolk and Suffolk businesses and residents to support inward
investment and clean growth
Powers
The role of the Board is an advisory one, bringing expertise and transport knowledge. It
will feed into the Investment and Appraisal Committee to enable them to devise, deliver
and manage the relevant programmes.
Composition of the Transport Board (Membership)
ABP
CBI, East of England
Connected Places Catapult
Country Land Owners and Business Association
Department for Transport
East Midlands Trains
Federation of Small Businesses
First Group
Govia Thameslink Railway
Greater Anglia
Highways England
Hutchison Ports
Ipswich Buses
Liftshare
Network Rail
New Anglia LEP
Norfolk Chamber of Commerce
Norfolk County Council
Norfolk district representative
Norwich Airport
Peel Ports
Stansted Airport
Suffolk Chamber of Commerce
Suffolk County Council
Suffolk district representative
Sustrans
Transport East
13
Format and Frequency of Meetings
Meetings will be generally be open to the public
Meetings will take place quarterly and will take place ahead of Transport East
Forums.
Deleted: Venues will alternate between Ipswich and
Norwich
Format of meetings - Chaired by New Anglia LEP
Meetings are formally minuted, with agenda, papers and minutes to be published
via the New Anglia LEP website
Secretariat - New Anglia LEP will supply secretarial services, and meeting
support in terms of accommodation will be hosted/facilitated by Norfolk and
Suffolk County Councils
Papers to be circulated one week prior to Board meetings
The Board will work together by consensus
14
Norfolk and Suffolk Transport Board
Date:
18th March 2020
Item:
Transport East response to the DfT Rural Mobility Call for Evidence
Report by:
Laura Waters
Contact:
Purpose
This report sets out the key points from the Transport East (TE) response to the DfT Future of Transport:
rural strategy - call for evidence. Presenting alternative approaches to planning for rural mobility,
summarising the challenges both at a pan Sub-national Transport Body (STB) and TE level and how TE will
continue to lead the pan STB Rural Mobility Group. The full response can be found in Appendix A.
Recommendations
Norfolk and Suffolk Transport Board Members are asked to note the contents of the report and consider
the questions under section 5 the feedback from which will be used to inform the rural mobility work plan.
Questions for Norfolk and Suffolk Transport Board Members to consider:
What activities are organisations already undertaking to support rural mobility? This could include
strategies, plans, and shared learning.
Do we have examples of successful projects targeted at improving rural mobility in the region?
What are the opportunities to most effectively work collectively on rural mobility?
1.
Introduction
1.1
In 2019, the DfT published the Future of mobility: urban strategy, setting out their approach
to maximising the benefits and managing the risks of new technology in urban areas. The
DfT now want to explore the challenges and opportunities for rural areas.
1.2
Government have already started engaging with academia, industry, new mobility
operators, local authorities and other stakeholders to understand the challenges and
opportunities facing rural areas, and to identify existing good practice. This call for evidence
aims to build on this engagement and ensure that they are able to gather the views of all
those with a stake in how our rural communities can benefit from transport innovation.
1.3
Transport East (TE) responded to the DfT (See Appendix A) whilst also leading on the
response on behalf of the Sub-national Transport Body Group (STB). TE is the STB leading on
rural mobility as it is particularly relevant to region, is an opportunity to directly influence
government on rural issues and raises the profile of Transport East across England/DfT as a
national lead on this theme.
15
2.
Approach to developing response
2.1
Using the headings set out in the Call for Evidence consultation, feedback was collated from
both the STB Group and Transport East Senior Officer Group (TESOG) on the following:
What are the main rural mobility issues and challenges in your area?
What are the opportunities for solutions/innovations?
What strategic approach/principles should we recommend for rural mobility?
What is the role of STBs in rural mobility?
What are the headline points to communicate to the DfT?
2.2
This feedback alongside evidence/data from existing strategies and plans was then used to
develop the response focussing on: car dependency, accessibility to services, issues unique
to the TE region, considerations for innovation in rural areas and the roles of central
government, STBs and local authorities.
3.
Summary of the TE response
3.1
The full Transport East response can be found in Appendix A with the key points including:
A proposal for a place-based approach, based on understanding the specific
challenges within a local rural area, and identifying appraisal principles to establish
what ‘good looks like’, before identifying and testing solutions to address them.
Supporting a user-centric approach in which the needs of both current and future
residents and businesses are fully understood. Better engagement with rural
communities is fundamental to understand and provide better rural mobility
outcomes.
As a result of car dependency, transport in rural areas is generally more carbon
intensive than in urban areas. Reducing emissions needs to be prioritised through
the development of solutions for rural areas, but with due consideration for other
core outcomes including social inclusion and access to employment.
New ideas and technology to reduce the need to travel should be researched and
expanded. Better digital connectivity and new innovations (for example Rural Hubs)
have considerable potential to deliver place-based outcomes and should be
considered alongside any mobility solutions.
Highlighted levels of car dependency with rural households more likely to have two
or more cars, 34% compared to 25% of urban households and work journeys across
the TE region are dominated by cars, with 78% of commuter journeys carried out in
a private vehicle.
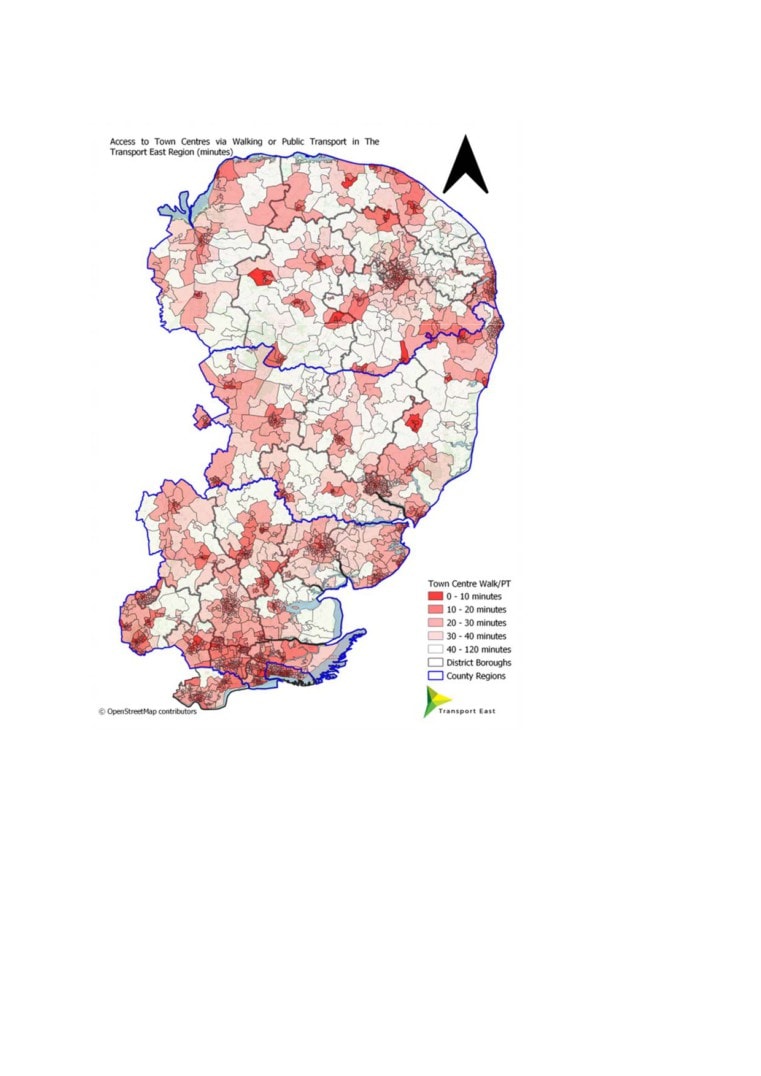
Accessibility mapping showing how just 48% of the TE rural population can access a
town centre within 30 minutes. 47% of the rural TE region are within 60 minutes’
walk/PT of a hospital and there is poorer accessibility to employment opportunities,
on average 48.5% of rural TE area is within a 15 minute walk or public transport
journey of employment compared to 52% of rural England but this falls to 36% of
rural Suffolk.
16
Other issues facing rural communities were raised including: digital connectivity,
ageing population, younger people, decline of rural centres, sparse population,
coastal population, social inequality and the visitor economy.
4.
Next Steps
4.1
To use this response to Initiate and plan the Transport East 2021/22 work programme on
Rural Mobility, identifying potential projects for DfT funding. Share best practice with the
STB Group with a working session on rural mobility strategies and solutions in the spring.
5.
Questions for Norfolk and Suffolk Transport Board Members to consider:
5.1
What activities are organisations already undertaking to support rural mobility? This could
include strategies, plans, and shared learning.
Do we have examples of successful projects targeted at improving rural mobility in the
region?
What are the opportunities to most effectively work collectively on rural mobility?
17
Appendix A
Title
DfT Future of Transport: rural strategy - call for evidence
Date:
16th February 2020
Report by:
Transport East (Sub-national Transport Body)
Contact:
Introduction
This is the joint submission from the seven English Sub-national Transport Bodies (STBs) in
response to the Department for Transport’s Future of Transport: rural strategy call for
evidence with an accompanying appendix setting out the key issues within the Transport
East region.
The role of STBs as set out in the enabling legislation1 is to develop a transport strategy that
meets the needs of persons living or working in, or visiting, the area having regard to social
and environmental impacts and facilitating sustainable economic growth. They bring a
strength of partnership among their membership to engage with government with one
voice.
STBs are working with their own partners, and with each other, to develop consistent, clear,
long term outcomes contained within agreed and evidence led transport strategies looking
out over a 20-30 year period. They therefore have a role in the development of the future
strategy for the rural areas they represent, as well as addressing common rural mobility
challenges across the STB regions, which has prompted this joint response to the call for
evidence.
In view of the timescales for making submissions this response has been prepared by senior
officials from the STBs.
Summary
The key points we wish to make in response to the call for evidence are as follows:
1. The traditional transport business case appraisal and delivery approach does not
provide optimal outcomes for rural residents. Rural areas are extremely diverse across
England, with challenges ranging across poor access to education and employment,
health inequalities, high per capita carbon emissions and social isolation. STBs propose
that a place-based approach should be adopted, based on understanding the specific
challenges within a local area, and identifying appraisal principles to establish what
1 The Local Transport Act 2008 (as amended)
1
19
Appendix A
‘good looks like’, before identifying and testing solutions to address them. Working with
DfT on the levelling up agenda so that decision makers and scheme promoters
understand how to present investment in a rural context.
2.
We also believe that a ‘customer’ focused user-centric approach is critical in
understanding the needs of residents and businesses and in achieving better outcomes
for our rural communities. Recognising that rural areas are both different from urban
ones and are not all rural localities are the same.
3.
As a result of high and often necessary car dependency, transport in rural areas is
generally more carbon intensive than in urban areas2, significantly impacting on our
goal for net zero emissions. Reducing emissions needs to be prioritised through the
development of integrated solutions for rural areas, but with due consideration for
other core outcomes including social inclusion and access to employment. This will be
from a range of solutions including rural hubs, digital connectivity and demand
responsive transport options.
4.
New ideas and technology to reduce the need to travel should be researched and
expanded preferably based on a collective approach. Better digital connectivity and
new innovations (for example rural hubs) have considerable potential to deliver place-
based outcomes and should be considered alongside any mobility solutions.
5.
The seven STBs fully support the development of a future of transport: rural strategy,
and can offer assistance to Government in the following ways:
Supporting delivery of an alternative place-based approach for developing and
appraising rural mobility solutions, starting with the collation of data and evidence
on the national/local challenges and issues, and using this evidence to agree the
strategic principles on which to base appraisal, and then identify location specific
place-based solutions rather than a prescribed approach. In planning for the future,
it is critical to understand the demographic, social, economic and technological
trends impacting on the needs of rural communities. STB’s can work with
Government on developing a programme of mobility options, which can be tailored
to meet local requirements and changing transport demands. For example, adapting
to increased levels of remote working and in some localities the potential for
combining flexible workspace with mobility services.
Helping to understand local needs in the context of national policy on rural
mobility. STBs operate at sub-national scale, developing their evidence base,
transport strategies and engagement within wider local partnerships, enabling us to
ask people, business and users what they want from rural mobility and what their
future needs are, whilst aligning with national government policy direction.
2 Midland Connect carbon baseline suggests that in the Midlands, rural areas account for 58% of the
population, but 75% of carbon from transport is emitted in those areas.
2
20
Appendix A
Prioritising investment to better support outcomes in rural areas. STBs focus on
place-based outcomes ensuring that we can develop solutions which recognise the
uniqueness of rural localities, whilst aligning to both local and national policy
outcomes. This allows our local partnerships to more effectively prioritise, manage
and deliver a portfolio of interventions that will work in their local ‘place’.
Promoting levelling up in rural areas. STBs’ place-based approach enables
investment to ‘level up’ areas - including within rural communities. By the end of
2021, each of the seven STBs in England will have a transport strategy/plan in place.
Developed using robust evidence bases, in partnership with planning authorities, and
through public consultation, these provide a focal point for prioritising infrastructure
investment across English regions. This approach ensures improvements to rural
mobility are coordinated and fully support the delivery of outcomes such as
“levelling up” areas.
Prioritising decarbonisation for rural mobility. The DfT goal to achieve net zero is
currently promoted by STBs through the development of carbon assessment tools,
identifying regional level decarbonisation pathways, and developing holistic
appraisal frameworks that assess carbon impacts. Recognising decarbonisation
solutions such as public transport or rollout of EV charging are often less
commercially viable in rural areas, STBs can work with Government in creating the
conditions that support transport innovations ensuring rural communities are not
left behind.
Bringing together local partners through thought leadership and collaboration on
innovative rural delivery - STBs act as a single voice, using the strength of their
partnership, and set a clear strategic direction for improved connectivity within their
regions. Through working together STBs can share case studies, projects,
prioritisation of projects that support a range of outcomes (e.g. levelling-up,
decarbonisation, accessibility and public health) - not just traditional transport
projects.
The following pages set out our detailed response to the questions set out in the Call for
Evidence:
Current trends facing the transport ecosystem in rural areas
Question: Do you have any evidence for the issues mentioned?
Dependence on the private car
Our evidence demonstrates significant reliance on the private car in rural areas across
England. Car and van accessibility data from the 2011 census showed on average across all
regions 28% of urban households did not have access to a car or van compared to 13% of
rural households. On average across all regions more urban households (43%) had access to
one car or van compared to 40% of rural households, however rural households had much
higher access to two or more cars and vans (47% of rural households compared to 29% of
urban households).
3
21
Appendix A
Transport for the North’s User Insight research34 shows that rural areas have a much higher
proportion of retired people (35%), compared with the overall sample across all areas in the
North (20%) and a lower proportion of people working full-time (27%, compared with 37%).
The proportion of participants with access to car as driver is much higher than average
(84%, compared with 72%). The level of dissatisfaction with current trips of Rural Residents
was higher than average, with main reasons for dissatisfaction being traffic congestion,
roadworks, poor road surfaces/potholes, and overcrowded carriages. Reported constraints
to travel were the unreliability of public transport, infrequency of public transport, and
public transport not being available in the evening/night.
2011 census travel to work data, showed on average across all regions 56% of travel to work
journeys are carried out by driving a car or van, increasing to 60% when London is not
included. Conversely, other modes for travel to work journeys are less popular, for example
10 % by walking, 7% by bus, minibus or coach, 5% as a passenger in a car or van and 3% by
bicycle. This presents an opportunity to consider how technology and innovation can reduce
emissions through the electrification of vehicles but to also explore how to increase
consumer access to other transport options, which could include demand responsive public
transport, new forms of micro mobility such as e-bikes or scooters and active travel for
more local trips.
Similar to car dependency, access to services in rural areas does have local variations and
these need to be understood when developing mobility solutions. The ONS Car or Van
availability data highlights varying levels of car dependency ranging from the regional to
local authority level, for example 22% of rural households in the North East do not have
access to a car or van compared to 10% in the West Midlands and Southeast. Even amongst
Local Authorities with the same rural classification, there are a different ranges of car
dependency for work journeys - e.g. North Norfolk 34% compared to 50% in Forest Heath.
Transport has traditionally been the “glue” which holds rural communities together and
needs to be seen in a wider context considering the needs of rural population and business
to ensure the solutions developed through this strategy understand the differences
between places so the most effective interventions can be deployed.
Access to key services, employment and social isolation
All seven STB Transport Strategies include policies and interventions to create an inclusive
transport network, which is accessible for all and part of a wider system of connectivity.
Within many rural communities, the connectivity options, both physical and digital,
available to residents and businesses are often limited, bringing with it implications that
extend beyond the transport sector.
3 TfN User Insight Phase 1, published July 2018
4 TfN User Insight Phase 2, published June 2019
4
22
Appendix A
Journey statistics data released by the Department for Transport shows that average
minimum journey times (for 8 different services5) by various transport modes can take over
three times longer in rural areas compared to urban. It takes over 3 times longer to access
employment centres with 100-499 jobs by taking public transport or walking, over twice as
long to cycle to employment centres over 500 jobs and twice as long to access further
education facilities by public transport or walking in rural localities than urban. The smallest
difference was between the time taken to make car journeys with these taking on average a
third longer in rural areas, evidencing the current reliance on the car to make journeys
within a reasonable travel time.
The Inequalities in Mobility and Access in the UK Transport System March 20196 Report
supports this, finding over half of the working-age population (57%) live in areas with low
public transport access to jobs, i.e. within reach of 45 minutes travel time and 66% (7.8
million) of elderly people cannot reach a hospital within 30 minutes by public transport. The
gap between accessibility for LSOA rural areas versus LSOA urban areas is clearly evidenced
for employment, education and health care. These access issues disproportionately impact
those without access to a car, severely impacting access to employment opportunities and
key services. Key differences for employment, education and health are set out as follows:
Employment: 19% of the LSOA urban areas have the highest accessibility to
employment opportunities compared to 4% of the LSOA rural areas. The highest
proportion (28%) of the rural LSOA have the lowest level of accessibility to
employment.
Education: Only 1% of the children in urban LSOAs are not within a 30 minute public
transport journey of one school compared to 28% of children in rural LSOAs. 90% of
children in urban LSOAs are within a 30 minute journey of two schools compared to
29% of children living in rural localities.
Health: 91% of rural LSOA are not within a 30 minute public transport journey to a
hospital compared to 55% of urban ones and less than 1% of rural LSOA have access
to two hospitals.
Accessibility by non-car modes is getting worse in many locations, as demonstrated through
local case studies. For example, accessibility indicators monitored for the Norfolk Local
Transport Plan show the % of the population in rural areas able to access a market town or
key employment destination by public transport has declined from 77% in 2010 to 64% in
2019.
As for car dependency, access to services in rural areas does have local variations and these
need to be understood when developing mobility solutions, for example, using another case
study, Journey statistics data released by the Department for Transport shows it takes on
average a 38 minute walk or public transport journey to the nearest town centre in North
Kesteven compared to 7 minutes in Uttlesford but both have the same rural classification.
5 Centres of employment, primary school, secondary school, further education, GP, hospital, food store and
town centre
6 Future of mobility: inequalities in mobility and access in the UK Transport System (publishing.service.gov.uk)
5
23
Appendix A
Question: Do you think there are other issues facing rural areas that we should consider in
the strategy?
Digital connectivity: working from home, online services and home deliveries have
increased significantly since the start of the COVID-19 pandemic, but the Government’s
National Infrastructure Strategy highlights the majority of commercially unviable giga bit
broadband is in rural locations. Digital connectivity and infrastructure are critical for
innovative services to be cost-efficient and successful.
Digital platforms may increase the reach of demand-responsive services (e.g. car/ride-
sharing or demand-responsive buses) and enhance the independent mobility of people in
rural locations. The uptake of digitally enabled transport services depends on the right
digital infrastructure being put in place with measures to encourage the use of digital
platforms, such as demonstrations or pilots, needing to be implemented alongside the
services. These types of projects will need initial financial support that local authorities may
not be able to offer to make the market work and services affordable in rural areas.
Ageing population: From 2016, over 80% of population growth to 2041 will be in the over-
65 age group, with the number of people over 85 almost doubling from 1.6 million to 3.2
million over the same period (Office for National Statistics, 2018a). In some areas, up to 40%
of the population will be over 65 by 2037 (Office for National Statistics, 2016), while people
aged over 65 will become the largest population segment in rural areas by 2040.
Older people today travel more than they did 20-25 years ago, with everyday trip rates
higher and activities outside the home being more common. Transport’s socially enabling
aspects are particularly important for older groups, and with a rural population ageing it is
important to consider older people’s mobility challenges and demands, which differ from
other stages of life.
Younger people: It is not just the low number of public transport routes served that affects
accessibility, it’s also the low frequency and timing of many services makes it less likely that
they meet young people’s requirements for independent mobility, limiting access to work,
education and leisure activities. Without access to a car or digital alternative, the lack of
regular, reliable and affordable public transport is a factor that can affect young people in
rural areas, worsening their job and education prospects meaning an out migration of young
skilled workers to urban locations with better access to employment opportunities and
services.
The Community Life Survey 2016-17 found the ‘loneliest’ age group were those aged 16-24
years. This finding was supported in ‘the loneliness experiment’ which was an online survey
of 55,000 people that found that 40% of 16-24 year olds reported often feeling lonely,
compared with 27% of over 75s. Highlighting the importance of young people in rural areas
having access to a range of services that provide social interactions.
Decline of rural centres: Limited public transport and declining local services are major
factors behind poor accessibility in rural areas and help to explain the car-dependent
behaviour often found. The revival of rural centres that serve local communities offers the
6
24
Appendix A
opportunity to concentrate demand for travel in ways that support connectivity to adjoining
urban areas or areas of economic opportunity.
The Midlands Connect Future of Rural Mobility study demonstrates the concept of ‘rural
hubs’ in more detail. It showed that integrating not just public transport but future mobility
solutions and a comprehensive network of pedestrian and cycling routes within rural
settlements would aid this hub concept. The potential long term changes to work patterns
could help reinvigorate rural centres with more people working from home rather than
travelling to urban areas, using local services improving their viability.
Sparse population: There are difficulties in integrating transport services, given the
dispersed nature of residents, and the low population density in rural areas makes it difficult
to operate profitable commercial local transport services. Demand is also low, due to the
tendency towards car use. As a result, subsidies are often needed to run public transport
services in rural areas. Maintaining subsidies becomes more challenging in times of
economic constraint (and reduced demand caused recently by social distancing). A variety
of different solutions needs to be considered alongside DRT, including lift shares, car shares
and other non-car based transport; e-bikes and rural hubs.
Social Inequality: The Government Office for Science The Future of Mobility report found
rural households on average have to spend 24% more of their income on transport costs
compared to urban households. The consequences of limited transport provision are felt
more severely by poorer households, as they have less financial capacity to adapt (i.e. to use
alternatives). The poorest people have a greater reliance on public transport, so reductions
in services have a greater impact on them with 20% of the most deprived communities
being in rural areas. The impact of car dependency in rural areas is significant, without
access to a car you are effectively excluded for access to economic and social opportunities,
whilst households without a car are relatively rare the effect this has is enormous.
The decline in rural bus service provision: The Campaign for Better Transport highlights the
decline that has occurred in rural bus service provision. Rural areas have significantly lower
rates of bus use compared with urban areas. However, buses remain an important part of
rural life. Over a quarter of all bus passenger journeys in England outside of London are in
predominantly rural areas or towns with rural hinterlands. There has been a spiral of decline
in rural public transport, which has been exacerbated by pressures on local government
finances in recent years resulting in reductions in support for bus services. Between 2011/12
and 2016/17, rural bus mileage fell by over six per cent. The forthcoming National bus
strategy will provide an opportunity to re-evaluate the role of buses in providing for the
mobility need of those in rural areas.
7
25
Appendix A
Developments in innovation for rural transport: Increasing use of active
travel modes, Micromobility, More effective integration of journeys, Digital
models for more flexible services, Data and digital improvements unlocking
market knowledge, New modes and Strong community links?
Question: Do you think there are other trends in innovation we haven’t included?
Quality rural data and evidence base: The STBs recommend using an evidence led approach
to understand different places have varying travel patterns and needs, ensuring solutions
are the right ones required at a local and regional level. These issues can be collated and
used to develop the strategy principles/approach, which lead to the most suitable place-
based solution. There is no one-size-fits-all approach to rural mobility; each place needs a
tailored approach to ensure its challenges are adequately addressed. This would facilitate
long term planning of the transport network that takes a collective approach considering
the needs of the user and the various modes available to find robust solutions.
Engaging hard to reach groups: When developing mobility solutions or new modes of
transport, engagement tends to reach existing users or more affluent parts of society. Those
who rely on public transport away from the larger urban areas often miss both the
opportunity to share their current and future needs and benefit from transport innovations.
To create a viable alternative to using a car we have to reach out to groups who may be
excluded - unemployed, those on lower incomes, need assistance to access a job, training
or education. When planning for rural mobility better data related to young people and
working age people without cars is important to be able to identify the most appropriate
travel option to meet their needs.
Mobility hubs: The establishment of ‘mobility hubs’ that serve local communities offers the
opportunity to offer ‘frictionless’ interchange between modes, primarily bus, rail and active
travel. In addition, mobility hubs provide an opportunity for integrated planning of modes,
integrating not just public transport but future mobility solutions and a comprehensive
network of pedestrian and cycling routes. These hubs will be different in rural areas
compared to urban acting more as service hubs that bring transport solutions together.
Mobility hubs are locations where demand for movement can be concentrated in a way that
supports local public transport services, primarily via bus-provision, ensuring greater
opportunity to run services where they otherwise may not have been viable. This type of
hub can also reduce the need to travel by bringing services into the community. Currently,
with a lack of bus services people have no alternative but to start their journey in a car
however through appropriate investment we should try to ensure they don’t need to also
finish their journey by car. Investing in this type of hub with a rapid transit system will get
people to their final destination efficiently and without causing congestion.
Whole journey approach: Decisions on rural mobility should be made that improve the
whole transport system and considering all modes of transport together will help to achieve
government goals and wider benefits. Alongside measures that maximise the use of
transport infrastructure managing demand is also important. The improvements in
supporting infrastructure such as digital are necessary for on-demand travel with real-time
8
26
Appendix A
information that could remove problems encountered when changing between modes, and
optimisation of the last mile. It may also create new opportunities in rural areas to run
services that are more commercially viable and deliver more affordable mobility to users.
Coordination of freight: The last mile of freight to its final destination (usually smaller
retailers or consumers) is labour intensive, accounting for 30-50% of supply chain costs, it
also generates the most CO2 per tonne moved. Last-mile delivery is becoming increasingly
important with consumers’ demands for faster, more frequent and more precisely timed
deliveries having environmental and economic consequences. In rural areas with smaller
and more frequent deliveries alternative business models such as freight sharing could be
trialled.
Our approach
Question: Do you think the Future of Transport: rural strategy should include the Urban
Strategy principles? Which additional principles would you like to see in the strategy?
The same principles can be applied to the Rural Mobility Strategy to an extent however as
outlined in the ‘developments in innovation’ section, a key principle for the Rural Mobility
Strategy should be to start with the creation of a high quality data and evidence base that
identifies the needs of a rural population, businesses and users to ensure the most effective
solutions are provided.
The principles and approach of the strategy need to be developed before the solutions and
be evidence led. In-depth engagement with a range of stakeholders is required to
understand rural travel patterns, users current and future needs and ensure hard to reach
groups are represented. This evidence is then used to reframe the rural mobility challenge
and a toolkit of the types of solution that are brought out of this covering: accessibility to
services and jobs, supporting skills and education, decarbonisation and digital connectivity.
The Urban Strategy refers to active travel remaining the best options for short journeys;
however, the rural strategy should acknowledge the rural residents make longer journeys
than urban residents and travel 118% more miles per person than someone living in
London.7 It will need to consider the challenges rural locations face in the first and last miles
of their journey and how improvements to cycle and walking routes will be required to
encourage active travel. The strategy should ensure improved accessibility by active travel is
considered for everyday activities such as journeys to work and key services, and not just for
leisure purposes.
The strategy should seek to understand the consequences of changes in connectivity. There
is evidence from Cornwall that improved digital connectivity has led to increased migration
to the area, subsequently creating housing affordability issues for local people. Similarly,
7 The Midlands Connect carbon baseline work suggests that 70% of car emissions made by urban dwellers are
from 1-5 miles (i.e. cycleable length); but this is only 19% in rural areas. 50% of car emissions made by rural
dwellers are from journeys over 10 miles.
9
27
Appendix A
automation of vehicles may lead to increased congestion and the need for reskilling the
workforce, and a reliance on digital connectivity may further isolate those who are digitally
excluded or who use journeys to their local centre for social interaction, unless mitigation is
put in place.
Encouraging transport innovation in rural areas: Testing and trialling
Question: Are there specific considerations for testing and trialling new technologies in
rural areas that you think we should consider?
The decline in the viability of traditional public transport solutions, combined with
continued challenges in accessing reliable digital connectivity, emphasises the need to
encourage new models of connectivity for rural communities and the businesses that
operate in them.
Digital coverage: Digital connectivity is a driver of social change and presents new
opportunities to integrate transport modes, however as evidenced in the National
Infrastructure Strategy, large areas of predominantly rural localities have a much higher
percentage of premises which are uncommercial for gigabit-capable roll-out. The Shared
Rural Network will also have to meet its target to deliver high-quality 4G mobile coverage
from at least one operator across 95% of the UK by 2025. Testing and trialling new
technology in rural areas will need to consider the outcomes using existing coverage and
what can be achieved as coverage improves.
Sparser densities: Rural areas have a lower population density compared to urban areas,
which means there is often a lack of critical mass for both population and businesses to
make testing new technologies viable for the private sector. Innovation should consider how
outcomes can be shared and boosted through collaboration with other projects and
services. The way schemes are currently assessed through traditional methods are often not
suitable for untried territories, excludes latent demand and disadvantages sparser
populations, a new minimum service standard model could be trialled for assessing the
impact of schemes in rural areas.
Non-transport related outcomes: When trialling and testing new innovation, we should
ensure it is designed to support other outcomes relating to health, education and social
exclusion, and ensure this is measured. As set out in the trends section, the population living
in rural areas are some of the most deprived, have to travel further to access services and
may struggle with exclusion. A number of STBs have identified that improving active travel
options in rural areas would contribute towards achieving these types of outcomes.
Increasing visibility: Rural users often have difficulties in seeing the transport services on
offer, with low exposure outside of core passenger groups. It can be difficult for people to
know what journeys are being run and how these join up to destinations. Making
information on these services easy to view and better online booking and payment needs to
be considered when trying to attract new passengers. Visibility needs to improve across all
transport modes with a comprehensive programme of awareness raising and behaviour
10
28
Appendix A
change covering all forms of transport including more informal and community focussed
solutions.
Roles for government, sub-national bodies and local authorities
Question: In your view, what should the role of the below be in encouraging innovation in
rural areas?
Central Government: Outline a clear long-term national vision and goals that are mindful of
diverse local priorities, clear and consistent messaging, taking a whole system approach to
transport, funding aligns with strategy outcomes, be clear on roles and responsibilities.
Sub-national Transport Bodies: STBs provide a Single voice and evidence base for their
regions, taking a place-based tailored approach to local and regional transport planning.
They link strategy to funding, drive knowledge sharing (e.g. by coordinating regional case
studies) and join up opportunities to replicate projects. The partnerships enable
collaborative approach, promoting public and private sector interventions, and prioritisation
of projects that support a range of outcomes.
Local Authorities: Community engagement, local planning, responsibility for delivery of
transport (important to differentiate between Local Authorities and Local Transport
Authorities in 2-tier areas - different roles and remits), detailed knowledge of place, monitor
local indicators, plan and promote active travel options.
Question: Do you think government can encourage the private sector to develop
innovative new transport services in rural areas?
The National Infrastructure Strategy states that where it is less certain what technology will
provide the most effective route to decarbonisation or where it is unclear how the
technology can be scaled commercially, the government will fund R&D programmes to
support innovation, given the challenges of rural areas a fund set up for rural mobility would
support the private sector and enable new innovations to be trialled.
Government plays a role in spurring innovation and can support technology development in
areas where barriers inhibit private sector investment in innovation, or there is a wider
social benefit from directing innovation (which is a key priority of the Governments
Industrial Strategy). There are already examples of Government facilitating innovation
through grants supporting infrastructure for hydrogen fuelling and electric charging points
and funding for electric buses, electric scooters and subsidies for electric cars, but these
projects are often focussed on urban areas with dense populations and are not meeting the
challenges found in rural areas. Through place-based solutions the public sector can
promote opportunities to the private sector and utilise the regional role of STBs to bring
projects together at a scale that makes them commercially viable.
The share of data collected, analysed and managed by the private sector is growing and its
value is increasing. Having access to this data is of importance to local, regional and central
government and other companies, who could use it to plan, operate, better integrate and
provide services.
11
29
Appendix A
Question: How do you think government should encourage the private sector?
The STBs would propose that options include:
Implement a set of rural mobility demonstration/pilot projects where learning can
be shared across regions and where appropriate replicated in other areas. Support
this innovation with a long-term funding plan as rural services take longer to become
commercially viable.
Find and promote synergies with urban areas to expand innovation into rural areas.
Supporting rural innovation clusters where networks of skills, learning and resource
can be shared.
Provide a clear pathway for example on alternative fuels and electric vehicles to give
confidence to the private sector to invest.
Capture the value of investment that generates non-transport related outcomes, for
example linking to elderly care or providing real time information to users or
attracting new businesses to rural hubs. Creating additional incentives to invest in
infrastructure as a means of delivery for new innovative services.
Question: Do you have any other comments on this call for evidence?
No further comments.
12
30
Appendix A
Transport East (TE) Appendix
This appendix complements the national response by providing a focus on the key issues
within the Transport East region. It sets out our top five headlines, and then provides more
details in response to the DfT’s questions.
Transport East - Key Points:
1.This region has a higher than average car dependency with only 13% of households not
having access to a car/van compared to 26% of England. The trend for higher car
dependency increases in rural areas with twice as many households having access to a car
compared to urban areas. Work journeys are also dominated by the car with 78% of
commuter journeys carried out in a private vehicle.
2. Only 10 of the 109 larger rural communities in the TE region have access to ultrafast
broadband, with all but two of the remainder having a superfast option and coverage low
spots are more prevalent in more sparsely populated rural communities. Those
communities that have less than ultrafast broadband could come across limitations to
utilising digital services, for example on average only 38% of the TE residents are able to
work from home.
3. The proportion of the TE population over 65 at 2019 was 20%, higher than the national
average of 18%, Norfolk has a figure of 24.5%. This older population is also anticipated to
grow at a faster rate than the rest of England, on average across the TE region 26% of the
population will be over 65 by 2045 compared to 24.2% England but these figures are higher
in Norfolk (30.5%) and Suffolk (31.2%).
4. The region has below average levels of accessibility to key services and employment
compared to England. Mapping shows how just:
48% of the TE rural population can access a town centre within 30 minutes, this
figure is 36% in Norfolk
47% of the rural TE region are within 60 minutes’ walk/PT of a hospital, 35% for
rural Norfolk compared to rural England 57% and 94% urban England.
48.5% of rural TE area is within a 15 minute walk or public transport journey of
employment compared to 52% of rural England, this figure is 36% in rural Suffolk.
5. The visitor economy of the East of England (includes areas outside the Transport East
region)8 is valued at more than £10bn a year making it the largest industry sector and the
largest employer with 240,000 people employed. The Visit East of England Tourism Business
Survey (June 2020) found 81% of respondents had to temporarily close their business, 46%
had to furlough staff and over half experienced widespread booking cancellations. With a
more positive outlook in 2021 for “staycations” supporting this sector is vital to further
support the resident's businesses and jobs, and to further invest in appropriate transport
infrastructure to facilitate growth.
13
31
Appendix A
The Transport East response to the DfT questions are set out in more detail as follows:
Current trends facing the transport ecosystem in rural areas
Dependence on the private car
2011 Census data shows across the TE region only 13% of households do not have access to
a car, compared to 26% across the whole of England. The majority of households (44%) have
access to 1 car/van and a further 27% have access to 2 cars/van.
The trend for higher car dependency increases in rural areas compared to urban, as 23% of
urban households do not have access to a car/van compared to 12% rural areas. Although a
higher number of households in urban areas (45%) have access to one car/van compared to
rural areas (40%), rural households are more likely to have two or more cars (34% compared
to 25% in urban households), twice as many rural households have three cars/van and four
times as many rural households have four cars/vans or more.
Work journeys across the TE region are dominated by cars, with 78% of commuter journeys
carried out in a private vehicle. The region has a lower than average journey to work bus
mode share (4% compared to an average of 7% for England) and only 2.5% of the workplace
population commute by rail.
By transportation mode, road transport is the largest contributor to emissions, accounting
for 96% of the total transport carbon emission in Essex, Norfolk, Suffolk, Thurrock &
Southend.
There is a need to recognise the differences between places within the TE region and a one
size fits all approach to rural mobility will not lead to the most effective solutions being
implemented. For example, access to one car/van varies from 37% in Essex and 43% in
Norfolk and Local Authorities with the same ‘Mainly Rural’ classification have varying
reliance on the car for their journey to work - 2011 Census method of travel to work data
shows North Norfolk 34% compared to 50% in Forest Heath. Where a solution has been
successful is it important to identify if there are locations with similar characteristics where
it could also be deployed and given the rural and sparse nature of the region solutions may
also need to work across political boundaries.
14
32
Appendix A
Access to key services, employment and social isolation
The map shows how just 48% of the TE rural population can access a town centre within 30
minutes, this figure is 36% in Norfolk.
Both the Suffolk and Essex LTPs highlight poor accessibility to health services. North-east
Suffolk has very poor access to A & E hospitals and a third of Essex households without a car
are located in the rural districts of Braintree, Maldon, Tendring and Uttlesford. Of these
households, around 40% do not currently have good access by public transport to a GP
centre. The mapping of access to health services across the TE region support these findings
with 47% of the rural TE region within 60 minutes’ walk/PT of a hospital, 35% for rural
Norfolk compared to rural England 57% and 94% urban England.
15
33
Appendix A
76% of rural TE are within 30 minutes’ walk/PT of a GP compared to 81% for rural England
and only 48% of rural residents can access a town centre in 30 minutes by walking/PT (this
figure is 36% in Norfolk).
Rural areas of the TE region also have poorer accessibility to employment opportunities. On
average 48.5% of rural TE area is within a 15 minute walk or public transport journey of
employment compared to 52% of rural England. Only 36% of rural Suffolk is within a 15
minute walk or public transport journey of employment with then only 77% of residents
within 30 minutes. The differences between places needs to be considered through a place-
based approach - for example a higher proportion of people across rural Thurrock, Essex
and Norfolk are able to make longer 30 minute journeys to employment (91%, higher than
rural England 84%) than rural Suffolk. Only rural Thurrock has above average accessibility for
shorter 15 minute employment journeys with rural Norfolk and Essex (46% and 36%) being
below the rural England average of 52%.
DfT journey time data to primary schools by walking/public transport shows in general, the
Transport East Region is well connected to Secondary Schools with pockets of poor access
associated with areas in rural Norfolk and Suffolk with journey times of over an hour.
According to the Department for Education’s 2014 guidance, maximum journey times to
secondary schools should be no more than 75 minutes. When considering the deprivation
index for education, TE communities have good access to secondary education by walking
and public transport, yet still score poorly on the Education decile. Therefore, good
transport to secondary schools is not a guarantee of low educational deprivation. These
results could show that skills retention in these areas are an issue, in that the young
educated residents leave the area to take up better paid jobs elsewhere, leaving those with
a poorer educational attainment behind.
2011 census loneliness prevalence data shows in general, residents living in households
aged 65 and over in rural areas do not have a problem with loneliness, apart from pockets
of rural towns in Norfolk, and some coastal communities. Areas with a value closer to 0
predict a greater prevalence of loneliness, the average score across all TE local authorities is
-4.1 compared to -3.9 for England. However, prevalence for loneliness is higher in the over
65’s with rural and coastal TE communities having a growing older population.
Natural England has devised the Accessible Natural Greenspace Standard (ANGSt), which
sets out the minimum amount of accessible natural greenspace that any household should
be within reach of. The criteria state that:
an accessible natural greenspace of at least 2 hectares in size, no more than 300
metres (5 minutes’ walk) from home;
at least one accessible 20 hectare site within two kilometres of home;
one accessible 100 hectare site within five kilometres of home; and
one accessible 500 hectare site within ten kilometres of home
In Essex, the largely rural districts of Tendring, Uttlesford and Braintree have the highest
proportions of households without good access to natural green space with 59%, 54% and
35% respectively. Whilst rural areas may cover areas of greenspace this data shows the
16
34
Appendix A
importance of quality connections to ensure residents can access and benefit from these
environments.
Question: Do you think there are other issues facing rural areas that we should consider in
the strategy?
Digital connectivity: Only 10 of the 109 larger rural communities in the TE region
have access to ultrafast broadband, with all but two of the remainder having a
superfast option. Coverage low spots are more prevalent in more sparsely populated
rural communities and farms outside of the larger villages and market towns in the
region. Mapping shows coverage low spots in rural Uttlesford/Braintree and North
Norfolk as examples of the problems facing rural communities in the East outside of
the larger rural settlements. Those communities that have less than ultrafast
broadband could come across limitations to working from home (on average 38% of
the TE residents can work from home) should more than one member of the
household try to do so, or if other demands on the internet, such as streaming, are
required simultaneously.
Older population: The proportion of the TE population over 65 at 2019 was 20%
higher than the national average of 18%, Norfolk has a figure of 24.5%. This older
population is also anticipated to grow at a faster rate than the rest of England, on
average across the TE region 26% of the population will be over 65 by 2045
compared to 24.2% England but these figures are higher in Norfolk (30.5%) and
Suffolk (31.2%). Transport’s socially enabling aspects are particularly important for
older groups. Giving up driving is linked to a decrease in well-being and an increase
in depression and related health problems, including stress and isolation, and also
with increased mortality, it is therefore important to consider older people’s mobility
challenges and demands, which differ from other stages of life.
Younger people: The TE region has a comparable number of younger residents aged
15-24 (10.7%) compared to England (11.7%) and estimates to 2041 predict that the
number of 15-24 year olds in the region will remain at these levels. Access to
Secondary Education is not generally a problem in the region, but there is still high
educational deprivation in some areas. This implies that skills retention in these
areas is an issue, in that the young, educated residents leave the area to take up
better paid jobs elsewhere.
Decline of rural centres: Small businesses are prevalent on local high streets and in
town centres - increased working from home and the unlikelihood of people
returning to large office spaces will change the transport patterns for these
employees. There is an opportunity to strengthen the attractiveness of more of the
East’s towns and villages for future 1-2 day a week commuters and maximise the
wider impacts for local economies, and tackle some of the deprivation found.
Improving public realm and pedestrianising public space could transform rural
town centres, providing leisure and outdoor business opportunities, boosting both
the day and night-time economy. Improving walking and cycling routes generally
across the region, including consistency of quality, has the added benefit of
promoting an active lifestyle.
17
35
Appendix A
Sparse population: 33% of the Transport East region live in rural areas (2011 Census)
but this varies considerably within the region with Norfolk and Suffolk with 50% and
40% of their populations living in rural areas, Essex has 26%, Thurrock 13%, and
Southend has no rural areas. Within the rural areas 22% of the population is over 65
years old, and 58% are between 18-65. Rural areas tend to have higher levels of car
ownership due to less access to public transport and unwalkable journey times to
key services. Many areas suffer with retention issues for young graduates who are
more attracted to more skilled, better paid jobs in urban areas.
Coastal population: Approximately 700.000 people (2011 census) in the region live
in coastal areas accounting for about 21% of the population. The coastal districts of
North Norfolk and Tendring have the highest proportion of their population that are
over 65 years old with 29% and 27% respectively. Coastal areas in the region tend to
have higher levels of deprivation compared to the national average across all metrics
for example the majority of homes in the coastal communities analysed in the Draft
TE Transport Strategy have access to a minimum superfast broadband. The region’s
coastal resorts are also reliant on seasonal tourism, with other job opportunities
more limited.
Social Inequality: The Living Environment Deprivation score shows the vast majority
of rural Norfolk, and rural North Suffolk are in the top 20% most deprived areas in
the country for Living Environment. Towns and larger settlements have a better
score. When a cross reference to all the IMD Metrics is compared across the region
there are some stark differences between areas, with the least deprived areas
clustered towards urban centres.
Visitor economy: When focussing on both rural connectivity and growth locations
the TE region has considerable assets in the visitor economy sector (heritage, culture
and tourism). The visitor economy of the East of England (includes areas outside the
Transport East region)9 is valued at more than £10bn a year making it the largest
industry sector and the largest employer with 240,000 people employed. In 2019 it
contributed 8.84bn to the East of England’s economy. The Visit East of England
Tourism Business Survey (June 2020) found the majority of respondents expect
turnover to be lower in 20/21 than 19/20 but almost a third of respondents did not
want to predict their performance for the last year highlighting the level of future
uncertainty across the sector. 81% respondents had to temporarily close their
business, 46% had to furlough staff and over half experienced widespread booking
cancellations. The level of cancellations does decrease moving into 2021 with a more
positive outlook on “staycations” with feedback that there have been more
provisional bookings for 2021 and January 2022 than usual. Supporting this sector is
therefore vital to further support the resident's businesses and jobs, and to further
invest in appropriate transport infrastructure to facilitate growth.
18
36
Appendix A
Developments in innovation for rural transport: Increasing use of active
travel modes, Micromobility, more effective integration of journeys, Digital
models for more flexible services, Data and digital improvements unlocking
market knowledge, New modes and Strong community links?
Question: Do you think there are other trends in innovation we haven’t included?
No further comments to those made in the Sub-national Transport Body joint submission
response.
Our approach
Question: Do you think the Future of Transport: rural strategy should include the Urban
Strategy principles? Which additional principles would you like to see in the strategy?
No further comments to those made in the Sub-national Transport Body joint submission
response.
Encouraging transport innovation in rural areas: Testing and trialling
Question: Are there specific considerations for testing and trialling new technologies in
rural areas that you think we should consider?
No further comments to those made in the Sub-national Transport Body joint submission
response.
Roles for government, sub-national bodies and local authorities
Question: In your view, what should the role of the below be in encouraging innovation in
rural areas?
No further comments to those made in the Sub-national Transport Body joint submission
response.
Question: Do you think government can encourage the private sector to develop
innovative new transport services in rural areas?
No further comments to those made in the Sub-national Transport Body joint submission
response.
Question: How do you think government should encourage the private sector?
No further comments to those made in the Sub-national Transport Body joint submission
response.
Question: Do you have any other comments on this call for evidence?
19
37
New Anglia Transport Board
Thursday 18th March 20201
Agenda Item 8
Transport Board Forward Plan 2021
Author: Ellen Goodwin
Summary
This paper seeks the Board’s input on the 2021 Forward Plan for the Transport Board with the view of
successfully delivering the Integrated Transport Strategy and aligning with the core themes of the Transport
East Investment and Delivery plan.
Recommendation
The Board offers suggested input to the Transport Board Forward Plan 2021
Background
The Integrated Transport Strategy, adopted by the LEP Board in May 2018 has the following themes:
Connecting the East, Accessing the World: Quicker, more reliable, and resilient strategic connections
to boost our contribution to UK plc., encouraging improved perceptions, economic participation and
inward investment for our key sectors and competitive clusters.
Agile to Change: Embracing new technologies and digital connectivity to enable remote access to
services and opportunities to facilitate Mobility as a Service (MaaS).
Regional Connectivity and Our Priority Places: Keeping people and products moving in and around our
growing Priority Places and Enterprise Zones through new investment, placemaking, maintenance and
an integrated public transport network with opportunities for walking and cycling.
Local and Coastal: Innovative on-demand transport solutions and improvements to facilitate local
sustainable growth, walking and cycling, recognising local distinctiveness, and offering access to
services and opportunities through digital means.
Appendix A outlines a draft forward plan for the Board’s input. The Board are asked to consider what items
it would like to consider during the next year and agree the forward plan for 2021.
Link to the Integrated Transport Strategy and Transport East
Outlined above and in Appendix A.
Link to Clean Growth
The forward plan includes elements of clean growth throughout its programme.
Recommendation
The Board offers suggested input and agree to the Transport Board Forward Plan 2021.
Appendix A - Transport Board Forward Plan
39
Appendix A - Transport Board Forward Plan
New Anglia Transport Board Forward Plan
Date
Venue and Theme
Forward Looking
Transport East Core Themes
March 2021
Virtual meeting
As agenda
Energising coastal communities
Supporting a year-round tourist industry
Local and Coastal
Potential unlocked through transport
investment
Reliable A47, A12 and A14 corridors
15 June 2021
Regional Connectivity and Our
Comprehensive Spending Review
Multi-centred growth
Priority Places
Clean growth - Transport Decarbonisation
Creating links between our high growth
Plan, alternative fuels
clusters
ITS: Major Road Network, integrated ticketing,
Better connected and mobile workforce
supporting growth - sectors/locations.
Supporting new settlements
Transport East update - draft strategy
Improved public spaces and access to town
consultation
centres
6 Sep 2021
Connecting the East,
Comprehensive Spending Review
Global gateways, connecting the country to
Accessing the World
Clean growth - rail electrification
world markets
ITS: Ports and airports, RIS pipeline, rail,
Better connected ports and airports
BREXIT
Raising our profile as a place of rapid regional
Transport East update - strategy consultation
economic growth
Agile to Change
Clean growth
Resilient and low carbon transport network
ITS: Mobility as a Service, electric vehicles,
Early adoption of emerging technologies
use of data
Expansion of infrastructure to support the
Transport East update
growth of EVs
40