Energy Sector
Data Pack
Version Final Draft
DRAFT & CONFIDENTIAL
Contents
Page
-
Introduction to the Sector Data Pack
3
-
Introduction to and Definition of the Energy Sector
3
-
The Energy Sector in New Anglia
4
o Overview
5
o GVA
7
o Employment
10
o Enterprises
29
o Wages
36
-
Energy Sector Skills Supply and Demand
38
o Qualifications
39
o Further Education Learning Aims analysis
40
o Apprenticeships
47
o Labour Insight Jobs tool sector analysis
50
o
‘Where the Work is’ tool sector analysis
57
-
A Future View of the Energy Sector
59
-
Appendices
68
o Energy sector definition
2
Introduction to the Sector Data Pack
The role of the Sector Data Pack is to bring together the latest socio-economic and labour market data and present both an up-to-date, and
future view, of the sector and any underlying issues within the area that could impact upon it. Data is presented in a navigable format without
comment with interpretation at this stage left to the reader
The Data Pack informs the Sector Evidence Report, the key findings from which help to inform the priorities developed in the Sector Skills Plan.
The Sector Evidence Report is also summarised within the Sector Skills Plan and appears in full in the its appendices.
In most instances data has been analysed and presented down to local authority level. In some instances, and even where local authority data
is available, it has not been presented in the data pack due to issues of unreliability and small sample sizes. This is particularly the case with
data from the Annual Population Survey and the Annual Survey of Hours and Earnings.
Introduction to and Definition of the Energy Sector
New Anglia’s Energy Sector is internationally significant, with major operational energy infrastructure assets and planned infrastructure
development across the key industries of Offshore Wind, Oil and Gas, Nuclear and Low Carbon Renewable Energy.
The unique combination of geographical phenomena, established, deep rooted expertise and investment spanning over 50 years- has helped
shape a world leading energy presence. At an aggregate level New Anglia’s combined energy output plays a pivotal role in securing the UK’s
ongoing energy demands; an output that is set to grow significantly throughout the 21st century. Furthermore, the combination of development,
expansion of existing assets and decommissioning programmes- draws together a sector of significant economic value and market opportunity;
supported by extensive, high quality, supply chains.
For the purposes of this work we have agreed with the New Anglia LEP to follow their existing definition of the Energy sector, as detailed within
the current Strategic Economic Plan (SEP) (2017). This definition focuses on the core elements of activity - oil, gas, offshore wind, onshore
wind and renewable technologies and nuclear.
3
The Energy Sector in
New Anglia
4
Overview
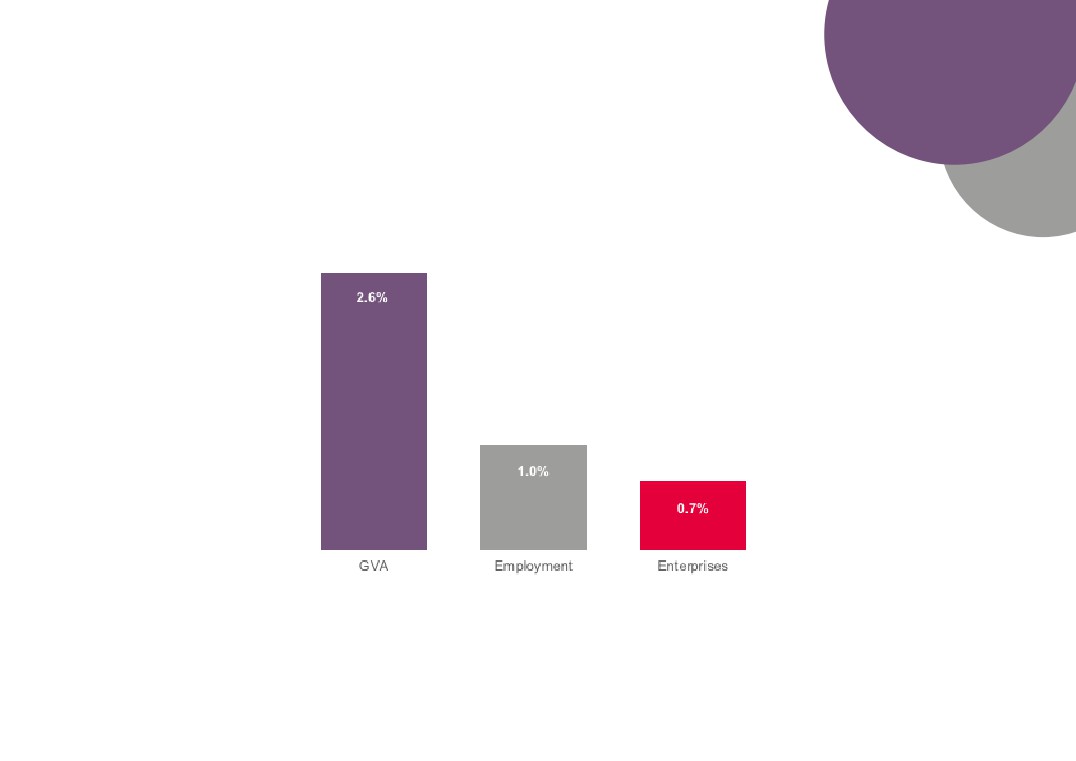
Energy sector contribution to the local economy
£940m
7,800
400
Source: New Anglia LEP Economic Strategy evidence base work
5
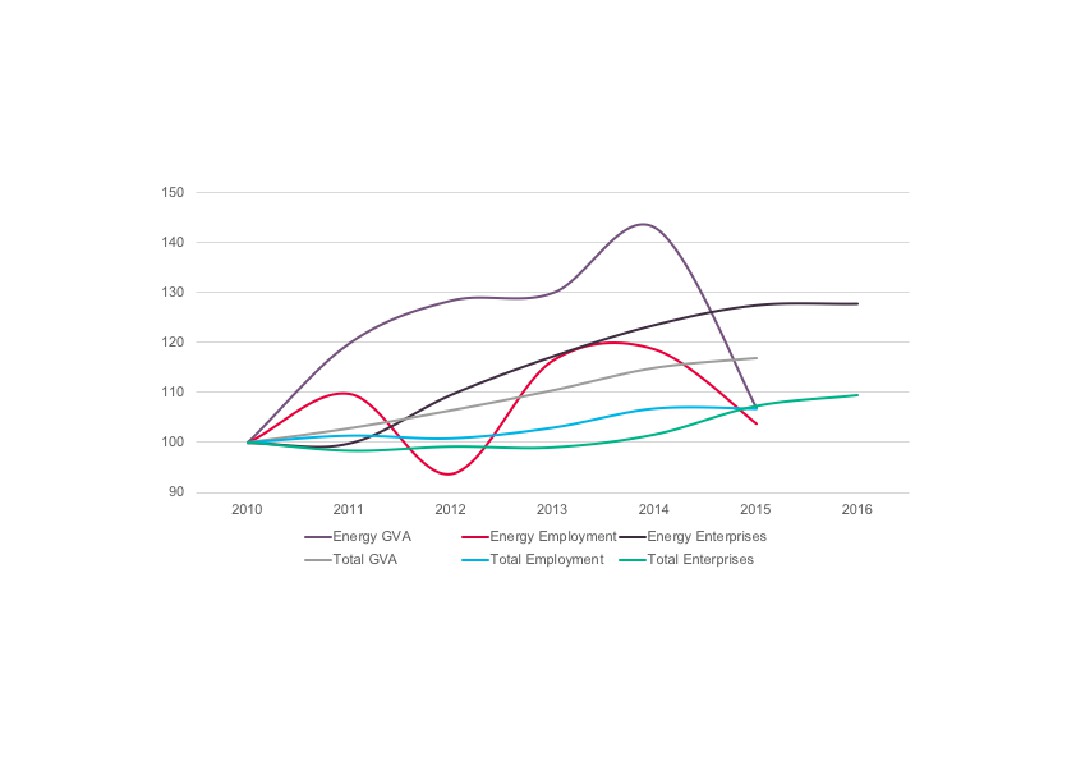
Energy sector contribution to growth in the local economy (2010=100)
Source: New Anglia LEP Economic Strategy evidence base work
6
Gross Value
Energy sector GVA (£m) across comparator
Added (GVA)
areas, 2015
New Anglia
£912m
Norfolk
£438m
Suffolk
£474m
Aberdeen City and Aberdeenshire
£2,248m
Please note that the figure for New Anglia’s
Cumbria LEP
£260m
Energy sector GVA is different to that reported
on page 6 due to a different source being used
Greater Lincolnshire LEP
£771m
for this information. This is so to enable
comparison with other areas across the UK.
Heart of the South West LEP
£1,207m
Humber LEP
£583m
South East LEP
£2,131m
Tees Valley LEP
£686m
East of England Region
£2,981m
Source: Sub-regional Gross Value Added (GVA), Office for National Statistics
7
Proportion of total GVA produced by the
Energy sector across comparator areas, 2015
New Anglia
2.6%
Norfolk
2.4%
Suffolk
2.8%
Aberdeen City and Aberdeenshire
12.4%
Cumbria LEP
2.3%
Greater Lincolnshire LEP
3.7%
Heart of the South West LEP
3.5%
Humber LEP
3.3%
South East LEP
2.5%
Tees Valley LEP
5.4%
East of England Region
2.0%
United Kingdom
3.5%
Source: Sub-regional Gross Value Added (GVA), Office for National Statistics
8
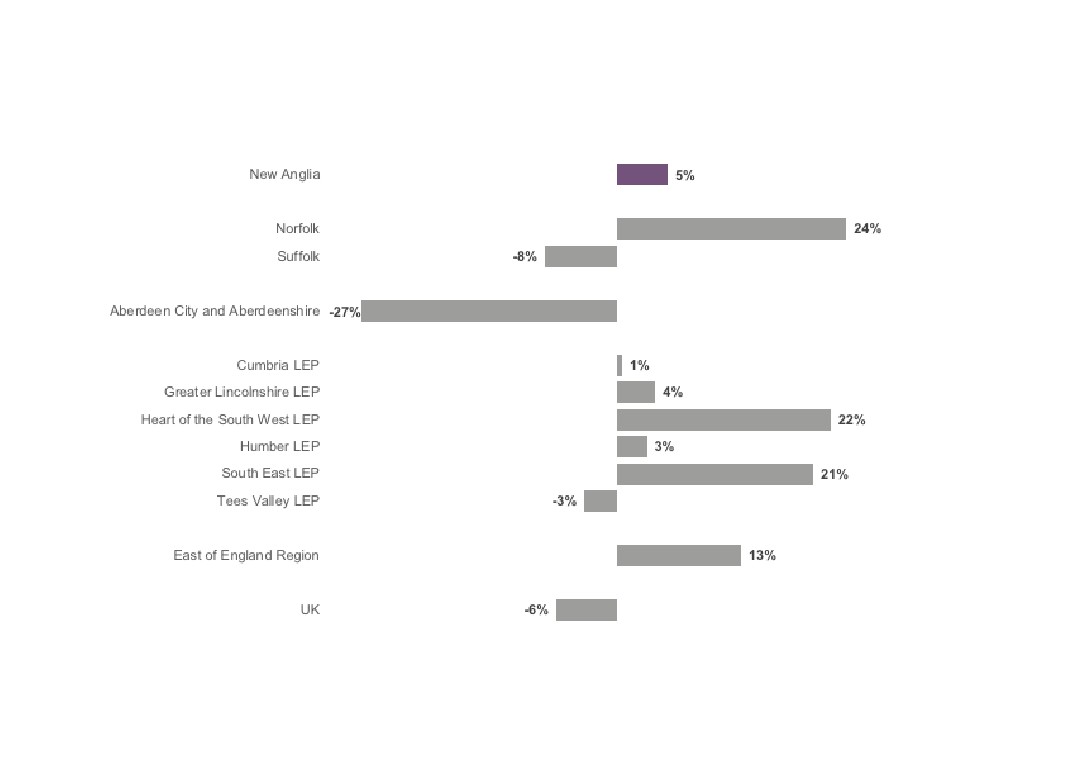
Change in Energy sector GVA across
comparator areas (2010 - 2015)
Sources: Sub-regional Gross Value Added (GVA), Office for National Statistics
9
Employment
Energy sector across comparator areas, 2015
New Anglia
7,450
Norfolk
2,645
Suffolk
4,715
Aberdeen City and Aberdeenshire
33,745
Cumbria
12,485
Greater Lincolnshire
7,600
Please note that the figure for New Anglia’s
Heart of the South West
5,250
Energy sector employment is different to that
reported on page 6 due to a different source being
Humber
6,725
used for this information. This is so to enable
comparison with other areas across the UK.
South East
10,040
Tees Valley
5,365
East of England
20,290
Source: Business Register and Employment Survey, Office for National Statistics
10
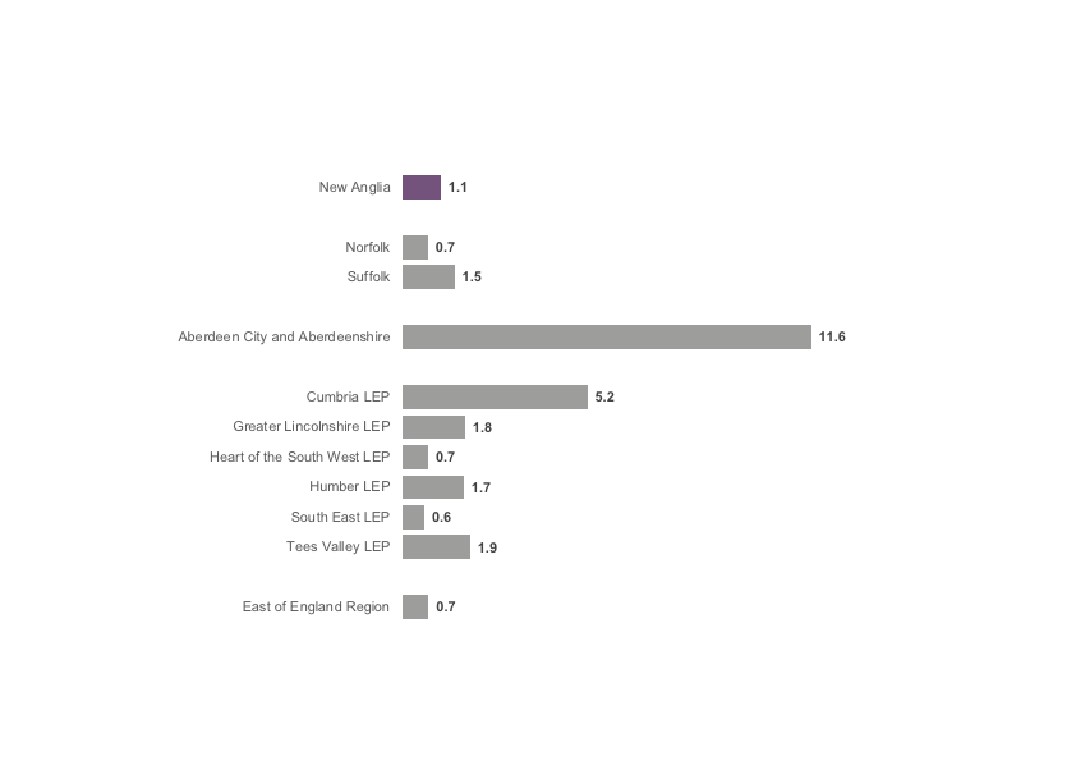
Proportion of employment provided by the
Energy sector across comparator areas, 2015
New Anglia
1.1%
Norfolk
0.7%
Suffolk
1.5%
Aberdeen City and
11.7%
Aberdeenshire
Cumbria
5.3%
Greater Lincolnshire
1.8%
Heart of the South West
0.7%
Humber
1.8%
South East
0.6%
Tees Valley
2.0%
East of England
0.8%
United Kingdom
1.0%
Source: Business Register and Employment Survey, Office for National Statistics
11
Energy sector employment across New
Anglia, 2015
Great Yarmouth
1,700
Ipswich
1,600
Suf folk Coastal
1,000
Waveney
700
St Edmundsbury
600
South Norfolk
300
Broadland
300
Norwich
300
North Norfolk
300
King`s Lynn and West Norfolk
300
Babergh
200
Breckland
100
Mid Suffolk
100
Forest Heath
0
Source: Business Register and Employment Survey, Office for National Statistics
12
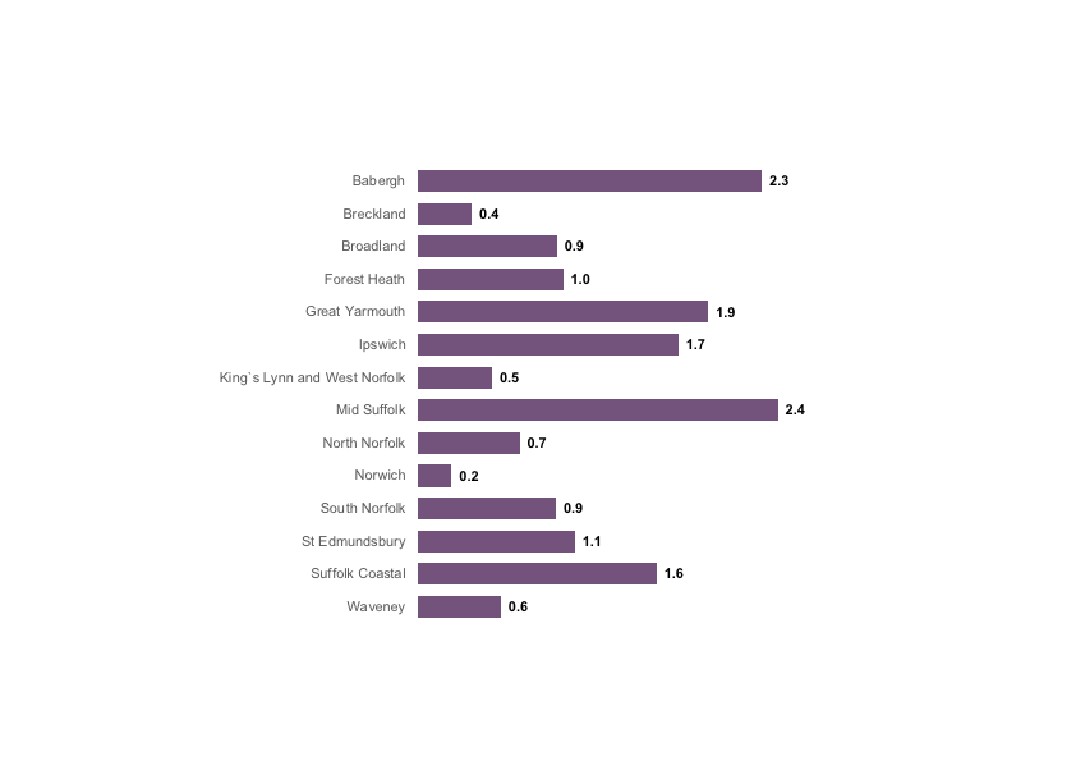
Proportion of employment provided by the
Energy sector across New Anglia, 2015
Breckland
0.4%
Broadland
1.0%
Great Yarmouth
1.9%
Kings Lynn and West
0.5%
Norfolk
North Norfolk
0.7%
Norwich
0.2%
South Norfolk
1.0%
Babergh
2.4%
Forest Heath
1.0%
Ipswich
1.8%
Mid Suffolk
2.5%
St Edmundsbury
1.1%
Suffolk Coastal
1.6%
Waveney
0.6%
Source: Business Register and Employment Survey, Office for National Statistics
13
Energy sub-sector employment: Mining / extraction, refining,
manufacture, and operation of terminals and pipelines
1,635
New Anglia
1,340
950
Norfolk
900
690
Suffolk
395
Aberdeen City and
30,900
Aberdeenshire
26,760
10,070
Cumbria
10,250
2,805
Greater Lincolnshire
2,575
2015
150
Heart of the South West
290
2010
4,100
Humber
3,495
1,100
South East
1,865
2,480
Tees Valley
3,565
Source: Business Register
and Employment Survey,
Office for National Statistics
2,745
East
3,005
14
Energy sub-sector employment: Electricity generation, storage, and
transmission (incl. fuels, nuclear, offshore, biomass)
2,480
New Anglia
1,900
310
Norfolk
270
2,120
Suffolk
1,500
510
Aberdeen City and Aberdeenshire
640
2015
Source: Business Register
and Employment Survey,
Office for National Statistics
2010
Cumbria
125
960
Greater Lincolnshire
615
1,910
Heart of the South West
3,550
1,110
Humber
1,440
2,150
South East
2,450
810
Tees Valley
1,880
4,300
East
2,950
15
National proportions of employees, turnover and businesses
by Low Carbon and Renewable Energy (LCRE) Group, 2014
Employees (full-time
16%
3%5%
67%
5% 4%
equivalents)
Turnover (£ thousands)
23%
3%
13%
50%
3% 9%
Number of businesses
26%
4%
8%
56%
5%
0%
100%
Low carbon electricity
Low carbon heat
Energy from waste & biomass
Energy efficient products
Low carbon services
Low emission vehicles etc.
Source: Low Carbon and Renewable Energy Industrial activity, 2014, Office for National Statistics
16
National proportions of employees, turnover and businesses
by Low Carbon and Renewable Energy (LCRE) Group by
broads industrial group, 2014
Employees (full-time
equivalents)
Turnover (£ thousands)
Number of businesses
0%
20%
40%
60%
80%
100%
Manufacturing
Energy and water
Construction
Wholesale and retail trade
Transportation and storage
Information and communication
Real estate activities
Professional, scientific, technical activities
Other
Source: Low Carbon and Renewable Energy Industrial activity, 2014, Office for National Statistics
17
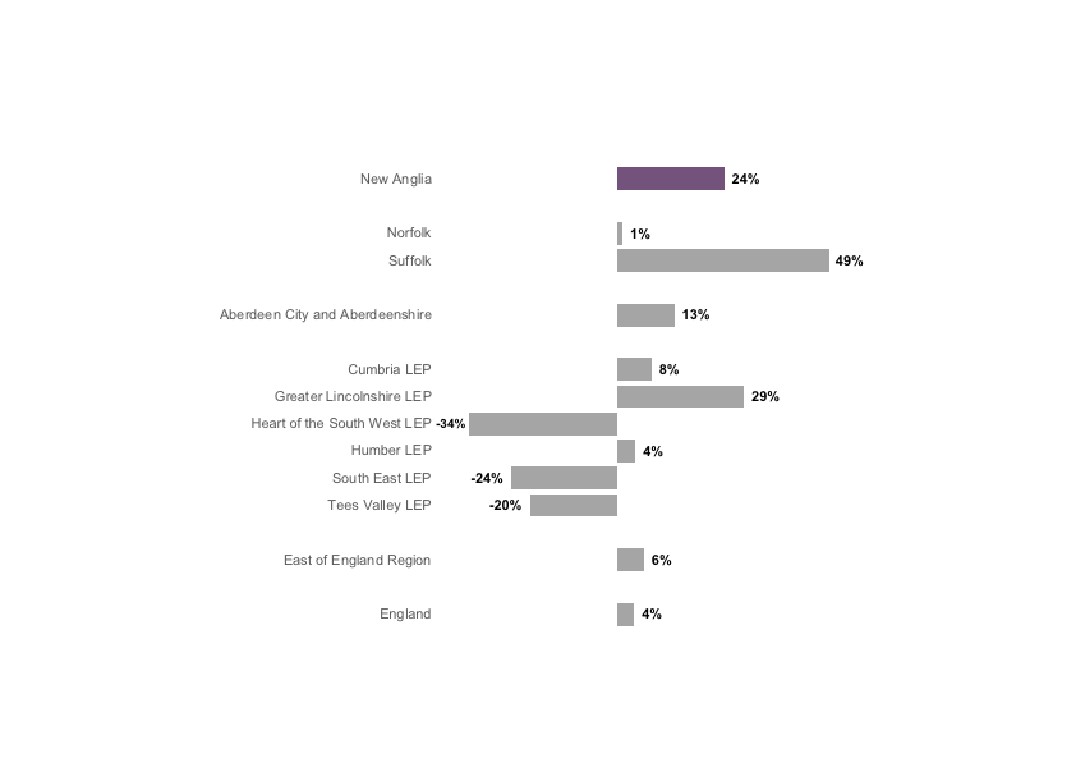
Change in Energy sector employment
across comparator areas, 2010 - 2015
Source: Business Register and Employment Survey, Office for National Statistics
18
Change in Energy sector employment
across New Anglia, 2010 - 2015
Babergh
429%
Breckland
-33%
Broadland
31%
Forest Heath
-19%
Great Yarmouth
1%
Ipswich
26%
King`s Lynn and West Norfolk
8%
Mid Suffolk
211%
North Norfolk
0%
Norwich
14%
South Norfolk
-2%
St Edmundsbury
-4%
Suffolk Coastal
9%
Waveney
156%
Source: Business Register and Employment
Survey, Office for National Statistics
19
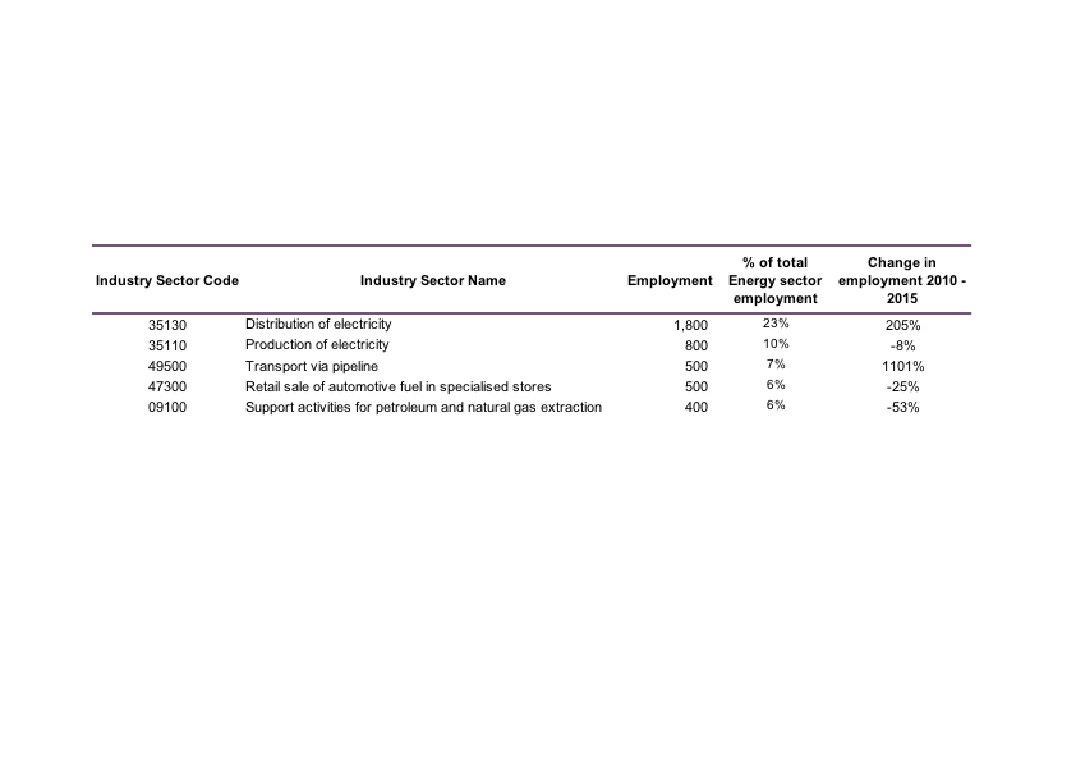
Top 5 Energy sub sectors (in employment terms), 2015
Source:
20
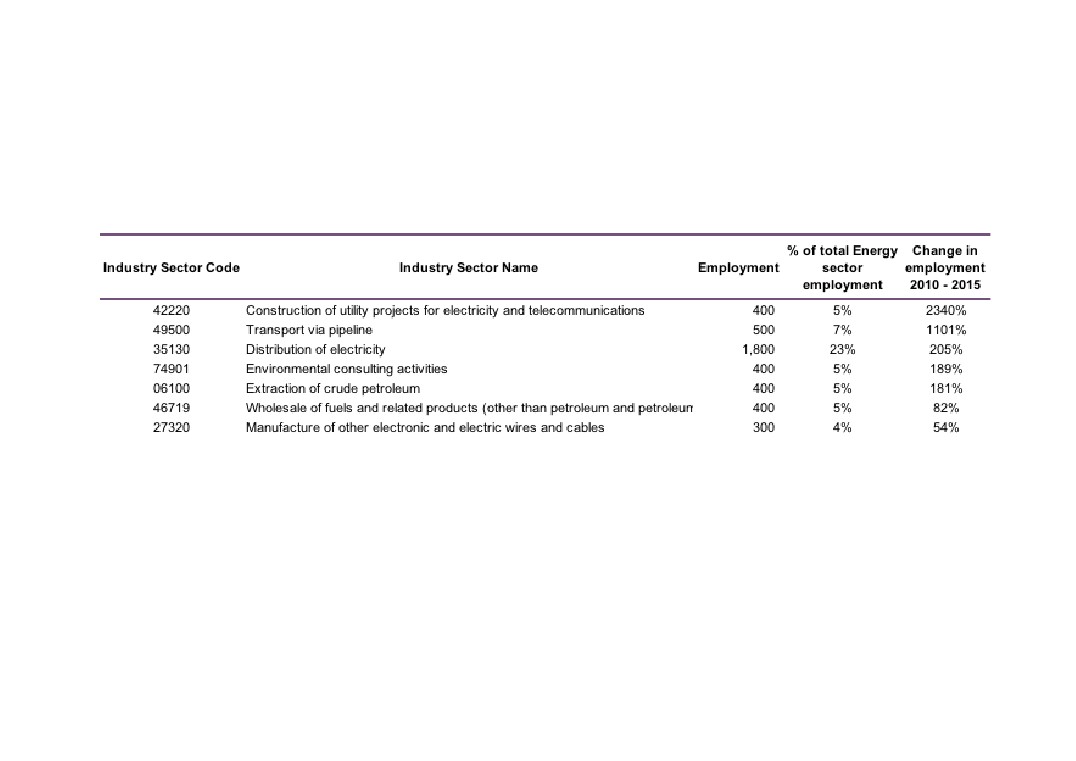
Top growth Energy sub sectors with 100 employees or more
Source:
21
Energy sector location quotients
across comparator areas, 2015
Location quotients (LQs) are a
useful way of showing a sectors
importance to the local economy
relative to the national picture. The
analysis presented here uses
employment with an LQ above 1
showing a higher concentration than
nationally, and an LQ of below than
1 a lower concentration.
Source: Business Register and Employment Survey, Office for National Statistics
22
Energy sector location quotients across
New Anglia, 2015
Source: Business Register and Employment Survey, Office for National Statistics
23
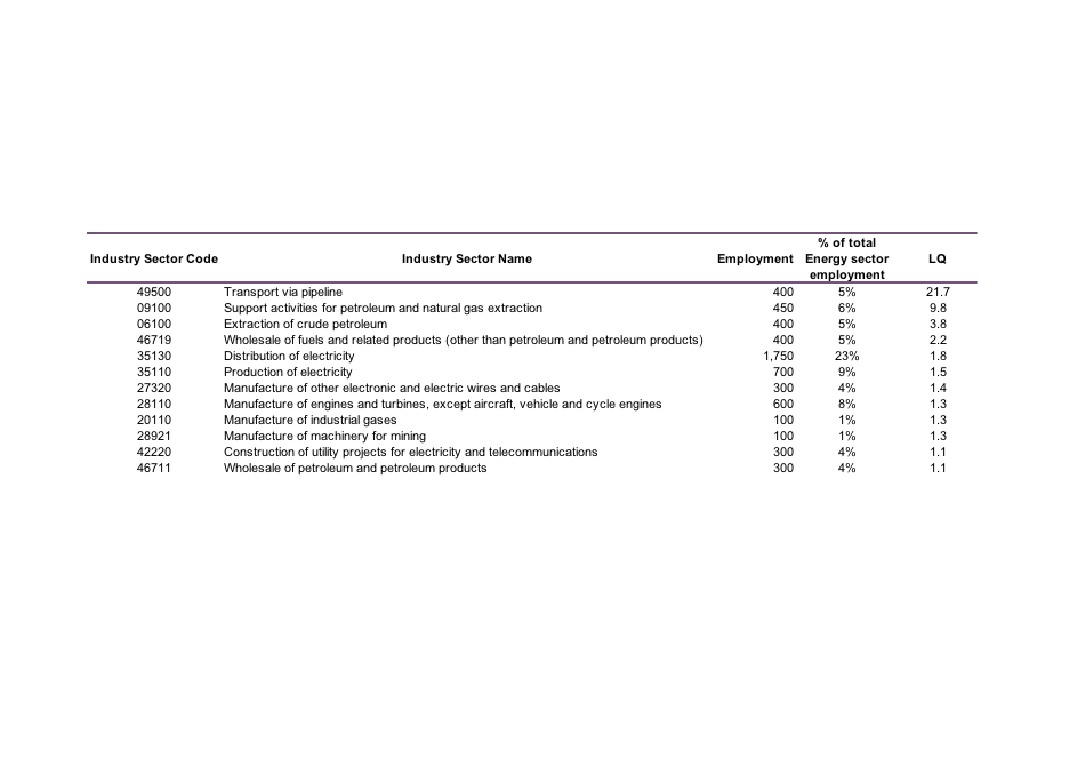
Energy sub sectors with 100+ employees and location
quotients (LQs) above 1
Source: Business Register and Employment Survey 2015, Office for National Statistics
24
Full time, part time, and self-employment
in the Energy Sector, 2015
New Anglia
57%
29%
14%
Energy
83%
8%
9%
0%
Full time
Part time
Self Employed
100%
Source: New Anglia LEP Economic Strategy evidence base work
25
Change in full time, part time, and self-employment in
the Energy sector, 2010 - 2015
18.3%
Full time
8.7%
Energy
New Anglia
-9.4%
Part time
2.1%
-47.6%
Self employed
10.0%
Source: New Anglia LEP Economic Strategy evidence base work
26
0%
100%
New Anglia LEP
35%
23%
21%
22%
Norfolk
35%
22%
21%
22%
Suffolk
36%
23%
20%
21%
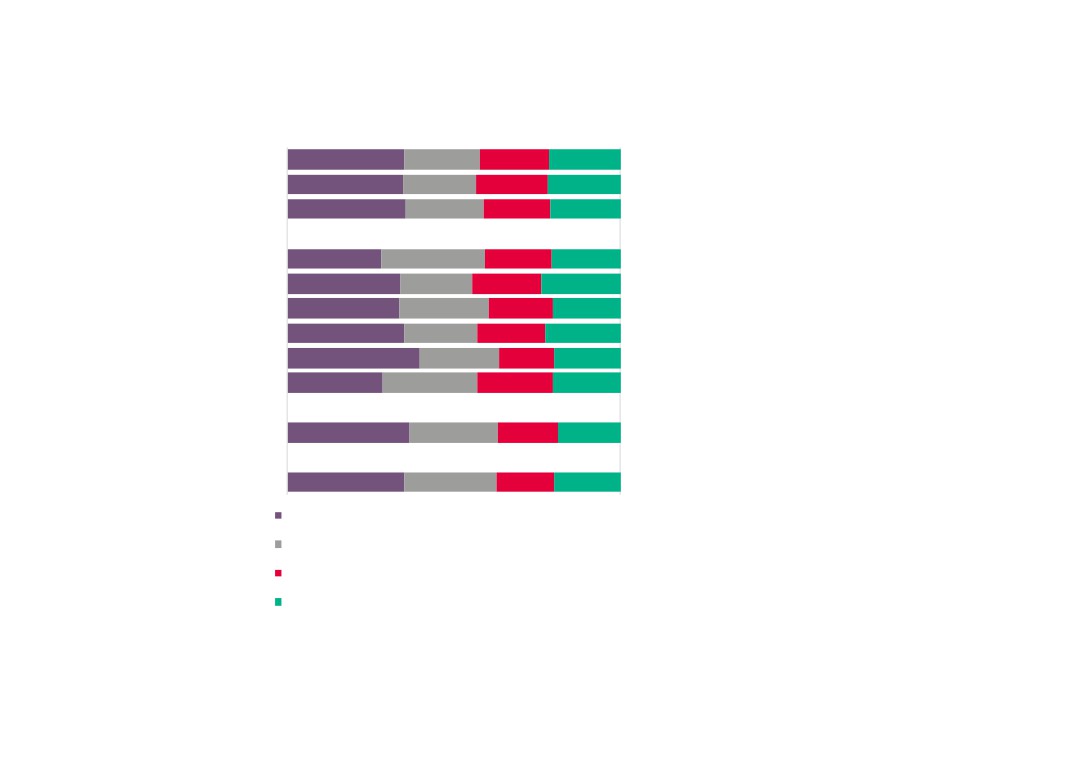
Workplace Energy sector
Cumbria LEP
28%
31%
20%
21%
employment 2011 by broad
Greater Lincolnshire LEP
34%
22%
21%
24%
Heart of the South West LEP
33%
27%
19%
20%
Standard Occupational
Humber LEP
35%
22%
20%
23%
Classification (SOC) across
South East LEP
40%
24%
17%
20%
comparator areas
Tees Valley LEP
28%
28%
23%
20%
Source: 2011 Census, Office for National Statistics
East of England Region
37%
27%
18%
19%
England
35%
28%
17%
20%
112 Production Managers and Directors
212 Engineering Professionals
311 Science, Engineering and Production Technicians
812 Plant and Machine Operatives
27
0%
100%
Breckland
40%
18%
15%
27%
Broadland
42%
22%
15%
21%
Great Yarmouth
29%
27%
24%
20%
King`s Lynn and West Norfolk
30%
18%
26%
26%
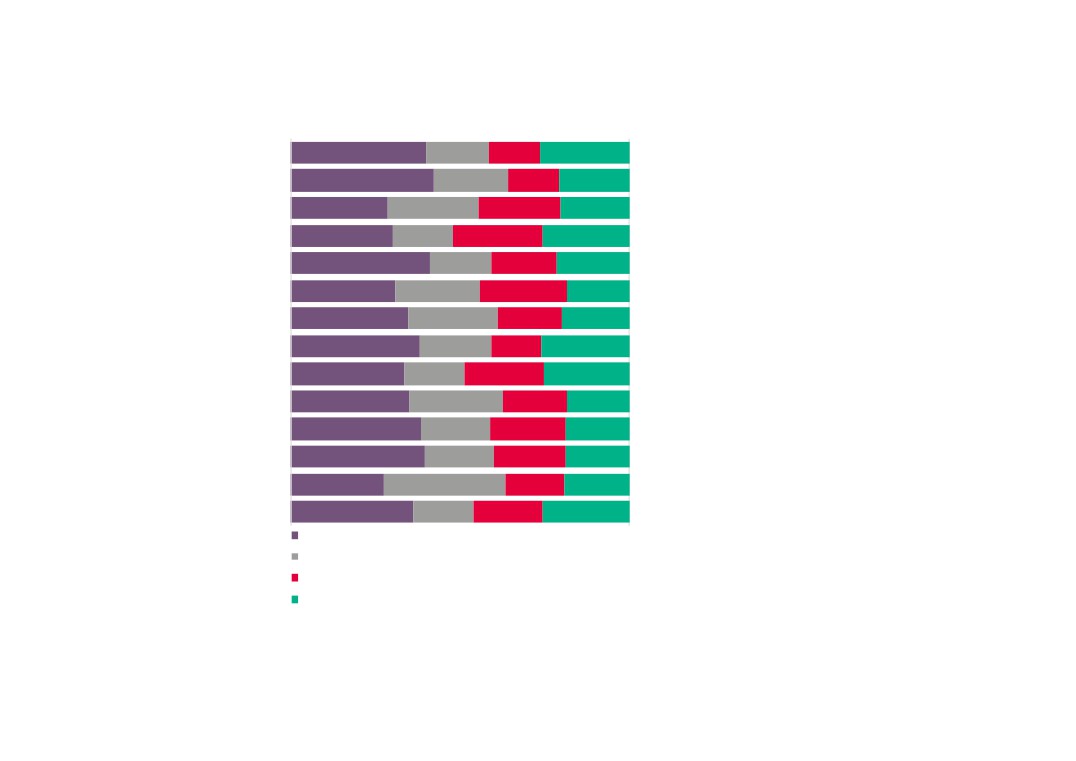
Workplace Energy sector
North Norfolk
41%
18%
19%
22%
employment 2011 by broad
Norwich
31%
25%
26%
19%
Standard Occupational
South Norfolk
35%
27%
19%
20%
Classification (SOC) across
Babergh
38%
21%
15%
26%
New Anglia
Forest Heath
34%
18%
24%
25%
Ipswich
35%
27%
19%
19%
Source: 2011 Census, Office for National Statistics
Mid Suffolk
39%
20%
22%
19%
St Edmundsbury
40%
20%
21%
19%
Suffolk Coastal
28%
36%
18%
19%
Waveney
36%
18%
21%
26%
112 Production Managers and Directors
212 Engineering Professionals
311 Science, Engineering and Production Technicians
812 Plant and Machine Operatives
28
Enterprises
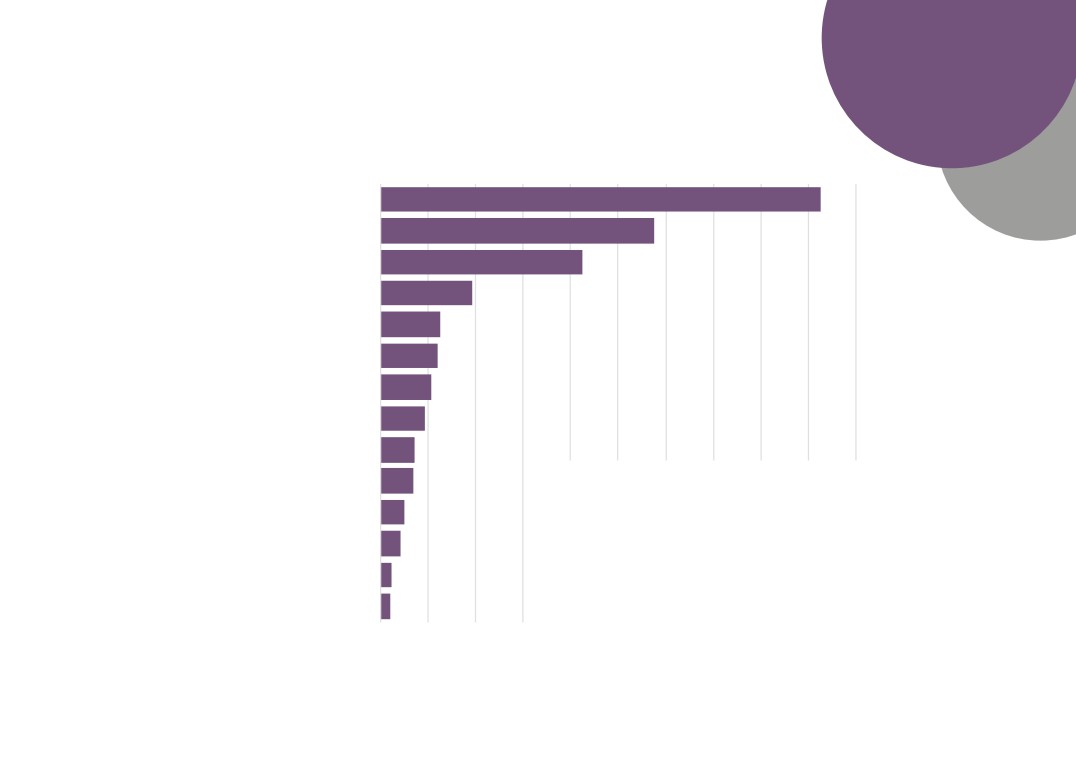
Energy sector enterprise numbers across
comparator areas, 2016
New Anglia
375
Norfolk
185
Suffolk
190
Please note that the figure for New Anglia’s
Energy sector enterprises is different to that
reported on page 6 due to a different source being
used for this information. This is so to enable
Aberdeen City and Aberdeenshire
360
comparison with other areas across the UK.
Cumbria LEP
175
Greater Lincolnshire LEP
270
Heart of the South West LEP
500
Humber LEP
210
South East LEP
835
Tees Valley LEP
115
East of England Region
1,385
Source: UK Business Counts, Office for National Statistics
29
Energy sector enterprises as a proportion of total
enterprises across comparator areas, 2016
New Anglia
0.6%
Norfolk
0.6%
Suffolk
0.7%
Aberdeen City and Aberdeenshire
1.6%
Cumbria LEP
0.7%
Greater Lincolnshire LEP
0.7%
Heart of the South West LEP
0.7%
Humber LEP
0.7%
South East LEP
0.5%
Tees Valley LEP
0.7%
East of England Region
0.5%
England
0.6%
Source: UK Business Counts, Office for National Statistics
30
Energy sector enterprise numbers across New Anglia, 2016
Suffolk Coastal
35
Norwich
30
Mid Suffolk
30
North Norfolk
25
King`s Lynn and West Norfolk
25
Breckland
25
St Edmundsbury
20
South Norfolk
20
Broadland
20
Waveney
15
Great Yarmouth
15
Forest Heath
15
Babergh
15
Ipswich
5
Source: UK Business Counts, Office for National Statistics
31
Energy sector enterprises as a proportion of total
enterprises across New Anglia, 2016
Babergh
0.4%
Breckland
0.5%
Broadland
0.4%
Forest Heath
0.6%
Great Yarmouth
0.5%
Ipswich
0.1%
King`s Lynn and West Norfolk
0.5%
Mid Suffolk
0.6%
North Norfolk
0.6%
Norwich
0.7%
South Norfolk
0.4%
St Edmundsbury
0.4%
Suffolk Coastal
0.6%
Waveney
0.4%
Source: UK Business Counts, Office for National Statistics
32
New Anglia
90%
7%
3%
Cumbria LEP
93%
7%
Greater Lincolnshire LEP
89%
8%
2%
Heart of the South West LEP
91%
7%
1%
Energy sector enterprises
Humber LEP
89%
7%
4%
South East LEP
90%
8%
2%
by size across
Tees Valley LEP
94%
2%
2%
comparator areas, 2016
Aberdeen City
82%
9%
5%
3%
Aberdeenshire
94%
3%
1%
East of England Region
90%
7%
2%
Please note that at Local Authority level that
businesses employing more than 250 people are
England
89%
8%
2%
not reported due to their very small numbers and
No. of employees
resulting disclosive nature.
Micro (0 to 9)
Small (10 to 49)
Medium-sized (50 to 249)
Large (250+)
Source: UK Business Counts, Office for
Babergh
88%
13%
National Statistics
Breckland
100%
Broadland
100%
Forest Heath
100%
Great Yarmouth
89%
4%
7%
Ipswich
100%
Energy sector
King`s Lynn and West Norfolk
100%
Mid Suffolk
100%
enterprises by size
North Norfolk
90%
10%
across New Anglia, 2016
Norwich
93%
7%
South Norfolk
100%
St Edmundsbury
100%
Suffolk Coastal
100%
Waveney
95%
5%
33
Change in Energy enterprises across
comparator areas, 2010 - 2016
New Anglia
29%
Norfolk
28%
Suffolk
46%
Aberdeen City and Aberdeenshire
38%
Cumbria LEP
35%
Greater Lincolnshire LEP
35%
Heart of the South West LEP
72%
Humber LEP
31%
South East LEP
62%
Tees Valley LEP
35%
East of England Region
49%
England
60%
Source: UK Business Counts, Office for National Statistics
34
Babergh
-40%
Breckland
25%
Broadland
300%
Forest Heath
200%
Great Yarmouth
-25%
Change in Energy
Ipswich
0%
enterprises across New
King`s Lynn and West Norfolk
0%
Anglia, 2010 - 2016
Mid Suffolk
100%
Sources: UK Business Counts, Office for
National Statistics
North Norfolk
25%
Norwich
200%
South Norfolk
100%
St Edmundsbury
0%
Suffolk Coastal
40%
Waveney
0%
35
Wages
Energy sector wages - Median gross annual pay all
employees (UK)
£45,257
Production managers and directors in mining and energy (1123)
(3%)
£43,818
£41,142
Mechanical engineers (2122)
(2%)
£40,158
Source: Annual Survey
£44,636
of Hours and Earnings,
Electrical engineers (2123)
(4%)
Office for National
£43,051
Statistics
£46,376
Electronics engineers (2124)
(20%)
£38,517
£38,486
(4%)
Production and process engineers (2127)
£36,865
£30,883
Figures in brackets
Electrical and electronics technicians (3112)
(3%)
denote percentage
£30,110
change between 2014
and 2016
£34,650
Engineering technicians (3113)
(4%)
£33,175
£29,125
Planning, process and production technicians (3116)
(0.1%)
£29,104
2016
£25,660
2014
Science, engineering and production technicians n.e.c. (3119)
(1%)
£25,507
£29,094
Energy plant operatives (8124)
(6%)
£27,343
Energy sector wages - Median gross annual pay full time employees (UK)
£45,257
Production managers and directors in mining and energy (1123)
(4%)
£43,452
£41,745
Mechanical engineers (2122)
(2%)
£40,759
£44,802
Source: Annual Survey
(3%)
Electrical engineers (2123)
of Hours and Earnings,
£43,698
Office for National
Statistics
£46,511
(12%)
Electronics engineers (2124)
£41,446
£38,648
Production and process engineers (2127)
(5%)
£36,916
Figures in brackets
£32,530
denote percentage
Electrical and electronics technicians (3112)
(8%)
change between 2014
£30,203
and 2016
£35,039
Engineering technicians (3113)
(4%)
£33,652
£29,570
(-0.3%)
Planning, process and production technicians (3116)
£29,672
2016
£26,276
(-1%)
Science, engineering and production technicians n.e.c. (3119)
2014
£26,526
£31,440
Energy plant operatives (8124)
(8%)
£29,109
37
Energy Sector Skills Supply
and Demand
38
Qualifications
Production (Agriculture, Energy and Water) Workplace
Qualifications across Comparator Areas, 2011
New Anglia
19%
17%
17%
14%
19%
14%
Cumbria LEP
20%
19%
18%
13%
19%
11%
Greater Lincolnshire LEP
20%
18%
17%
13%
17%
15%
Heart of the South West LEP
18%
18%
19%
14%
20%
10%
Humber LEP
18%
17%
18%
15%
20%
13%
South East LEP
17%
17%
17%
13%
21%
14%
Tees Valley LEP
14%
15%
16%
17%
25%
14%
Source: 2011 Census, Office for National Statistics
East of England Region
18%
17%
17%
13%
21%
13%
England
16%
17%
17%
14%
25%
12%
No qualifications
Level 1 qualifications
Level 2 qualifications
Level 3 qualifications
Level 4 qualifications and above
Apprenticeships and other qualifications
39
FE Learning
Aims
All data (unless stated otherwise) is sourced from the Department for Education’s Further Education data library
In order to present information that is relevant to New Anglia LEPs high performing and underpinning sectors then we have
identified FE and skills provision data split by Sector Lead Body and aligned a best-fit with each sector.
The Sector Lead Bodies identified as being the most relevant to the Energy sector are: Chemicals, Life sciences, Pharmaceuticals, Nuclear,
Oil, Gas, Petroleum, Polymer; Energy & Utility; and Engineering Construction Industry.
However, not all FE and Skills learning aims align with a sector lead body. In fact, on average around two thirds are classed as unknown. This
means that we are basing results here on roughly a third of the data.
Please note that all data is rounded to the nearest 10 and that therefore some figures presented may not add to the sum totals presented.
40
Energy sector learning aims delivered to New Anglia
learners by Sector Lead Body, 2012/13
0%
10%
20%
30%
40%
50%
60%
70%
80%
90%
100%
New Anglia
230
170
100
National
13,100
11,400
2,500
Chemicals, Life sciences, Pharmaceuticals, Nuclear, Oil, Gas, Petroleum, Polymer
Energy & Utility
Engineering Construction Industry
Source: FE Data Library, Department for Education
41
Energy sector learning aims delivered to New Anglia learners
by Sector Lead Body, 2010/11 and 2012/13
580
270
230
170
100
70
2010/ 11
2012/13
Chemicals, Life sciences, Pharmaceuticals, Nuclear, Oil, Gas, Petroleum, Polymer
Energy & Utility
Engineering Construction Industry
Source: FE Data Library, Department for Education
42
Change in Energy sector learning aims delivered to New Anglia
learners by Sector Lead Body, 2010/11 - 2012/13
11%
Total inc. Unknown
9%
4%
Total not inc. Unknown
7%
-46%
Energy
-12%
-15%
Chemicals, Life sciences, Pharmaceuticals, Nuclear, Oil,
Gas, Petroleum, Polymer
7%
-71%
Energy & Utility
-29%
43%
Engineering Construction Industry
0%
Source: FE Data Library, Department for Education
New Anglia
National
43
Energy sector learning aims delivered to New Anglia
residents by New Anglia based and external providers by
Sector Lead Body, 2012/13
0%
10%
20%
30%
40%
50%
60%
70%
80%
90%
100%
Energy
170
330
Chemicals, Life sciences, Pharmaceuticals, Nuclear, Oil, Gas,
40
190
Petroleum, Polymer
Energy & Utility
30
140
Engineering Construction Industry
100
-
Total inc. unknown
158,480
52,170
Total with unknown removed
55,340
24,770
New Anglia Provider
External Provider
Source: FE Data Library, Department for Education
44
Energy learning aims delivered to New Anglia learners by domiciled
providers by Sector Lead Body, 2010/11 and 2012/13
210
100
70
60
40
30
2010/ 11
2012/ 13
Chemicals, Life sciences, Pharmaceuticals, Nuclear, Oil, Gas, Petroleum, Polymer
Energy & Utility
Engineering Construction Industry
Source: FE Data Library, Department for Education
45
Change in Energy sector learning aims delivered to New Anglia learners
by domiciled providers by Sector Lead Body, 2010/11 - 2012/13
5%
Total inc. Unknown
9%
-38%
Total not inc. Unknown
7%
-50%
Energy
-13%
-43%
Chemicals, Life sciences, Pharmaceuticals, Nuclear,
Oil, Gas, Petroleum, Polymer
7%
-86%
Energy & Utility
-29%
67%
Engineering Const ruction Industry
0%
New Anglia National
Source: FE Data Library, Department for Education
46
Apprenticeships
Energy sector apprenticeship starts by year
5
8
5
6
15
5
5
5
5
5
5
5
5
5
15
10
5
5
2011/ 12
2012/13
2013/14
2014/ 15
Engineering Construction
Sustainable Resource Management
The Gas Industry
The Power Industry
The Water Industry
Source: Skills Funding Agency Data Cube
47
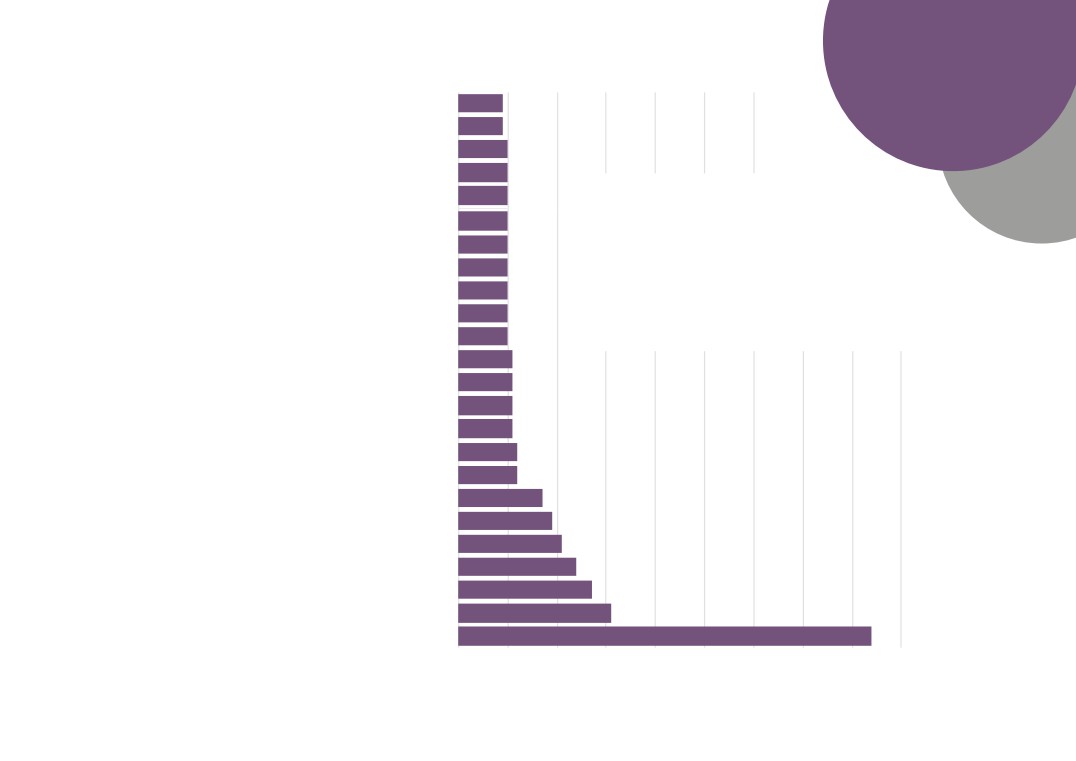
Apprenticeship participation by sector, 2014/15
Human health and social work activities
5,840
Wholesale and retail trade
2,560
Accomodation and food service activities
1,900
Manufacturing
1,820
Construction
1,740
Administrative and support service activities
1,350
Education
1,330
Professional, scientific and technical activities
900
Other service activities
780
Arts, entertainment and recreation
680
Public administration and defence
570
Transportation and storage
540
Financial and insurance activities
520
Information and communication
370
Agriculture, Forestry and Fishing
350
Real estat e activities
290
Mining and Quarrying
50
Water supply, sewerage, waste management and remediation acitivities
40
Electricity, gas, steam and air conditioning supply
10
Source: FE Data Library, Department for Education
48
Apprenticeship participation in the Energy sector
2014/15 as a proportion of total participation
0.2%
New Anglia
0.05%
0.2%
0.1%
East of England
0.04%
0.4%
0.04%
UK
0.4%
0.5%
Mining and Quarrying
Electricity, gas, steam and air conditioning supply
Water supply, sewerage, waste management and remediation acitivities
Source: FE Data Library, Department for Education
49
Labour Insight
Jobs
The following section presents data from Labour Insight, a Burning Glass analytical tool. This tool collects details of online job
postings from multiple sources and enables the analysis of these postings based on specific skills, educational requirements,
and job titles, for example.
Please note that whilst Labour Insight will capture more information on the jobs market than more traditional Department for
Work and Pensions vacancy data, the fact that not all job vacancies are advertised means that there will still be gaps in the
findings.
According to the Labour Insight Jobs tool, then there were 1,654 postings for the sector in New Anglia between Jan. 1, 2012
and Dec. 31, 2016.
The definition for the Energy sector in this exercise is wider than that we have defined using SIC codes (and is in fact in line
with that used to approximate GVA for the sector) but it still provides us with some useful information on vacancy numbers and
types.
The definition used in this exercise captures the following industry and sectors: ‘Mining and Quarrying’, and ‘Electricity, Gas,
Steam, and Air Conditioning supply’.
50
Location
0
50
100
150
200
250
300
350
400
450
500
Great Yarmouth
Norwich
Ipswich
Waveney
St Edmundsbury
Breckland
Broadland
Suf folk Coastal
South Norfolk
Forest Heath
Energy sector vacancies
Mid Suffolk
across New Anglia, Jan
King's Lynn and West Norfolk
2012 - Dec 2016
North Norfolk
228 unspecified or unclassified postings
Babergh
Source: Labour Insight Jobs, Burning Glass
Technologies
51
Recruiters
Beacon Hill Resources
E.ON UK
Industry Resource Services Ltd
Top Energy
Twinserve Ltd
Dereham Water Supplies International Ltd
Sector Employers
BFEU Global
across New
The Great Yarmouth Advertiser
BP
Anglia, Jan 2012
Utilita
- Dec 2016
Haven Power
968 unspecified or unclassified postings
Arc Norwich Ltd
Source: Labour Insight Jobs,
Royal Dutch Shell
Burning Glass Technologies
Drax Group
Forum Energy
Baker Hughes Incorporated
Southern Electric
China Africa Resources
National Grid
Expro International Group
Condor Resources
SSE PLC
Big Green Company
Edf Energy
Fugro
Centrica
0
10
20
30
40
50
60
70
52
Occupation
Health & safety officers (3567)
Plant and machine operatives n.e.c. (8129)
Sales related occupations n.e.c. (7129)
Estimators, valuers and assessors (3531)
Energy sector
Quality assurance and regulatory professionals (2462)
Science, engineering and production technicians n.e.c. (3119)
vacancies by
Production and process engineers (2127)
occupation, Jan
Design and development engineers (2126)
Sales supervisors (7130)
2012 - Dec 2016
Other skilled trades n.e.c. (5449)
15 unspecified or unclassified postings
Metal working machine operatives (8125)
Source: Labour Insight Jobs, Burning
Production managers and directors in manufacturing (1121)
Glass Technologies
Sales and retail assistants (7111)
Other administrative occupations n.e.c. (4159)
Sales accounts and business development managers (3545)
Quarry workers and related operatives (8123)
Managers and proprietors in other services n.e.c. (1259)
Engineering technicians (3113)
Mechanical engineers (2122)
Programmers and software development professionals (2136)
Plumbers and heating and ventilating engineers (5314)
Engineering professionals n.e.c. (2129)
Electrical and electronic trades n.e.c. (5249)
Business sales executives (3542)
Civil engineers (2121)
0
20
40
60
80
100
120
140
160
53
Job Title
Receptionist
Drilling Engineer
Shot Blaster
Petroleum Engineer
Operations Technician
Energy sector
Commercial Gas and Oil Fired Service Breakdown Engineer
vacancies by job title,
Instrumentation Technician
Electrical Technician
Jan 2012 - Dec 2016
Control and Automation Engineer
0 unspecified or unclassified postings
Business Development Executive
Source: Labour Insight Jobs, Burning Glass
Technologies
Meter Reader
Safety Engineer
Supervisor
Systems Engineer
Merchandiser
Sales Consultant
Engineering Manager
Diamond Driller
Project Engineer - Oil & Gas
Sales Engineer
Process Engineer
Structural Engineer
Sales Manager
Sales Executive
0
10
20
30
40
50
60
70
80
90
54
Qualification
Requirements
13
25
63
143
Energy sector vacancies by
qualification level required,
Jan 2012 - Dec 2016
1,252 unspecified or unclassified postings
Source: Labour Insight Jobs, Burning Glass Technologies
73
85
Bachelor's degrees, graduate certificates and diplomas
Level 4 diplomas and certificates, HNCs, Level S/NVQs
GCSEs, Standard Grades, and Level 2 S/NVQs
A-Levels, Highers, and Level 3 S/NVQs
Foundation degrees and HNDs
Post graduate degrees, Level 5 S/NVQs, certificates and
diplomas
55
Skills
Requirements
Operations Management
Technical Support
Energy sector
Procurement
Sales Management
vacancies by skills
Comput er Aided Draughting / Design (CAD)
Supervisory Skills
required, Jan 2012
Business Development
Sales Engineering
- Dec 2016
536 unspecified or unclassified postings
Engineering Industry Background
Customer Contact
Source: Labour Insight Jobs, Burning
Glass Technologies
Budgeting
Workplace Health and Safety
Microsoft Office
Mechanical Engineering
Contract Management
Business Management
Repair
Microsoft Excel
Renewable Energy
Inspection
Customer Service
Sales
Civil Engineering
Wind Power
Project Management
0
20
40
60
80
100
120
140
160
56
Where the
Work is
The following analysis makes use of data and findings available via the online toolkit http://wheretheworkis.org/ . The findings presented
are a result of combining data from the UKCES ‘Working Futures’ programme and job vacancy data from the Labour Market Insight tool
developed by Burning Glass.
Limitations
Though the ‘Where the work is’ tool provides the a comprehensive and detailed free-to-use dashboard of supply and demand in the UK, the
following limitations should be taken into account when interpreting the data:
- Senior Management and Elementary roles
Occupations not open to recent HR graduates or FE finishers are not considered. Similarly, occupations that do not require an y formal
qualifications or training are also excluded from this tool, since the number of job-seekers cannot be meaningfully quantified.
- Matching supply and demand
Some occupations do not have specific qualifications or subject-specific requirements (such as sales, marketing and related associate
professionals). As a result of this, and despite the fact that many people with a broad range of qualifications can apply for these occupations,
they frequently appear ‘undersupplied’ in the tool, i.e. when the “job opportunity” is low. Occupations with very small sample sizes (either of
finishers or job postings) are excluded from the dataset.
- Internal and international migration
Some occupations do not rely solely on FE finishers or HE graduates from their immediate location. Many people travel to find work, often
moving across the country. Other occupations, such as those on the Migration Advisory Committee’s shortage occupation list, m ay rely more
heavily on jobseekers arriving from outside the UK.
- Online and offline postings
Burning Glass Technologies (BGT) acknowledge that not all jobs are posted online, although a comparison of the Annual Survey of Hours and
Earnings (ASHE) employment data and BGT postings data for UK in 2014 showed a 94 per cent correlation between ASHE and BGT
occupational distributions. The BGT posting data slightly overestimate the proportion of professional and associate professional occup ations,
while slightly underestimating the proportion of elementary occupations.
57
Location Quotient - Measure of Job Posting
Engineering Techs
0.85
Density relative to employment indexed to the
national density relative to employment
Number of Job Postings asking for entry-level
(2 years of experience or fewer) and school
Engineering Techs
173
331
226
leaver education levels, further education
levels, and higher education levels
School leaver
FE
HE
£30,500
Engineering Techs
£32,100
Advertised Salaries for Job Postings in 2015
£39,900
New Anglia
East of England
England
45
Opportunity Score - Score based on the
Engineering Techs
58
Demand Supply Ratio of FE postings
50
within a geography, from Very Low (0) to
Very High (100)
New Anglia
East of England
England
58
A Future View of the
Energy Sector
59
The following analysis uses data from the East of England Forecasting Model (EEFM) and the UKCES Working Futures data
(WF). In each case an Energy sector has been approximated from the sector splits available in each model. In the case of the
East of England Forecasting Model then ‘Mining & Quarrying’, ‘Utilities’, and ‘Waste & Remediation’ have been summed to
produce a definition of the Energy sector. For the Working Futures data, ‘Mining & Quarrying’, ‘Electricity & Gas’, and ‘Water &
Sewerage’ have been summed.
Please note that neither model, or the forecasts they produce, take into account the New Anglia LEPs ambitions for growth in
Gross Value Added (GVA) and employment.
60
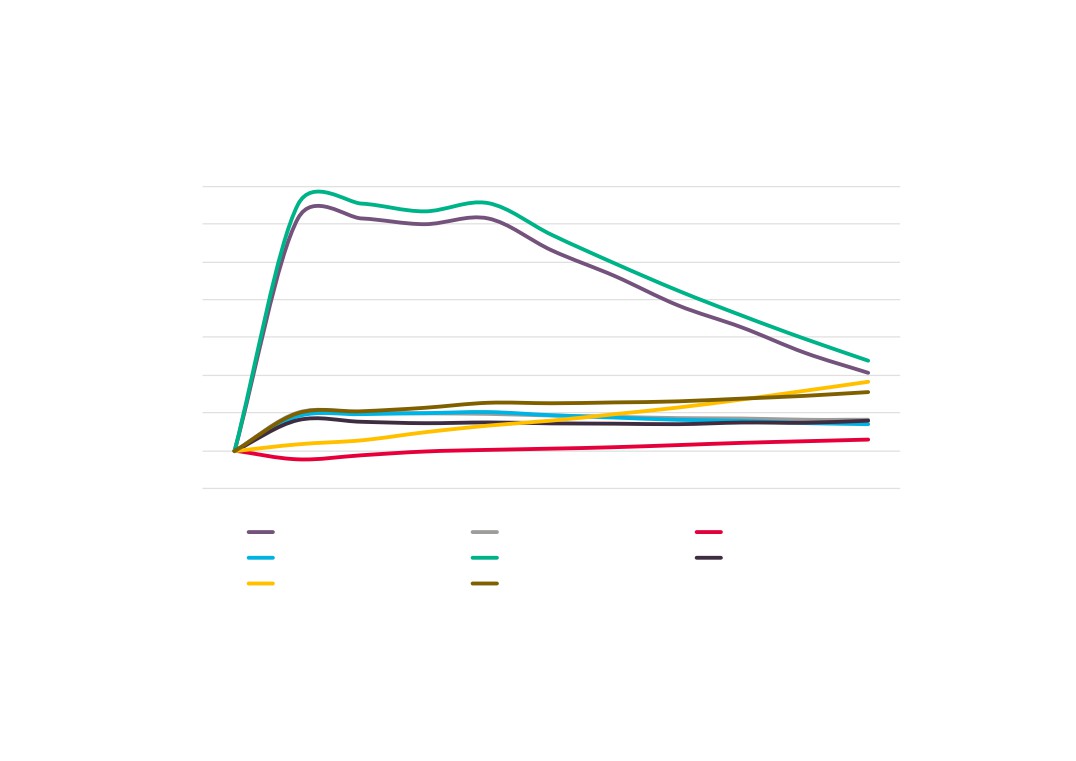
Forecasts for change in Energy sector employment
in New Anglia (2010 = 100)
170
160
150
140
130
120
110
100
90
2014
2015
2016
2017
2018
2019
2020
2021
2022
2023
2024
Mining & Quarrying (EEFM)
Utilities (EEFM)
Waste & Remediation (EEFM)
Energy (EEFM)
Mining & quarrying (WF)
Electricity & Gas (WF)
Water & Sewerage (WF)
Energy (WF)
Sources: East of England Forecasting Model, Cambridge Econometrics; UKCES Working Futures 2014 - 2024
61
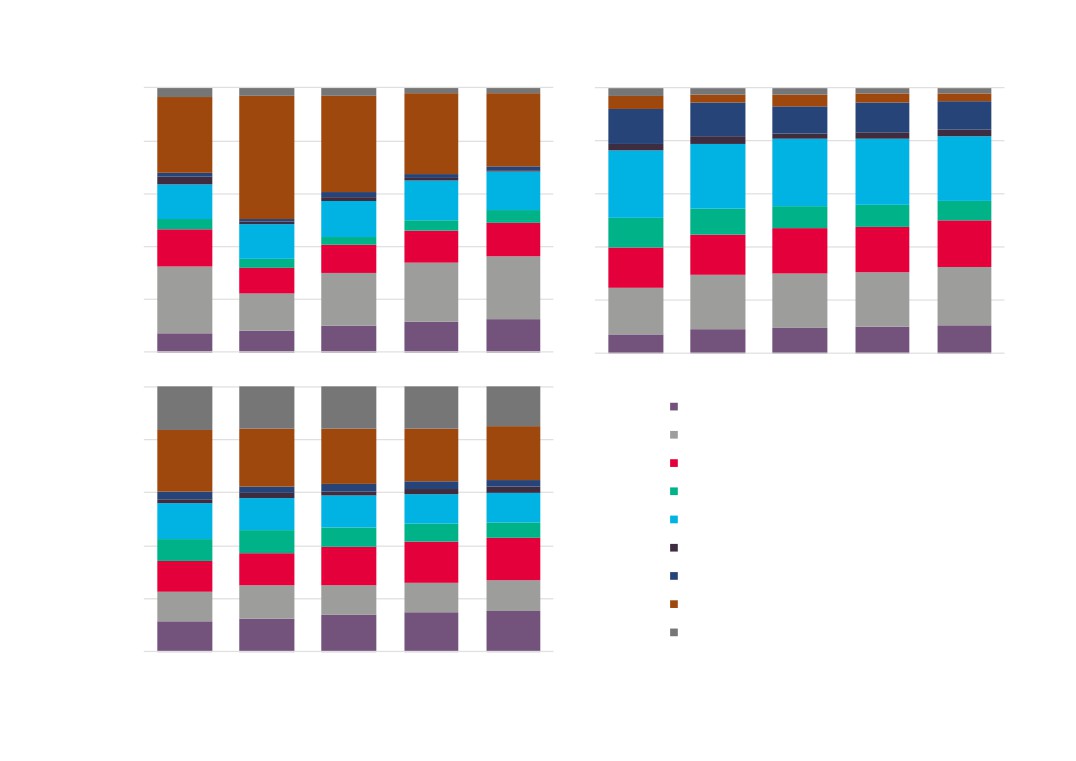
Occupational composition of employment in New
Anglia’s Energy sector over time
100%
8%
10%
10%
10%
10%
19%
17%
16%
80%
20%
17%
5%
5%
6%
5%
5%
60%
15%
17%
16%
16%
16%
7%
6%
7%
8%
8%
40%
15%
16%
14%
15%
13%
16%
16%
20%
15%
18%
15%
12%
13%
14%
9%
11%
0%
2004
2009
2014
2019
2024
Elementary occupations
Process, plant and machine operatives
Sales and customer service
Caring, leisure and other service
Skilled trades occupations
Administrative and secretarial
Associate professional and technical
Professional occupations
Managers, directors and senior officials
Source: UKCES Working Futures 2014 - 2024
62
Electricity and Gas
Mining & Quarrying
Electricity & Gas
100%
00%
11%
11%
13%
10%
13%
28%
29%
31%
80%
37%
80%
47%
25%
25%
24%
24%
25%
60%
15%
60%
13%
15%
7%
5%
8%
8%
14%
10%
4%
4%
11%
13%
3%
12%
40%
14%
12%
40%
17%
18%
17%
15%
11%
3%
15%
10%
24%
23%
20%
25%
20%
20%
20%
20%
21%
22%
14%
17%
10%
11%
12%
11%
7%
8%
0%
nced Manufacturing & Engineering
2004
2009
2014
2019
2024
100%
0%
10%
12%
12%
13%
14%
Managers, directors and senior officials
17%
11%
12%
14%
Professional occupations
80%
20%
14%
15%
13%
23%
14%
Associate professional and technical
14%
15%
16%
40%
8%
60%
8%
Administrative and secretarial
7%
7%
7%
13%
Skilled trades occupations
24%
23%
22%
60%
21%
40%
20%
8%
Caring, leisure and other service
3%
2%
3%
12%
3%
3%
Sales and customer service
80%
20%
22%
19%
19%
17%
16%
11%
Process, plant and machine operatives
7%
8%
8%
8%
8%
Elementary occupations
12%
100%
0%
Source: UKCES Working Futures 2014 - 2024
2004
Water & Sewerage
Energy sector replacement and expansion demand by
occupation (top 5 in terms of net requirement), 2014 - 2024
-1,000
1,000
3,000
5,000
All occupations
Transport and mobile machine drivers
and operatives
Science, research, engineering and
technology professionals
Corporate managers and directors
Business and public service associate
professionals
Skilled metal, electrical and electronic
trades
Expansion demand
Replacement demand
Net requirement
Source: UKCES Working Futures 2014 - 2024
64
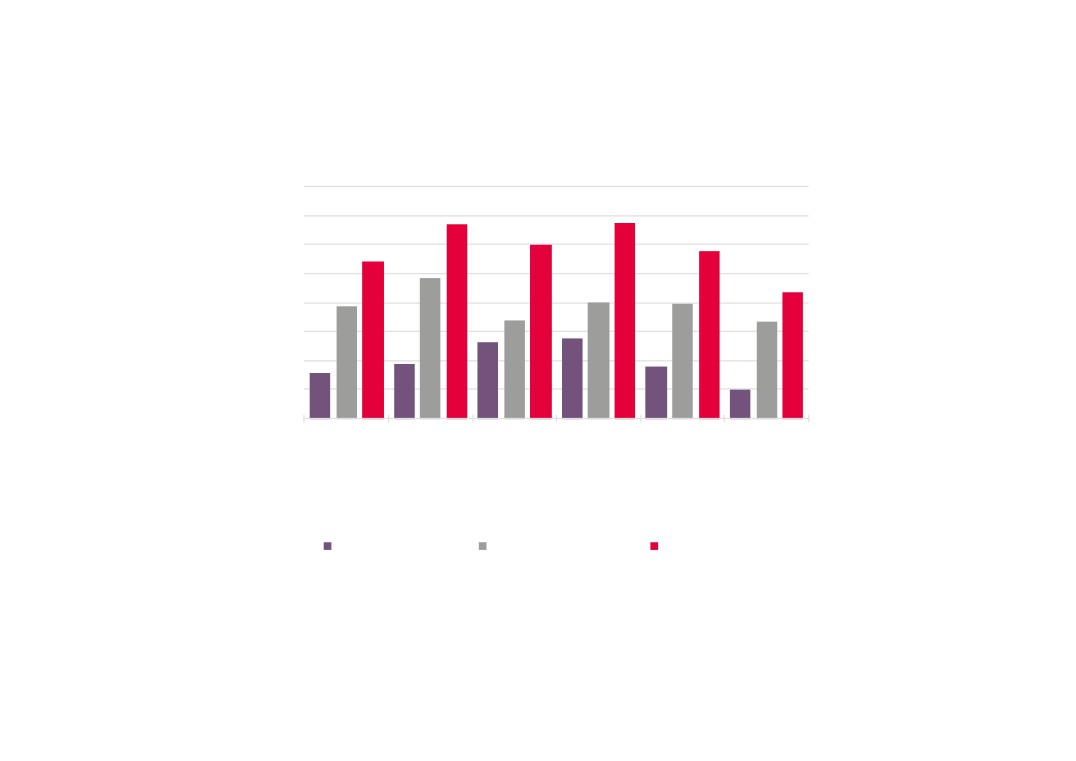
Energy sector replacement and expansion demand as a
proportion of employment by occupation, 2014 - 2024
80%
70%
60%
50%
40%
30%
20%
10%
0%
All
Transport
Science,
Corporate
Business
Skilled metal,
occupations and mobile
research,
managers
and public
electrical and
machine
engineering
and directors service
electronic
drivers and
and
associate
trades
operatives technology
professionals
professionals
Expansion demand
Replacement demand
Net requirement
Source: UKCES Working Futures 2014 - 2024
65
Energy sector replacement and expansion demand by
qualification, 2014 - 2024
-500
0
500
1,000
1,500
2,000
QCF 7-8
QCF 4-6
QCF 3
QCF 2
QCF 1
No Qual
Expansion Demand
Replacement Demand
Please note that the Working Futures data uses the
following breakout of qualification levels:
QCF8 - Doctorate
QCF7 - Other higher degree
QCF6 - First degree
QCF5 - Foundation degree; Nursing; Teaching
QCF4 - HE below degree level
QCF3 - A level & equivalent
QCF2 - GCSE (A-C) & equivalent
QCF1 - GCSE (below grade C) & equivalent
No Q - No Qualification
66
Energy sector qualifications, 2014 - 2024
2024
10%
35%
18%
23%
11%
3%
Source: UKCES Working Futures 2014 - 2024
2014
7%
27%
21%
23%
15%
7%
QCF 7-8
QCF 4-6
QCF 3
QCF 2
QCF 1
No Qual
Please note that the Working Futures data uses the
following breakout of qualification levels:
QCF8 - Doctorate
QCF7 - Other higher degree
QCF6 - First degree
QCF5 - Foundation degree; Nursing; Teaching
QCF4 - HE below degree level
QCF3 - A level & equivalent
QCF2 - GCSE (A-C) & equivalent
QCF1 - GCSE (below grade C) & equivalent
No Q - No Qualification
67
Appendix 1 - Energy sector definition
The following five digit SIC codes are being used to measure levels of, and change in, both employment and business numbers in the sector.
Please note that multipliers have been applied to those SIC codes under ‘Maritime support services (excl. distribution) and ‘Logistical support
and distribution activities (excl. mains and pipelines) in order to only capture the elements of these activities that directly relate to the energy
sector. This is in line with the methodology used to define the sector in the New Anglia Local Economic Strategy evidence base work.
69